

For more than 65 hours this month, NASA’s high-altitude ER-2 aircraft flew from Fairbanks over melting sea ice, glaciers, forests, permafrost, lakes, volcanoes and more. It zigged and zagged over the Beaufort Sea, and soared straight over the Bagley Ice Field.
The goal: to use a laser altimeter called MABEL to take elevation measurements over specific points and paths of land, sea and ice. To hit these marks, scientists and pilots painstakingly designed and refined flight routes. And then they adjusted those routes again to capture cloud-free views – a tricky proposition in a giant state with mountains creating complex weather systems.
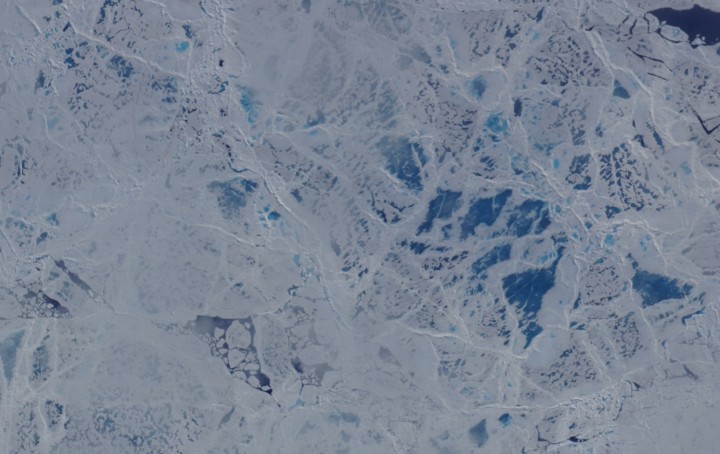
A camera on the MABEL instrument captured pictures of cracked sea ice, dotted with melt ponds, during a flight to the North Pole. (Credit: NASA)
“We have targets to the north, targets to the south, and mountain ranges blocking both,” said Kelly Brunt, a research scientist at NASA’s Goddard Space Flight Center who was MABEL’s science flight planner.
Scientists studying forests, glaciers, water and more are using MABEL data to develop software programs for the upcoming ICESat-2 satellite mission, and sent Brunt lists of what they would like to be included in the Alaska campaign.
“We get everybody’s input, and start to put it on a map,” she said. She drafts routes with targets in similar weather patterns, so that if one is clear the others are likely to be as well. However, often targets are removed from a route, based on the weather assessment from the morning of the flight. During the deployment, routes are also constructed to target specific sites that were missed during previous flights for either weather or aircraft reasons. Lots of the work goes into straightening the flight line, Brunt said, since when the aircraft banks at 65,000 feet, the laser instruments swivel off their ground track and the scientists can lose miles worth of measurements.
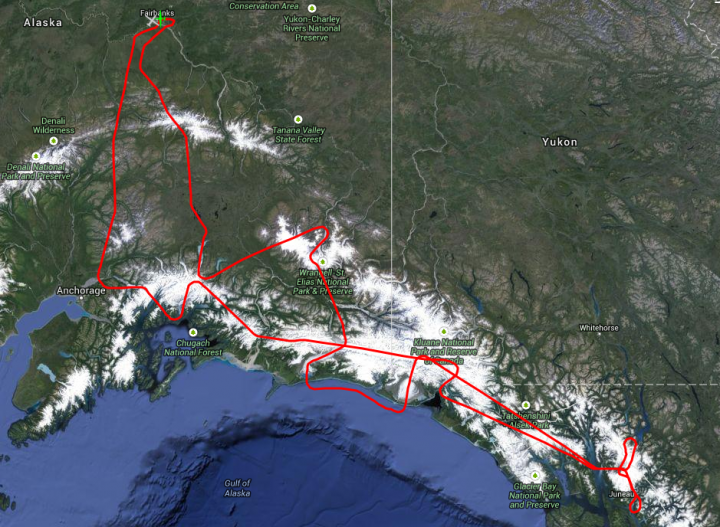
The MABEL campaign’s July 24 flight route covered glaciers, ice fields, forests, the Gulf of Alaska and more. (Credit: NASA)
One flight to measure sea ice was pretty direct – it took the pilot straight to the North Pole over one longitude line, circled around and came back on another. A second route involved a zig-zag pattern over the Arctic. But both routes were designed to capture a range of summer ice conditions, including melt ponds, large stretches of open water, and small openings in the sea ice, known as leads.
Flights over Alaska itself were often mapped to pass over glaciers, lakes, ocean moorings or even tide gauges that others have measured before, to compare with the data MABEL collected. Students from the Juneau Icefield Research Program (JIRP) assisted MABEL researchers by providing ground-based GPS validation for a mission that flew over the upper Taku Glacier, close to a JIRP camp. And the MABEL team collaborated with NASA Goddard scientists flying a different instrument, called Goddard’s LiDAR, Hyperspectral and Thermal (G-LiHT) Airborne Imager – the two campaigns flew some of the same paths over interior Alaskan forests.
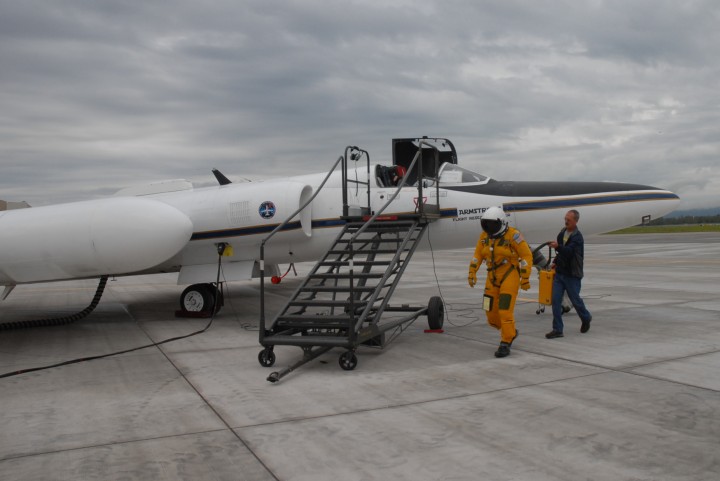
NASA ER-2 pilot Denis Steele, in a pressurized flight suit, before a July 16 flight over Alaska’s glaciers. (Credit: Kate Ramsayer/NASA)
From Fairbanks, Brunt worked with the campaign’s two pilots, Tim Williams and Denis Steele, to ensure the routes would work with the ER-2’s capabilities; and with weather forecasters to determine where to best focus efforts the following day.
In all, the campaign flew 7 flights out of Fairbanks. And today, the ER-2 – with MABEL aboard – flies back to California, collecting even more data about the elevation of the landscape along the way.
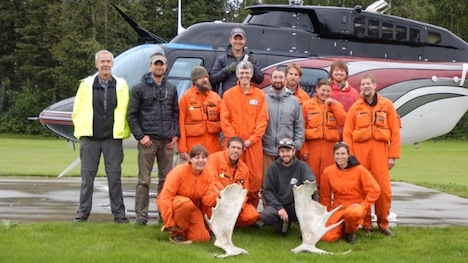
The USFS Forest Inventory & Analysis (FIA) crew before departing Delta Junction by helicopter to sample a remote field plot. Front Row: Katie Rigby, Misha Yatskov, Dan Irvine, Ashley Lehman; 2nd Row: Ken Winterberger, Chad Oukrop, Eric Straley, Seth Ayotte, Brendt Mueller, Michelle Hansen, Warren Childe, Ray Koleser; and 3rd Row: Pilot Josh Toal, Matt O’Driscoll, Warren Childe.
The Alaska G-LiHT Campaign is a partnership between scientists and NASA and the U.S. Forest Service (USFS). The design for the research is to link field measurements of forest structure, vegetation composition, and soils with airborne remote sensing data from G-LiHT. At this stage of the mission, the flight planning looks a little like a technicolor version of Pac-Man. Pink lines on the flight GPS units intersect points showing the location of ground measurements. In flight, the goal is to gobble as many of these dots as possible. Sometimes you wonder if the familiar “wocka wocka” noise of the old video game can be heard above the noise of the engine.
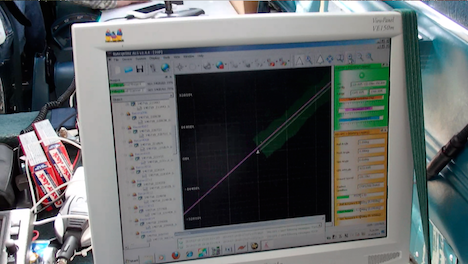
G-LiHT flight computer during data acquisition. The swath of lidar data appears green, the flight line pink, and real-time information on ranging distance and laser returns.
NASA and USFS partners have also worked hard to connect G-LiHT flights to other research activities in the valley. Within NASA, overlapping G-LiHT and MABEL flights are planned to characterize ice cover high in the Alaska Range west of Denali and across the Nebesna Glacier in Wrangell-St. Elias. Overlapping coverage is also planned with two hyperspectral missions from USGS (PI Ray Kokaly) and the U.S. Army Corps of Engineers (PI Steve Newman), offering the chance to compare different hyperspectral imaging systems and share ground calibration data.
G-LiHT flights will also cover a range of existing forest inventory plots collected by collaborators at the Department of Defense lands (Dan Rees), National Park Service (Carl Roland, Colin Malone), and the Alaska Department of Natural Resources (Chris Maisch, Doug Hanson). A dense network of flight lines is planned in and around the Bonanza Creek Experimental Forest and the Caribou Poker Creek Research Watershed to cover research plots established by scientists at the University of Alaska Fairbanks (Jaime Hollingsworth, Glenn Juday, and David McGuire, among others).
Further afield, still more dots on the flight plan represent long-term studies of forest recovery from fire. More than 40 percent of the watershed has burned since 1950, and G-LiHT will sample about 80 percent of large wildfires that have burned over the past 60 years. Record rainfall this summer has kept fire activity in check, but G-LiHT data from 2014 will also provide a benchmark for assessing changes from fires in coming years. Each of these intersecting lines and points represents a new opportunity for collaboration with the Alaska G-LiHT Campaign in 2014.
Text by Doug Morton
NASA’s Goddard Space Flight Center
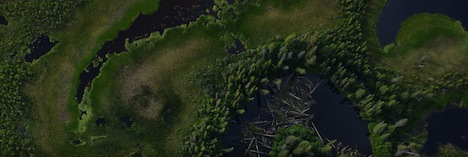
G-LiHT DSLR image of forests and open water near the Tetlin National Wildlife Refuge east of Tok, Alaska. Credit: NASA
I have always enjoyed looking out the window of a plane. From the typical cruising altitude of a commercial jetliner, the view of lakes and fields and mountains is familiar (but still fascinating) to a NASA scientist used to looking at Earth from space. Vegetation and land use follow the topography in predictable ways — agricultural fields on the flattest lands and dense forest cover on the warm, south-facing slopes.
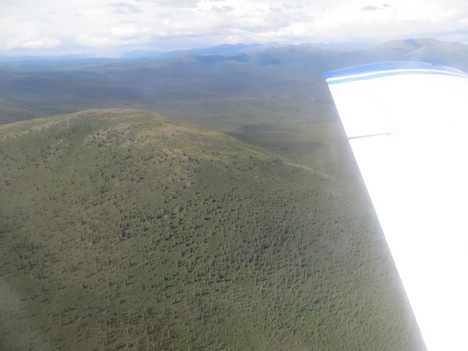
Spruce forest in the Yukon-Charley Rivers National Preserve north of Delta Junction, Alaska. Credit: Ross Nelson/NASA’s Goddard Space Flight Center
In Alaska, the G-LiHT campaign is flying low and slow to provide a very detailed look at forest structure, topography, wetlands, and forest health. At 1,100 feet above ground level, the view from above is stunning. Looking down, you see individual trees, small polygons formed by permafrost, and subtle changes in topography that allow vegetation to flourish on dry ground or wallow in the wetlands of the Tanana flats. Small black spruce trees, barely head high and the width of a dinner plate, are packed together in stands too thick to walk through. Looking out, you can see the vast expanse of the Tanana Valley, a lush green carpet of forest. The braided channels of the river flash in the sunlight as the milky white water heads out of the mountains. Ahead, the steep rise of the Alaska Range signals the end of another flight line.
Seeing the landscape from the same perspective as the G-LiHT sensors provides essential context for the project. The G-LiHT operators on the plane can switch between the real-time view of the incoming data stream and the landscape below. G-LiHT PI Bruce Cook noted, “it’s a little dizzying to watch the imagery fly by on the screen, but matching the bird’s eye view to the data gives an idea of what is possible with the analysis and interpretation of the G-LiHT data.”
Update: As of July 19, the piper had flown more than 70 hours for data collection (9,300 miles), and with more than half of the planned flight lines in the Tanana region completed.
Text and photos provided by Doug Morton
NASA’s Goddard Space Flight Center
NASA and USDA Forest Service scientists are collaborating on an ambitious project to inventory forest resources in the Tanana Valley of interior Alaska, a region the size of Iowa. The pilot project, funded by the USDA Forest Service Pacific Northwest (PNW) Research Station and NASA’s Carbon Monitoring System (CMS), combines forest inventory plots and airborne remote sensing data from NASA Goddard’s Lidar, Hyperspectral, and Thermal Airborne Imager (G-LiHT). The remote forests of interior Alaska have never been included in national inventories of U.S. forest resources based on the costs and complexity of acquiring field data in remote and difficult terrain.
The partnership between NASA and the Forest Service leverages unique capabilities for airborne remote sensing and ground surveys of forest structure and composition. For NASA, key research questions include the spatial distribution of forest carbon stocks, disturbance and recovery from fire, and data fusion—including the opportunity to characterize forest composition using a combination of lidar, hyperspectral, and thermal data from G-LiHT. G-LiHT data collections will also benchmark conditions across the Tanana Valley, an important part of the research domain for NASA’s Arctic and Boreal Vulnerability Experiment (ABoVE). For the Forest Service, the project will test the tradeoffs between a traditional ground-based surveys of forest resources and a hybrid approach to combine a limited ground sample with extensive coverage using G-LiHT airborne lidar and image data. Both NASA and the Forest Service are interested to track changes in forest cover and composition from wildfires and warming climate in coming decades.
As of July 14, the G-LiHT team had completed 40 percent of the planned flight lines across the Tanana region, totaling 3 TB of raw data and more than 2 billion laser shots fired. The flight crew is currently based out of Tok and Fairbanks, Alaska.
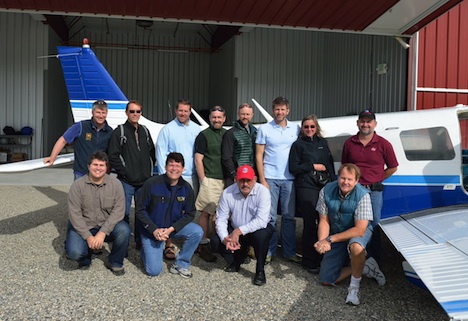
On July 14, 2014, NASA and USFS collaborators in Fairbanks, Alaska, prepare for G-LiHT flights. Top row: Hans Andersen (USFS PI), Tom Wirth (EPA), Grant Domke (USFS), Hobie Perry (USFS), Chris Woodall (USFS), Doug Morton (NASA), Gretchen Nicholas (USFS), Larry Corp (NASA/Sigma Space). Bottom: Matt Fagan (NASA/ORAU), Bruce Cook (NASA), Greg Reams (USFS), Ross Nelson (NASA)
From early July through mid-August 2014, scientist Doug Morton of NASA’s Goddard Space Flight Center in Greenbelt, Maryland, will be flying low over the treetops of interior Alaska. The purpose? First-of-a-kind look at the state’s forests with a portable, airborne imaging system called G-LiHT to map the composition, structure and function of the ecosystem.
According to Morton, key components of the fieldwork include:
“First, we are partnering with the U.S. Forest Service, as directed by the recently-passed Farm Bill, to incorporate remote sensing technology into forest monitoring efforts. Our pilot study will be the first inventory of forests in interior Alaska; a standard ground inventory (as in the lower 48) has always been too costly or logistically challenging to implement.
Second, we will study post-fire recovery, with plans to sample more than 80 percent of all fires in the Tanana region since 1950. Fire is the major agent of change in interior Alaska, and understanding the patterns of forest recovery is essential to gauge the vulnerability/resilience of forests to future climate change.
Third, we will benchmark conditions (topography/permafrost, forest cover, forest composition) across a large portion of the Arctic-Boreal Vulnerability Experiment (ABoVE) science domain.”
Follow Morton through the summer as, Internet connection permitting, he sends updates and photos from the field.