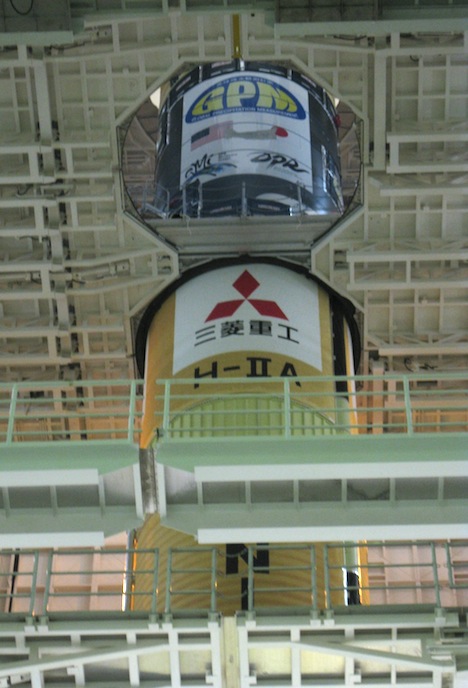
The H-IIA rocket that will carry the GPM Core Observatory into space. Here you can see the orange first stage and the silver second stage with the GPM logo on it. Jan. 20, Tanegashima Space Center. Credit: Mitsubishi Heavy Industries
The H-IIA No. 23 rocket that will carry the GPM Core Observatory into space arrived at Tanegashima Space Center on Jan. 20, 2014. The rocket has two stages, a lower first stage that, with the help of two solid rocket boosters, gets it off the ground, and an upper second stage that lights up a few minutes after launch to boost the satellite the rest of the way into orbit. The launch services provider, Mitsubishi Heavy Industries (MHI), immediately began assembling the rocket. On Jan. 22, the GPM team in Tanegashima was invited to participate in a blessing ceremony for the rocket. Lynette Marbley, the Instruments Chief Safety and Mission Assurance Officer for GPM, represented the NASA team.
She wrote to me about her experience. Her responses have been lightly edited for clarity.
Where did the ceremony take place?
The ceremony took place in the Vertical Assembly Building (VAB) at the foot of the rocket as it sits in the platform.
What did the space that the ceremony took place in look like?
I was amazed to see that they had already placed the upper stage onto the lower stage considering it had been less than 48 hours since its arrival. As I looked up to try and see the top of the rocket, I could see the large GPM logo on the upper stage. It was wonderful to see that logo! The work platform that surrounded the rocket was maybe 15 floors tall. I couldn’t see the top of the rocket. The space where we had the ceremony reminded me of the Goddard High Bay in the Building 29/7 complex, except it was taller.
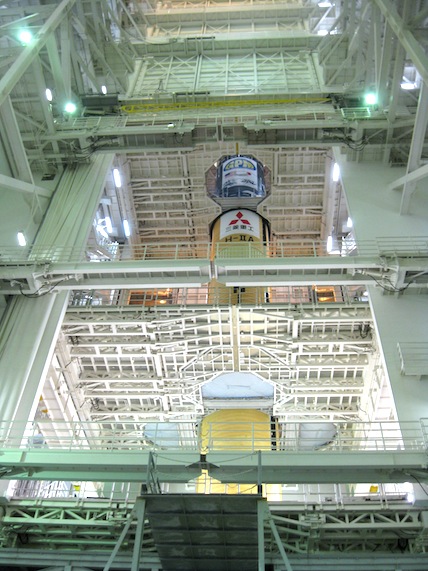
To give you a sense of size, the rocket is about 15 stories tall. Jan 20. Credit: Mitsubishi Heavy Industries
What happened during the ceremony?
When we arrived, a wooden altar was in place in front of the rocket, and two potted trees were on either side of the altar. There were fruits and vegetables already on the altar and some shrubbery with paper tied to it. Next to the altar was a table that had several large bottles of what I believe is the local potato wine called sochu, a large tree branch with paper tied to it, and several smaller branches.
Two rows of chairs were set up several feet in front of the altar with open space behind them. Every company that has a role in this launch had two representatives sit in the chairs. I had an MHI employee sitting behind me to help me through the ceremony. The remaining GPM team members were lined up behind the chairs. I had two lines of GPM folks standing behind me, about 25-30 people per line and by far the biggest group amongst all the companies. JAXA, MHI, NASA, KHI (Kawasaki Heavy Industries), and IHI Aerospace were represented.
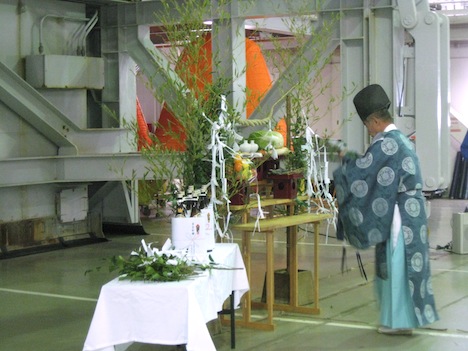
The Shinto shrine set up at the base of the rocket and the kannushi, or priest, who led the ceremony. Jan 20, 2014. Credit: Mitsubishi Heavy Industries
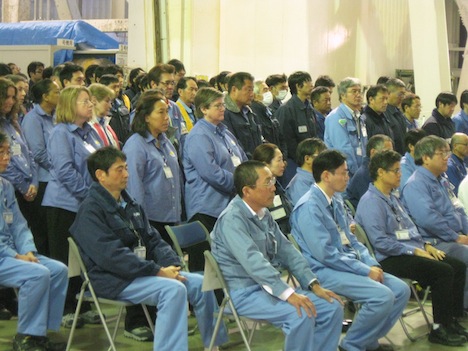
GPM team members lined up behind Lynette, seated in the front row, third from the left. Jan 20, 2014. Credit: Mitsubishi Heavy Industries
The Shinto priest was busy preparing for the ceremony and donned his robes to start. As we all took our places in the chairs, we started out standing. The announcer spoke only Japanese and made some opening remarks. The priest was introduced, and the company representatives all had to bow in unison at the start of the ceremony.
The ceremony was broken into several sections with the Shinto priest doing a lot of chanting approaching the altar, bowing, and shaking the large branch in front of the altar and over his shoulders. The room was very quiet. We mostly stood and bowed during certain segments and at other times we sat. His voice was very deep and had a vibrating sound. At one point, he read from a script and I heard the words “GPM” and “rocket” several times. He also mentioned every company in the prayer.
I understand you had an active role — what did you get to do?
[I participated in] the Tamagushi-houten portion of the ceremony.

Excerpt from the information packet given to the team before the ceremony. The Tamagushi-houten midway through the ceremony. First the priest cleansed the attendees of evils and invited the god to the alter where he made a sacrifice of food. Then he prayed for the safety of the launch campaign and mission success. Next he blessed the facilities. Then it was time for the Tamagushi-houten when the attendees offer their pure spirits to the god. Finally, the priest withdraws the sacrifice of food and send off the god, and all present bow. Jan 20, 2014. Source: Info provided by MHI
I practiced for several days, and I even looked it up on YouTube to see if I could get a better visual of what to do, which was helpful. I basically took the offering branch from the priest in a specific way and placed it on the altar. After placing it on the alter, I and all NASA team members had to bow twice, clap twice, and bow one more time. I then proceeded back to my seat.
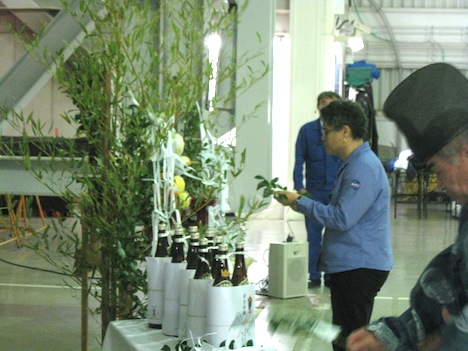
Lynette Marbley placing the offering of Sakaki-tree sprigs on the alter during the blessing ceremony. Jan 20. Credit: Mitsubishi Heavy Indutries
What was the mood like?
It was very quiet and very serious and somber. Everyone was careful not to make a sound. As I looked at other representatives, they were very focused and intense. We all stood at attention with very little movement.
Did you like the ceremony?
I was very nervous but was happy to have had the opportunity to represent NASA. I wanted to make sure I had given the offering properly. Everyone felt I had done a great job, and I have never felt so proud to represent NASA and my country.
In the end, I guess it was fitting that the Safety and Mission Assurance Officer be the one to represent NASA in a ceremony praying for the Safety of the Launch Campaign and Mission Success!
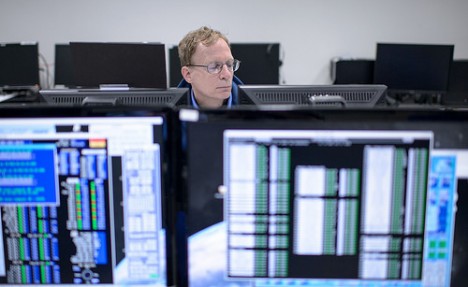
NASA GPM Radio Frequency Engineer David Lassiter monitors the progress of an all-day launch simulation for the Global Precipitation Measurement (GPM) Core Observatory at the Spacecraft Test and Assembly Building 2 (STA2), Saturday, Feb. 22, 2014, Tanegashima Space Center (TNSC), Tanegashima Island, Japan. Photo Credit: (NASA/Bill Ingalls)
When a satellite gets to space, the first thing it needs to do is check in with those who sent it there. NASA’s David Lassiter is the guy on the other end of the line. “My job is just to make sure E.T. can call,” he said. Responsible for radio frequency communications– RF comms–he’ll be on console the night Global Precipitation Measurement mission’s Core Observatory heads for space.
David is just one part of a large international cast, ready to push open the curtains on something that’s been in production a long time. The running crew has cleared the wings. House managers have checked the doors. On headsets all stations check in, voices clear, sharp, and spare. It’s dress rehearsal, and the combined cast and crew from NASA, the Japan Aerospace Exploration Agency, and Mitsubishi lean into their parts as if it were opening night.
Soon. Very soon.
Years of planning, of logistics, of language training and technical coaching and set design, have led this elite corps to the performance precipice. The saying goes that a bad dress rehearsal promises a good opening night, but in this case, nobody in the bifurcated casts spread between Tanegashima, Japan and Goddard Space Flight Center in Greenbelt, Maryland will accept anything less than perfection in the run-thru.
The big show’s opening night is also it’s closing night. This will be a command performance, a one-time-only show of epic proportions attended by senior staff from two proud space-faring agencies. But like all command performances, leaders may have privileged seats but it’s the vast throng of commoners who’s interest make events memorable. Those groundlings are all of us. For a mission focused on global rainfall, the GPM launch is a show for all the people of Earth.
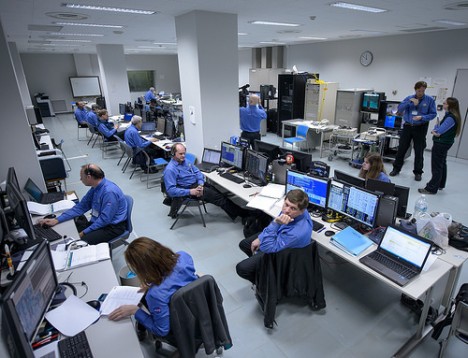
The NASA Global Precipitation Measurement (GPM) Core Observatory team is seen during an all-day launch simulation for GPM at the Spacecraft Test and Assembly Building 2 (STA2), Saturday, Feb. 22, 2014, Tanegashima Space Center (TNSC), Tanegashima Island, Japan. Photo Credit: (NASA/Bill Ingalls)
In the control room there’s commotion of a sort, but far, far from the white knuckle derring-do of Hollywood rocket launches. In this rehearsal everyone has their lines down cold, and the consensus is that everyone is hitting their marks on time, on cue. To the non-technical observer there’s a refreshing cool among the corps that instills confidence. Come launch time that confidence and cool will be essential. All participants will have to be on console at launch-minus-10 hours, keeping an eye on every single thing that happens before lift-off. At 30 minutes before launch until 30 minutes after, nobody will enter or leave the control room for any reason whatsoever.
Tim Gruner speaks into a headset, a direct line of communications with the Mission Operations Center at Goddard in Maryland. His voice, along with streams of computer data, flies around the planet to keep all parties on track. It’s nighttime in Maryland during the rehearsal, but during the big show, day and night will be reversed.
Andy Alyward and John Schater have the unusual task of actually standing by at the launch pad. Ostensibly responsible for powering up the GPM Observatory before launch, they’re only on site in case of a problem with the automated computer scripts. At launch-minus-10 hours, they’ll confirm good power, and then high-tail it from the launch site for the safety of control room several miles away. Their oversight is critical because at launch time several systems need to be powered up, including command and data handling, communications receivers, and heaters. Batteries will keep the satellite operational until solar panels unfurl, it tips toward the sun, and starts making its own electricity.
The real action is back at Goddard’s Mission Operations Center and the launch control room located elsewhere at the Tanegashima Space Center. Here in the satellite control room, the group of specialists carefully watching their monitors are largely keeping tabs on their satellite, waiting atop a sleeping Mitsubishi H-IIA heavy lift rocket. Like they say in theater, there’s no such thing as an unimportant role no matter how small. The team here may not be those launching the rocket, but their payload is the big reason this rocket launch matters so very much.
In conversations with the team afterward, the prevailing sentiment is not one of anticipation, but of impending completion. Sure, there’s plenty of excitement, but the NASA team has been in Japan for a long, long time, and home sings its eternally wistful song. There’s nothing like a successful rocket launch to remind you that you just saw a big job through to it’s completion. With this solid rehearsal under their belts, the team is ready to let that moment of completion fly.
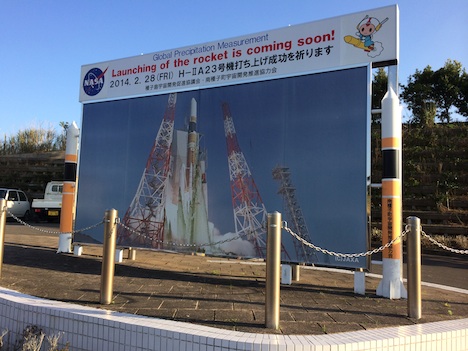
Welcome to Minamitane, Japan. A billboard announcing GPM’s launch on Feb. 28 th (27th in the U.S.) at the nearby Tanegashima Space Center greets visitors as they come into town. Credit: NASA / Ellen Gray
At the town line into Minamitane on Tanegashima Island, Japan, a giant billboard announces, “Global Precipitation Measurement / Launching of the rocket is coming soon!”
Six days to be exact.
I grinned when I saw it. Global Precipitation Measurement, or GPM, is why I’m in town. The launch window begins at 1:07 p.m. Feb. 27 (U.S. EST) / 3:07 a.m. Feb 28 (Japan ST).
I’m Ellen Gray, the science writer for the mission. Over the coming week before launch, video producer Michael Starobin and I will be reporting from the launch site as the GPM team in Japan works with NASA’s mission partners, the Japan Aerospace Exploration Agency (JAXA) and Mitsubishi Heavy Industries, on the final preparations before liftoff.
“Global Precipitation Measurement” is a mouthful, but an accurate one. The mission is going to measure all types of precipitation — rain, snow, hail, and that slushy winter mix — across nearly the whole globe, every three hours. When people hear me say that, the question I get is how is one satellite going to do all that? The short answer is that one satellite can’t do it by itself.
The overarching GPM mission consists of more than one satellite. The big picture of global rainfall comes from the combined observations of many rain and weather satellites operated by different countries or agencies. Each satellite has a similar instrument that measures precipitation, and all that data combined is what gives you the global picture.
The GPM Core Observatory — the satellite launching next Thursday — is going to pull all the measurements from the different satellites together into a single data set. Observations from its radiometer will act as the standard to unify all the other satellite measurements. The Core Observatory’s second instrument is a radar, and together with the radiometer, scientists won’t just be seeing where it’s raining, they’ll be able to study how raindrops and ice particles behave within clouds, and ultimately Earth’s water cycle, in detail they couldn’t before. And it’s the first precipitation mission designed to send back measurements of light rain and snow, two of the trickiest types of precipitation to measure from space.
[youtube RlFFpzfXwYc]
Stay tuned for a busy week from Tanegashima. You can find the latest mission updates, stories and videos at http://www.nasa.gov/gpm. For photos, Bill Ingalls (@nasahqphoto) will be posting daily to the GPM Mission Set at NASA HQ Flickr. You can also follow the mission on twitter @NASA_Rain and on Facebook. For more in depth information on the GPM mission, Earth Matters put together a nice primer of videos and links. And, of course, we’ll be blogging right here under GPM in Japan, the Road to Launch.
Live coverage of launch will begin at 12:00 p.m. Feb 27 (EST) on NASA TV and online at: http://www.nasa.gov/ntv
Editor’s Note: This guest post was written by David Wolfe, a remote sensing specialist working with the Global Land Ice Measurements from Space (GLIMS) project, and Jeffrey Kargel, a professor at the University of Arizona and the GLIMS project coordinator. Wolfe wrote his thesis for Alaska Pacific University about glacier-dammed lakes in Alaska and recently authored a book chapter on the same topic. Gregory Leonard, Michael Abrams, and Adam Voiland also contributed information for this post.
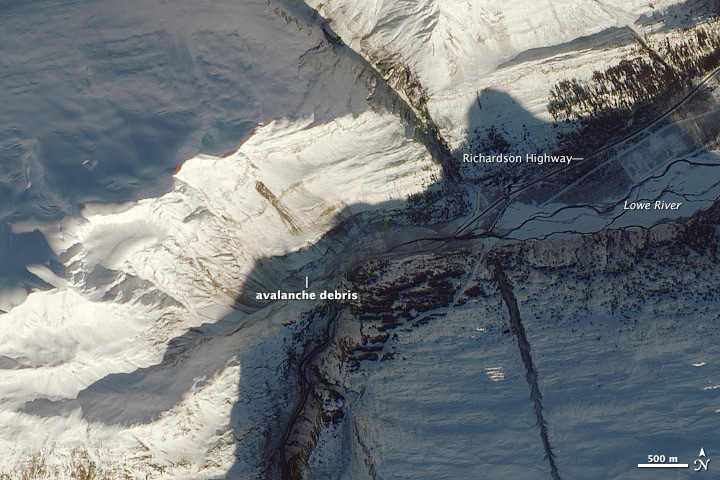
The Advanced Land Imager (ALI) on the Earth Observing-1 satellite captured this scene of an avalanche in Keystone Canyon on January 31, 2014. Notice how debris has obscured sections of both the Richardson Highway and the Lowe River. Image by NASA Earth Observatory.
On January 24, 2014, an exceptionally large avalanche closed the Richardson Highway (Alaska Route 4), the only land link between the ice-free oil port of Valdez and the rest of Alaska. The avalanche was classified as a size 5, the largest category, though no one was hurt. The avalanche impounded the Lowe River, forming a lake. The lake drained within days of its formation, without an outburst flood, due in part to a 100 year-old abandoned railroad tunnel that shunted water around the dam. On February 5, 2014, officials reopen the road.
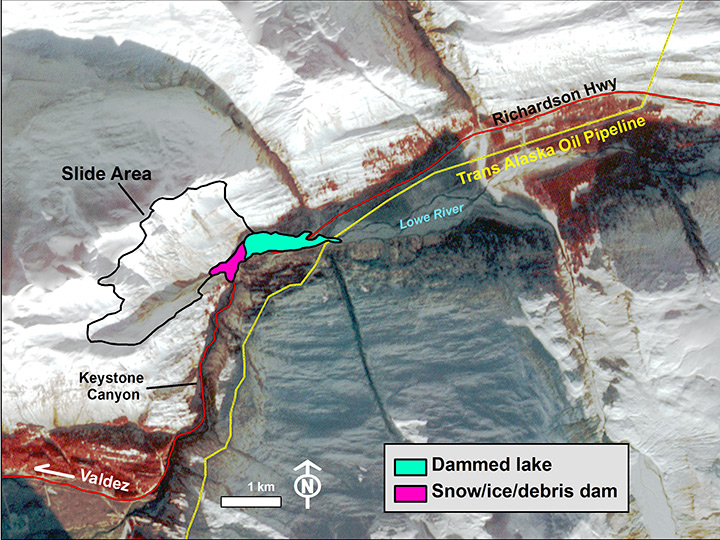
The Advanced Spaceborne Thermal Emission and Reflection Radiometer (ASTER) obtained the image below, on January 29, 2014, upon request by the Global Land Ice Measurements from Space (GLIMS) consortium. The image is an oblique rendering of part of the ASTER image draped over the GDEM2, a global topographic shaded relief map that was produced from a dozen years worth of ASTER images. It is a standard false-color image taken in visible and near infrared wavelengths. Vegetation appears red; snow is white. If clean, water appears black; if slightly sediment laden, it is blue.
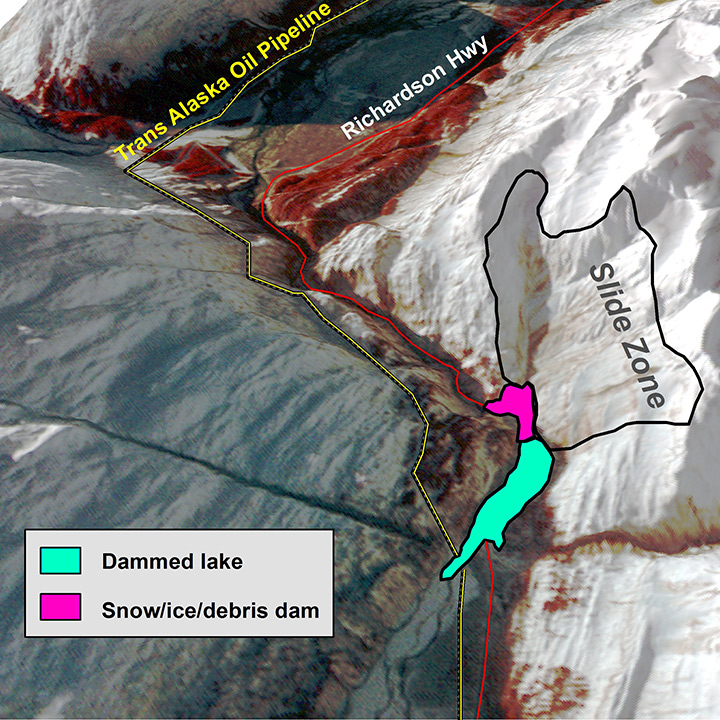
Perspective rendering of an ASTER image on a shaded relief map, showing the location of the avalanche and impoundment lake relative to a portion of the Trans-Alaska Pipeline System and Richardson Highway. The image was acquired on January 29, 2014. Image by Gregory Leonard and Michael Abrams.
The ASTER image above shows the outlines of the avalanche source, the avalanche deposit, the maximum extent of the impoundment lake, and the routes of the Richardson Highway and the Trans Alaska Pipeline System (TAPS). The lake had partially drained when the image was acquired. At maximum extent, the lake apparently barely overlapped part of the route of the pipeline, but in this sector the pipeline is buried and was thus safe. Although the greater potential pipeline disaster was averted, the closure of the highway has been a significant inconvenience for many people in and near Valdez. Ferries into and out of Valdez were increased to assist stranded residents, and roadway commerce as far as Fairbanks must have been affected by the disruptions to the Richardson Highway.
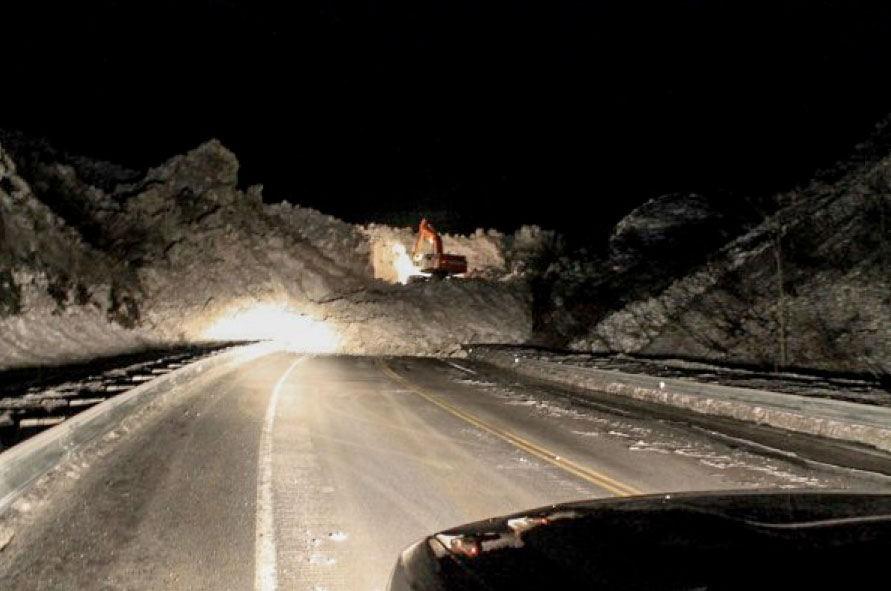
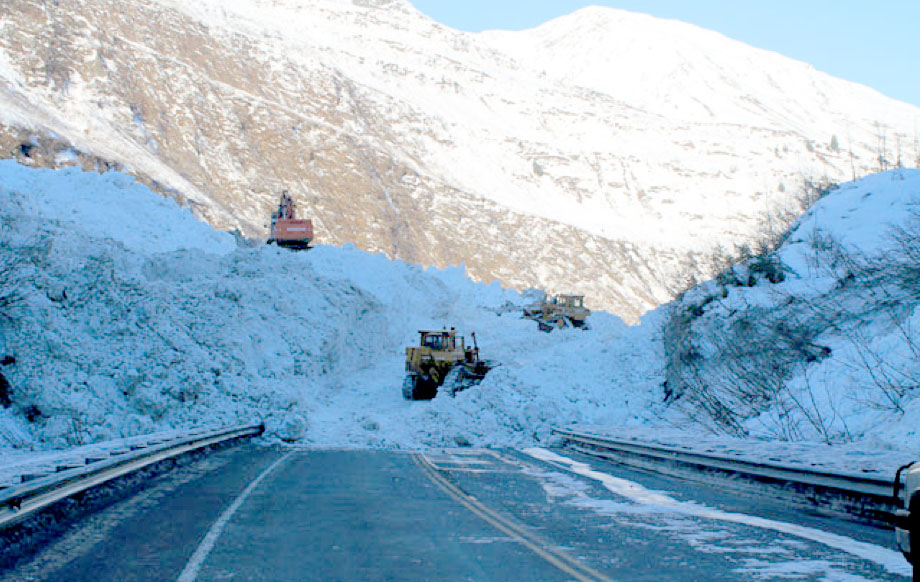
Crews from the Alaska Department of Transportation and Public Facilities (ADOT&PF) mobilized equipment on the south side of the road closure Thursday evening, January 30, 2014, and began 24-hour snow removal operations early Friday. The top photo shows a Hitachi 450 excavator, providing a scale that shows the avalanche to be 40 feet (12 meters) thick at this location. The next photo, just above, shows a daytime view of the night-and-day operations to reopen the highway. Elsewhere, reports have the avalanche approaching 100 feet (30 meters) thick. Photos courtesy of Robert Dunning and staff, Alaska DOT&PF, reproduced by permission.
The 1.35 square mile (3.5 square kilometer) source of the avalanche was estimated from the ASTER and ALI images and from news broadcast video taken from a helicopter by ADOT&PF, Alyeska Pipeline Service Co., the Anchorage Daily News, and Alaska Dispatch staff. The huge avalanche and 0.135 square mile (88-acre, 0.35 square kilometer) impoundment lake reminds us of the remarkable engineering of the Alaskan pipeline (below). The pipeline faces many natural hazards, including earthquakes, landslides, floods, forest fires, avalanches, glacier lake outburst floods, and thawing permafrost. In 2002, it survived the magnitude 7.9 Denali earthquake without rupture—though just barely. Several key design tolerances were closely approached or exceeded, according to a report published in Earthquake Spectra. That earthquake and the 2014 avalanche did not cause a disaster because of the pipeline’s careful engineering, including the use of many novel technologies and special routing. Just about 1.9 miles (3 kilometers) upstream of the Lowe River crossing, the highway and pipeline traverses a creek that has been inundated by periodic outburst floods, some destructive, from a series of glacier-dammed lakes high in the mountains. TAPS was routed underground through the flood impact zone and over the Chugach Mountains. The specific routing averted the extent of the avalanche and lake with no room to spare, suggesting an element of good luck.
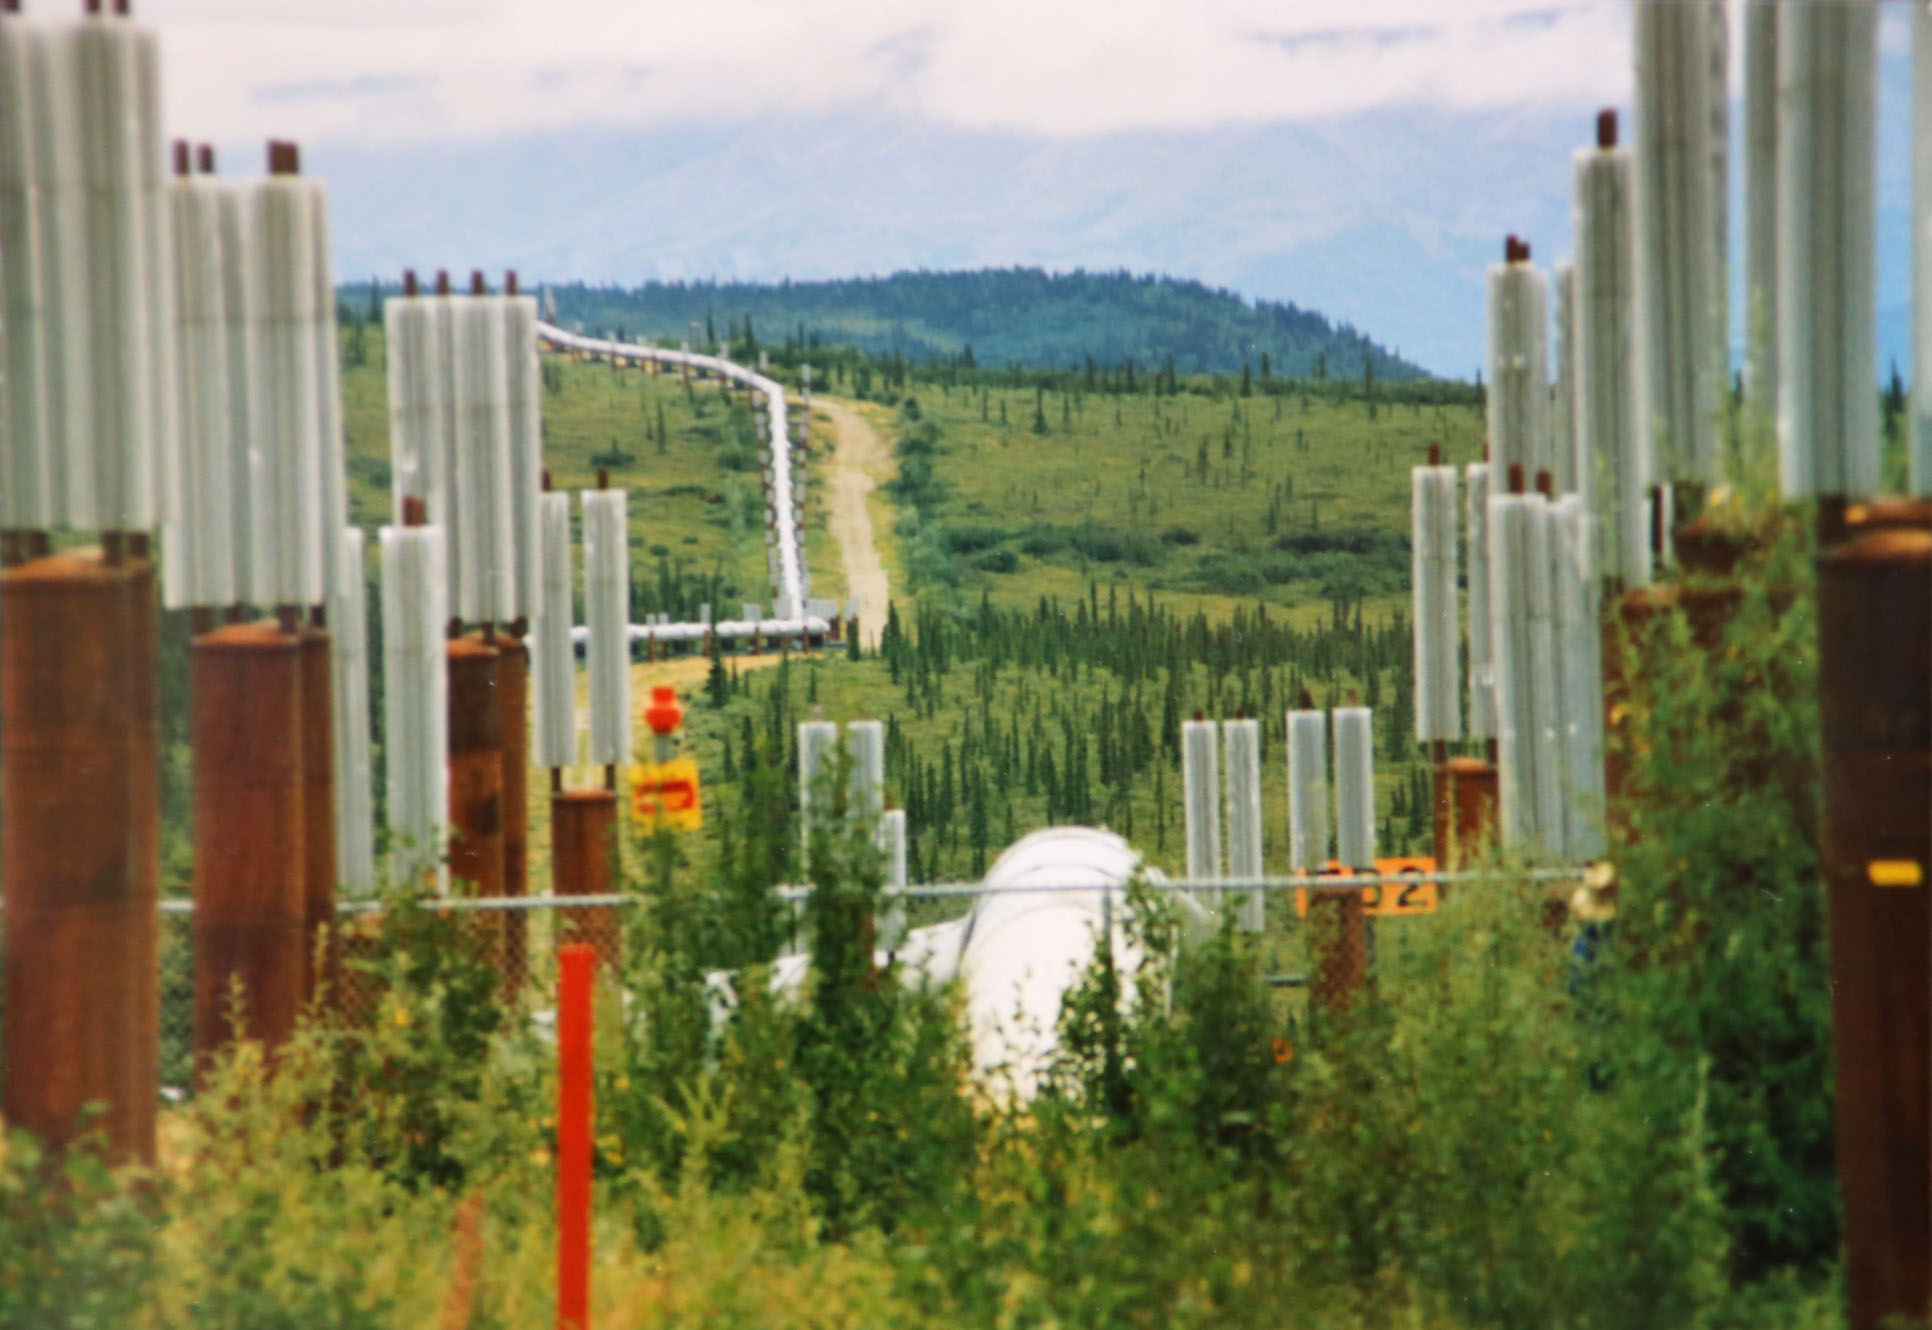
Figure 4. TAPS south of the Alaska Range, highlighting several innovative design features of the TAPS, including the burial of the pipeline in some sectors (such as here, where the pipeline goes underground), the elevation of the pipeline in other sectors, passive ammonia cooling system to maintain the frozen permafrost, and the zig-zag pattern designed to absorb earthquake-caused deformation. Photo courtesy of Jeffrey Kargel.
A larger view of the full ASTER image acquisition is shown. Note the presence of unfrozen sediment-laden glacier meltwater of the glacial lake (cyan) north of the oil port and east of the city of Valdez. The unfrozen state of the lake in mid-winter is a testament to the unusually warm January in Alaska.
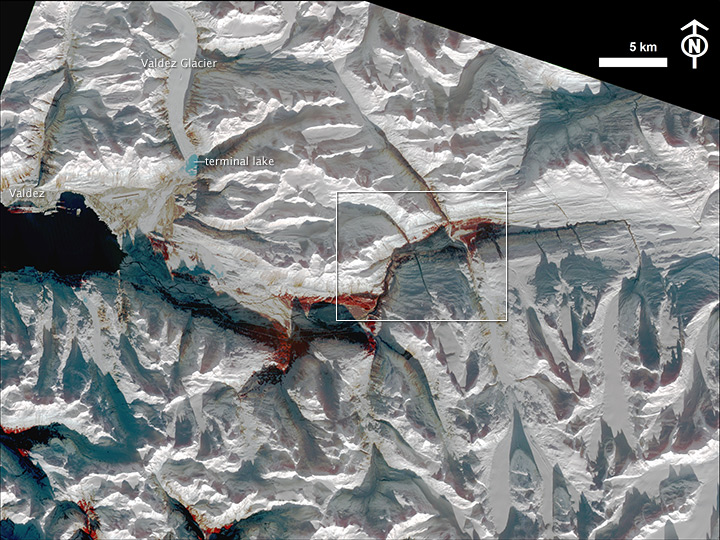
The upper image is an ASTER RGB false-color composite image draped onto the GDEM2 shaded relief map that shows the broader area. The town of Valdez is visible along the eastern arm of the Valdez Arm. Valdez Glacier, with its terminal lake (cyan), is visible northeast of the city. The lower image is an inset that shows the site of the avalanche in more detail.
This winter has been extremely mild in Alaska, enough for the record books, and the weather data point to the likely trigger of the avalanche. National Oceanic and Atmospheric Administration (NOAA) records indicate the January 2014 snowpack for the Valdez recording station was far below normal, while the amount of precipitation (rain or snow-water equivalent) received was more than double the January normal since 1972. The huge avalanche was conditioned by three consecutive days of record high or record high minimum temperatures and then triggered by days of record anomalous rainfall.
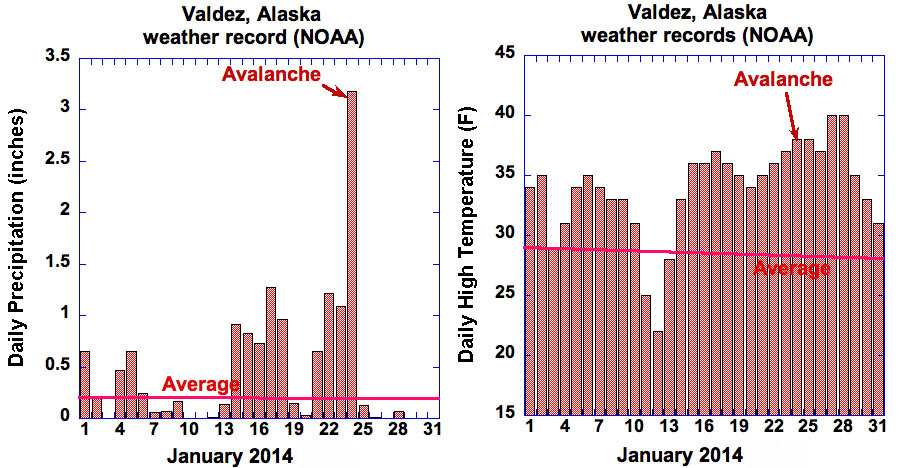
January 2014 temperature records for the Valdez recording station. The almost horizontal lines are the averages for those dates (“normals”) over the period 1972-2014. January 2014 was twice as wet as normal, and about 6°F (3.3 °C) warmer than normal, but the day of the disaster and three preceding days broke multiple weather records in several parameters. Daily low temperatures (not shown) were also exceptional, with no freezing conditions in Valdez for the three nights prior to the avalanche, whereas normal lows are about 19 degrees for those dates.
A sequence of exceptional weather anomalies extend back to October. That conditioning set the stage for the rainfall trigger to release the huge avalanche. The warm weather across most of Alaska—including an Arctic January in Kotzebue that experienced winter temperatures more typical of those in Portland, Oregon, is the other side of the coin that dealt the U.S. East, Midwest, and South a severe deep freeze. Such extreme oscillations of weather are related to a deeply dipping jet stream and establishment of a days-long flow of saturated tropical air into the Valdez area. These conditions, particularly the strong meridional flow of air masses and “stuck” jet streams that resulted in prolonged extreme weather patterns, are thought to be increasing in frequency due to global warming, according to climate modeling by Jennifer Francis (Rutgers University) and colleagues. The Arctic is warming more rapidly than the Tropics, which may be forcing changes in global circulation and weather patterns.
However, decadal variability caused by atmospheric and oceanographic “teleconnections” to the rest of the planet (El Niño/La Niña being the most famous example, and the Pacific Decadal Oscillation being the one most relevant to southern Alaska) are always causing climatic oscillations and sometimes extreme weather, so we cannot yet point definitively to climate change, as opposed to these oscillations, as the underlying cause of this event. These climatic oscillations affect everything from the salmon fisheries to snowfall and rain patterns, so climatologists will have to look deeply at global warming, disappearing sea ice in the Arctic, and climate oscillations to find the ultimate answer to why Alaska’s weather has been so weird (and indirectly, why this mega-avalanche occurred), and how that relates to what is happening around the globe.

GOES-15 satellite image at 6.5 microns (a region of the thermal infrared that is absorbed by water vapor), portrayed as the temperature at the top of the water-vapor emitting region (clouds or humid air). Reds and yellows portray a very dry atmosphere, where emission of thermal infrared arises very deep in the atmosphere at high temperatures. Blues indicate a moister atmosphere, and white and green an extremely moist atmosphere extending to very high altitudes having very low temperatures. The image was acquired 3:00 PM (local Alaska Time Zone) on January 23, 2014, the afternoon before the giant avalanche. A stream of extremely moist air arising in the northern Tropics—sometimes called the Pineapple Express—had been slamming into the Valdez and Keystone Canyon area (red square) for several days, thoroughly soaking the area. Valdez received over 11 inches of rain in the 12 days preceding the avalanche. Image rendered and made available by the Cooperative Institute for Meteorological Satellite Studies (CIMSS), University of Wisconsin – Madison, USA.
The avalanche in Alaska cannot be blamed squarely on climate change, but it is another reminder that as climate changes, extreme weather may also be changing, and this impacts the well-being of people and critical infrastructure. Climate change and effects on natural hazards and disasters represents a moving target that must be re-examined by those planning the future, whether it is construction of major infrastructure or planning for disaster recovery. Climate change is not just a matter for the distant future, but it is ongoing now.
We thank the NASA Cryosphere Program, which funds our glacier and cryosphere related research, and the U.S.-Japan ASTER project, which provided the ASTER imagery.
Editor’s Note: Jeffrey Kargel is a hydrologist at the University of Arizona and for the Global Land Ice Measurements from Space project. This is his account of the research he did during the aftermath of a deadly flash flood in Nepal’s Seti River Valley to determine its cause. You can read more about the event here.

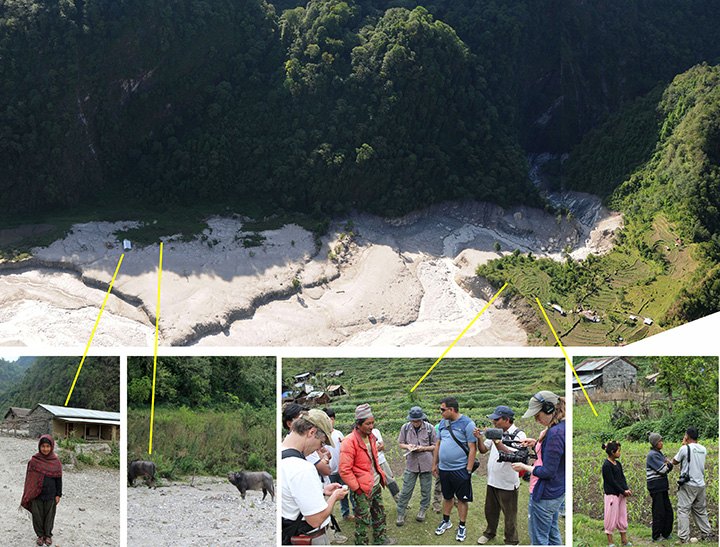
Silt and gravel deposits trace the path of the 2012 hyperconcentrated slurry flood, which ravaged Kharapani village, shown here. Annotations show where people died and where they survived. Our research group has undertaken a detailed demographic and sociological investigation of the losses and survivors all along the devastated parts of the Seti River. The panel at lower right was a 1-year anniversary meet-and-greet commemoration, where we met survivors, media, and politicians still very much concerned about the disaster. (Photos courtesy of Jeffrey Kargel, University of Arizona.)
On May 5, 2012, I was attending a conference at ICIMOD (the Kathmandu-based International Centre for Integrated Mountain Development). I heard about the terrifying disaster that day. A flash flood—what geologists call a hyperconcentrated slurry because it was thick with suspended silt—had torn through some villages along the Seti River, in north-central Nepal, just north of the country’s second largest city, Pokhara. It was immediately recognized as a very deadly event, but the death toll—and a tally of those who remain missing but were clearly also killed—was not known exactly for several months. Seventy-two souls lost. Though not large on the scale of global disasters, this event was terrifying for the fact that it seemed to come from nowhere—literally from beneath a blue sky. Furthermore, there was no immediately evident cause. Nobody and no camera captured the whole event, but there were bits and pieces that had to be spliced together, and missing parts of the story had to be built from the ground up—literally from the rocks and sediment involved in the disaster.
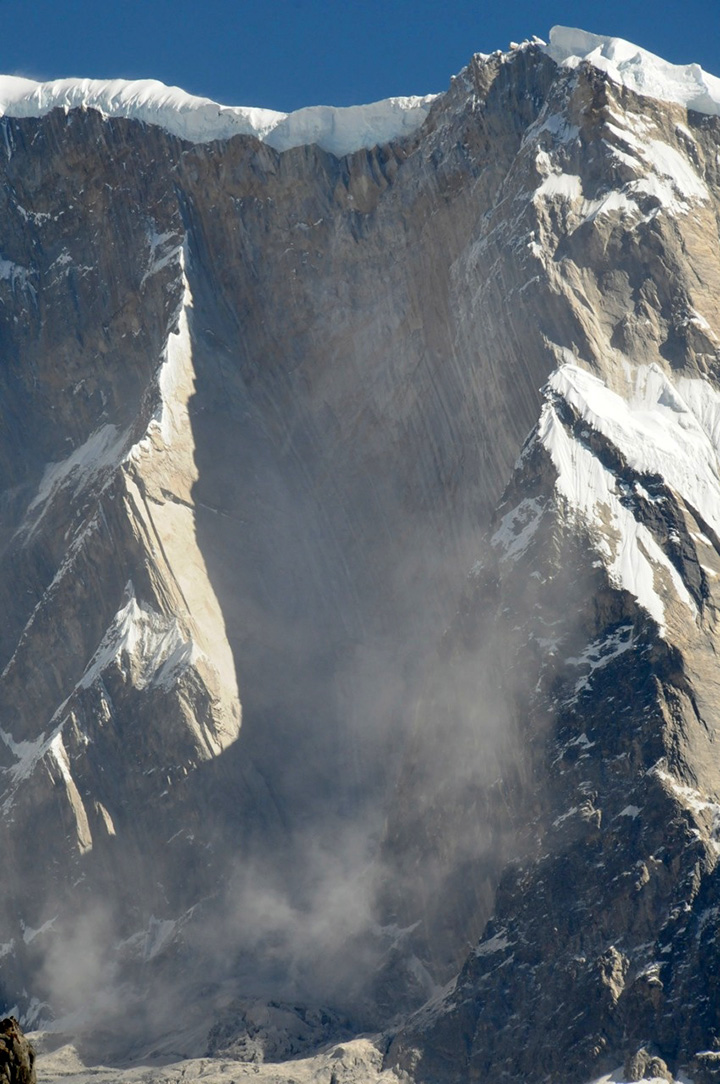
The source area for the avalanche of May 5, 2012. Annapurna IV is just off image to the upper left. The rocks here are layered metamorphosed sedimentary rocks deposited originally in the Tethys Sea before the Himalaya rose; the rock layers are now tilted up. Ice hangs precariously at the ridgeline, and apparently an icefall started the whole messy disaster. A dust cloud lingers from a small debris fall just moments after we first landed in Sabche Cirque 6 months after the disaster. (Photo courtesy of Jeffrey Kargel, University of Arizona.)
Seeing that the disaster occurred at the foot of the Annapurna Range, within the Greater Himalaya, probably every expert’s first thought was “glacial lake outburst flood” (GLOF), because these were common in Nepal’s Himalaya, and the news accounts of the disaster event resembled accounts of GLOFs from other parts of the country. It took me 10 minutes to examine recent satellite imagery enough to see that there were no lakes, at least not in the images I examined, that could have burst out like this. So either there was a hidden glacial lake somewhere—maybe under the glacier ice—or a glacial lake developed very rapidly and then drained that tragic day, or—far more probable—this was not a GLOF at all. It was, however, clearly a disaster that had its source in a high Himalayan amphitheatre-like bowl, a glacially-carved structure called the Sabche Cirque. This structure was rimmed by some of Nepal’s most famous, picturesque mountain peaks, including the storied, holy Machapuchare (the “fishtail” peak) and Annapurna IV, a 24,688-foot (7525 m) soaring metamorphic buttress of metamorphic rock.

View of the avalanche deposit of rock and ice shed from Annapurna IV, which is just beyond the upper right corner. (Photo courtesy of Jeffrey Kargel, University of Arizona.)
One of the most important pieces of information on the cause of the disaster was obtained from wingtip cameras mounted on a tiny 2-seater tourist plane. The pilot, Captain Maximov, had observed what was obviously a giant avalanche—bigger and browner than any snow avalanche he had ever seen before; he then he saw a massive flood wave pouring down the Seti River valley. It was evident immediately that this brown cloud of roiling airborne debris was connected to the trigger for the disastrous flood.
This distant view provided in the tourist plane’s video, in addition to later observations I was able to make from the Sabche Cirque itself, led to a confident sourcing of the brown cloud and the disaster’s trigger on a ridgeline near Annapurna IV. Apparently part this ridge—probably initially the glacier ice— collapsed, dropping ice and rock over 3000 m almost vertically (about 10,000 feet) onto unconsolidated rock debris (glacial moraines and ancient glacial lake silts and gravels) resting unstably in the deep bowl of the Sabche Cirque. Some of that loose debris was also swept up by the avalanche, and the mass flowed an additional 1,500 meters (about 5,000 feet) into the Seti River gorge.

Ancient glacial lake sediments such as these in the Sabche Cirque were swept up by the avalanche and ingested both into the ground surge and airborne cloud, then ingested into the reservoir, which then burst forth onto unsuspecting people below.(Photo courtesy of Jeffrey Kargel, University of Arizona.)
The triggering avalanche—though enormous and bigger than almost any normal avalanche—was the easy part of the explanation of the disaster. The hard part was identifying the source of the water, because there was no glacial lake or no known lake at all in the area. Somewhere a large amount of water had been stored and then suddenly released. Speculation centered on water contained within unseen and unknown caves, or within the deep gorge of the Seti River, and last of all, possible subglacial lakes or lots of little ponds that acted like one big lake. This flood appeared to behave like a glacier lake outburst flood, and the news media can be pardoned for having assumed that it was. From that first day, I and other experts tried to counter the media view that it was a GLOF, but anyway, it was a lot of floodwater.
Since I was in Nepal, I immediately contracted for a helicopter to fly me and some colleagues over the Sabche Cirque. We observed directly evidence of the avalanche—boulders and dust and snow-like pulverized ice in a huge sheet, and streamers of debris emanating from the base of Annapurna IV to the head of the enormous Seti River gorge. We helicoptered over the glaciers and found some small ponds, but nothing that could explain the volume of water; and besides, the ponds were in the wrong place to have been strongly affected by Annapurna IV’s ice/rock avalanche. The pathway of the avalanche became ever clearer after post-disaster Landsat and ASTER images showed clear details of the avalanche deposits.
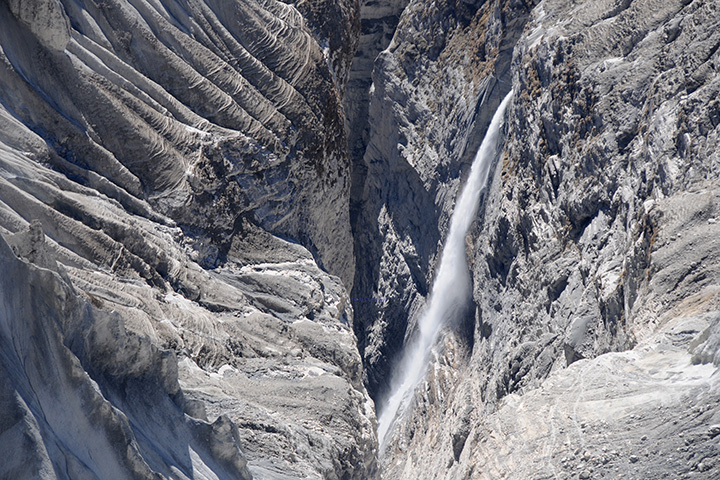
The avalanche route through the upper gorge. (Photo courtesy of Jeffrey Kargel, University of Arizona.)
Speculation was now focused toward the gorge. Could something have blocked it? Well corroborated resident eyewitnesses interviewed by our team indicated that one to three weeks prior to the disaster, the Seti River had slowed to a mere trickle of clean water, unlike the usual turbid, sediment-laden “glacial milk.” (Seti means white, so it is the White River.) These various observations and ideas had already started to coalesce when my assistant, Greg Leonard, observed a speck of change that had occurred in “before” and “after” ASTER satellite images. We had a specific spot to look for a rockfall into the gorge. Then looking at our helicopter-borne photography, we found it. It was indeed a fresh rockfall straight into the gorge, right at a place from which it appeared a backed-up reservoir had issued a flood. Furthermore, Greg showed that the gorge had experienced many smaller rockfalls or other erosional events over the previous decade, but this bigger one seemed to be fresh. The gorge now seemed the likeliest culprit, but at first it seemed difficult to comprehend how much water could be stored in the gorge behind a rockslide dam.
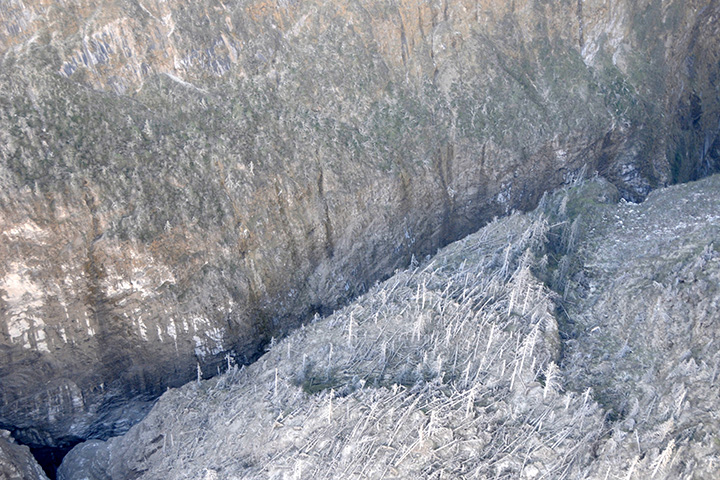
Flattened forest blown down by the avalanche winds. (Photo courtesy of Jeffrey Kargel, University of Arizona.)
In the days after the disaster, I examined amateur video of the event taken from Pokhara, a couple dozen kilometers downstream from the gorge. I watched as the flood reached Pokhara and as floating trees trunks poured over a dam. It provided the first best opportunity to measure the speed of the floodwaters and its depth and width, and thus measure the volume rate of flow and estimate the total flood volume. The flood came in waves, and the first wave alone was around a quarter of a million cubic meters in just a few minutes. There were about 27 waves in all over the next hours, according to eyewitnesses, so several million cubic meters overall.
At first it seemed a stretch for any one of the suggested water sources to explain the water volume, and this still is a part of the challenge to provide the full explanation of this event. Even my grandson, also intrigued as well as horrified by the disaster, brought his 7-year-old intellect to bear and suggested that it was friction that melted snow and ice that had tumbled off the peaks. Indeed, the conversion of gravitational potential energy to heat could have melted roughly a tenth of the falling snow and ice by the time it reached the Seti River. Nothing seemed quite sufficient; every potential source at first appeared an order of magnitude insufficient to explain the water volume. It seemed that all of the possible sources together might explain the floodwater volume. Yet one source seemed to be definitely involved, and that was a rockslide-dammed reservoir in the gorge.

A view of the gorges and also the distant peaks of the Sabche Cirque and the ancient glacial deposits in between. The avalanche entered the gorge from the upper right corner of the scene.
I returned with colleagues to the Sabche Cirque three more times, and we were able to land and set up camp and undertake detailed geological observations. The Sabche Cirque is a violent but beautiful place, with rockfalls, snow and ice avalanches, and flood dangers abounding, and evidence of big and recent geologic activity everywhere we walked or flew. We sampled and later chemically and mineralogically analyzed the dust fallout from Captain Maximov’s brown cloud, and linked it to the sediment deposited by the flood on the ravaged villages downstream. We analyzed the bedrock, the boulders of the avalanche, and searched for other evidence of floods and debris flows. That evidence is everywhere. However, the more we searched, the more it became evident that this was definitely not a GLOF, but was caused by a rockslide into the Seti River gorge, formation of an impoundment reservoir over a several week period due to damming of spring snow and ice melt, and then the final triggering event of the mighty rock and ice avalanche off Annapurna IV. On our most recent trip we used a laser device to determine the depth and width of the gorge and discovered that it is so immense that it alone might account for the required water volume.

Our first view of the rockslide that initially dammed the Seti River some weeks prior to May 5, 2012, and set the stage for the deadly terror. (Photo courtesy of Jeffrey Kargel, University of Arizona.)
Although this was a terrifying and deadly event, by geologic standards it was not particularly huge. The death toll was due foremost to people living in harm’s way on the lowest terrace and even on the lowest floodplain. Our findings do not bode well for the future of the small settlements scattered along the riverside, and there would seem to be a strong case for resettlement.
Another devastated area, where there were losses and survivors. A year after the disaster, we were surprised to see a woman living in a house that had barely escaped destruction. Her husband was a river worker. Cattle were grazing nearby. Survivors told harrowing and heart-breaking stories of their tragic losses. (Photos courtesy of Jeffrey Kargel, University of Arizona.)
ACKNOWLEDGMENTS. This sequence of events was pieced together from many data sources, and many people were involved, among them my colleagues and myself, but also Captain Maximov, local villagers, landslide blogger David Petley and his associates; research staff and my field assistants from ICIMOD, especially Sharad Joshi; my other Nepalese colleagues, including Dr. Dhananjay Regmi and Dr. Lalu Poudel; our chief climber, JB Rai and his Sherpa assistants; and two doctoral students, Khagendra Poudel and Bhabana Thapa, who are investigating the geomorphology and sociology of the disaster. I also need to give special thanks to my tireless assistant, Greg Leonard, who was the prime satellite image analyst as well as my chief field assistant. Finally, I express gratitude to the NASA/USAID SERVIR Applied Sciences Team, NASA’s Cryosphere Program, and the USAID Climber Science Program, who funded different aspects and phases of this work, and the U.S.-Japan ASTER project, which provided the ASTER imagery. This work will be presented in more complete detail within an upcoming peer-reviewed scientific publication.

A mosaic of images showing the rockslide area in the foreground in the glacial sediments and avalanche route in the background. (Photo courtesy of Jeffrey Kargel, University of Arizona.)
alert message

