
In the very beginning of this blog, I had promised to reveal why noise created by electric guitars pedals&s reminded me of the kind of science we faced during CARES. So, after the closing of the campaign, I want to keep that promise.
A microphone in front of an amplifier can generate an endless reverb, as much as getting a haircut in a shop with mirrors both in front and behind you can echo the image of your face. Very embarrassing if you don’t like the haircut. Or your own face.
The outcome of a feedback process is difficult to predict, because it is the result of a self-amplifying effect.
It is a non-linear process, meaning that it is not simply proportional to the change brought to a system. All in all, it is a logic less predictable than the simple causality of “one thing leads to another”, because in this case the “another thing” ends up in turn influencing the “one thing”. You can see an example in the figure below, to get a glint of how intertwined the dependences can be. And this is most certainly not all of it.

Some of these effects are positive and some are negative. “Positive” and “negative” here mean “increasing” or “decreasing” and not “good” or “bad”. In this sense, positive feedback enhances the direct effect (warming in the case of climate), and negative feedback offsets it. A classic example of positive feedback: water vapor concentration increases under warmer climate, and more water vapor generates more warming, leading to more water vapor, and so on and so forth. Repercussions can be so intense that, past a tipping point, they may can cause a runaway feedback effect spinning beyond our prediction (and possibly mitigation) capabilities.
Without all the complications aerosols entail, we haven’t mentioned their “indirect effects”, like that on clouds (follow the link for very illustrative clips!). Humidity in the air spontaneously condenses to form clouds, but it would rather condense around solid grains if it finds them around, and aerosols can very effectively act as “cloud condensation nuclei” therefore helping clouds to form. Interestingly, the clouds they help to form are whiter and with smaller droplets.
Any effect on climate? You bet! Clouds are like gigantic mirrors for Sun beams and just imagine the repercussions of even a tiny variation on cloud cover. Even determining the concentration of cloud droplets, as simple a challenge as it might sound, is driving scientists crazy.
Our knowledge of how aerosols respond to climate change is certainly better than in 1985, when the figure above was published on the Bulletin of the American Meteorological Society, but is still limited. For example, aerosol perturbations to cloud microphysics may involve feedbacks; after all smaller droplets should collide less often. Less coalescence prevents the growth of droplets, therefore suppressing precipitation, and making a cloud live longer and exert an even stronger cooling effect. Where’s the end of the loop? Any suggestion?
We appreciate your feedback. Even if it rips our eardrums apart.

It is 6:30 AM and you are waiting for the morning weather briefing to start, in which the meteorological conditions for the next few days are laid out and the science teams go over their flight plans for the day. You were up late last night putting the final touches on the flight plan for today’s science flight, making sure that you hit as many science objectives as you could. “I included several coordinated flight legs with the G-1 aircraft,” you think, “and I verified that the Terra satellite path takes it nicely across the pollution plumes near San Francisco and San Jose, giving us good data to verify the satellite results.”
But looking at the weather forecasts that were updated just before you woke up this morning has you worried. Will that predicted layer of ocean stratus blanketing San Francisco burn off in time to allow your instruments an unobstructed view of the aerosols below? What about those high cirrus clouds predicted to be hugging the mountains right above your G-1 coordinated leg? Will they limit the usefulness of your data?
Looking out the window, conditions look good here at the airport, but who knows what they will be like in 3 hours when your aircraft is getting ready to lift off. You could cancel the flight based on current predictions, but you run the risk of missing the science objectives that you are here for. Or, you could go forward with the flight and your science objectives may never materialize, leaving you with less useful data and fewer funds to use on potentially better flights.

As you ponder all of this, you find out that shifting wind patterns favor a different flight pattern for the G-1 and its instruments. If you are going to coordinate with them, you will need to quickly change your flight plan to something very different, but you need to minimize the number of changes you make. After all, your plan has to be checked by the pilots and submitted to Air Traffic Control at least 2 hours before a flight. The clock is ticking.
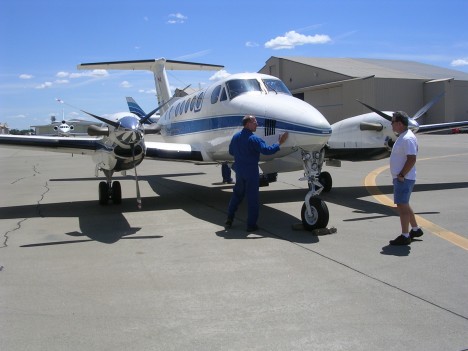
This is a day in the life of a flight planner. Planning a flight involves balancing all of these factors, changing and unpredictable weather and aerosol conditions, sometimes fickle aircraft and instrument systems, crew rest time, and competing science interests, to obtain the best set of measurements possible for future study. Flight planners have to have detailed knowledge of the discipline of atmospheric science, so that they can weigh the science objectives against each other and determine what produces the most results for the taxpayer dollars, which is why the flight planners here (Rahul Zaveri and Beat Schmid for the DOE G-1, Chris Hostetler and Rich Ferrare for the NASA B-200) have so many years of research experience behind them.

Even with years of experience, though, flight planning is more of an art than a science, and you have to learn to get a “gut feeling” sometimes about the right path to choose. Fortunately, we have many successful days and on the rare days that we do not achieve science objectives for that day, the data are usually useful for some other purpose (such as cloud studies, for example).
Usually once or twice during a month-long campaign, in the midst of unpredictable weather patterns, erratic pollution conditions, and instrument operation and aircraft timing issues, we will achieve a “golden day” where all of the conditions and aircraft timing are nearly perfect. Those are the days that are then studied for years to come. You never know when these days will come, but you know they will, so whether you fly on any given day or have to cancel for any myriad of reasons, you have to move forward after the decision is made. Speaking of which, it is time to start putting together tomorrow’s flight plan!
– Mike
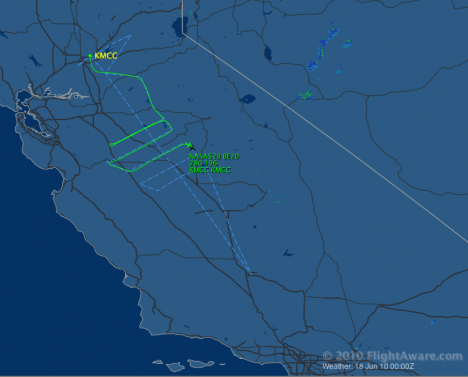
Just a brief heads-up, to signal a couple of particularly interesting links. You can check the status of the mission at any time by pointing your browser at this public Wiki page, and make sure we deliver our promises of “flying around” all over California by following the B-200 trajectories on Flight Aware. Just enter NASA529 as a tail number in the “Private Flight Tracker” field.
You can practice on today’s flight, which is took off a few minutes ago for an important coordinated mission with a third and fourth aircraft (the second being the G-1): the NOAA P3 and the NOAA Twin Otter. Below you see what you should if you followed the instructions correctly.
Last but not least, how to forget Rahul Zaveri’s memorable entries?


Why is our satellite mission named “Glory”? I can give you an explanation based on this short movie, which I captured from a downward looking camera on the B-200 during a recent flight.
While descending for landing, we encountered a cloud deck, and I received a clue for what, in geek terms, we call a scattering angle of 180 degrees, or backscattering direction (in this case, the scattering angle is the “Sun – point on cloud – me” angle).
In other words, I noticed the aircraft shadow on the clouds.
[youtube ddd5CUizyto 468]
A glory captured by the NASA B-200 downward looking camera on June
5th, 2010.
Sun beams entering a cloud droplet are internally reflected, sort of like balls in a circular pool table. Some of them exit the droplet after one of these reflections, to form the regular rainbow (or “cloudbow” in this case, barely visible on the left of the frames).
Others take a few more bounces. Those that exit the droplet in the same direction they came from form a small circular rainbow called a Glory, whose features are enhanced when observed in polarized light. The prism “color-splitting” effect, as for the primary rainbow, is due to the slightly different deflection angles that different colors take when crossing the interface between air and water (or, for all that matters, between any two media with different refractive indices).
It is good practice to always search for the Glory. An ideal chance occurs when you fly over clouds, but remember that only your ability to see the airplane shadow will tell you if you chose the right seat. In proximity of the shadow, the alignment between you and the Sun is appropriate to make sure that the Sun beams are returned to you straight back by the cloud droplets.
For those scared who are scared to fly, yet are avid hikers, pay attention if you find yourself between the Sun and a fog or cloud bank. The multicolor crown developing around the shadow of your head can make you a saint, and gave name to this glorious optical phenomenon. Hallelujah!

As previously stated, it is Cool like in Cool, CA.
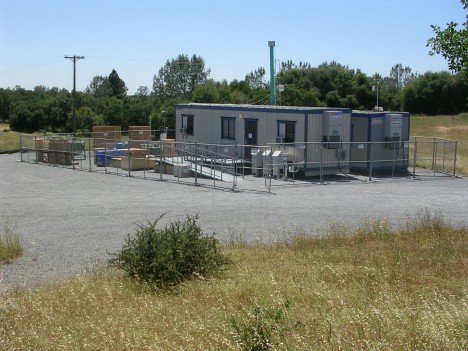
Our first science meeting took place midway between T0 (McClellan Air Force Base) and T1 (Cool), so I couldn’t get a better chance to drive to the site that marks our downwind sampling location (T1, that is).
Off Rt. 80, you’ve got to follow the bends of 49 and down the gorge past Auburn, a real pretty town draped around the turns of historic Rt. 40. Then you drive up for another 4 miles past the Cool quarry.

Amidst this rural, very rural area, lies Northside Elementary school. Classes have been over for a week now, yet the backyard still hosts activity spurred by eternal kids with grey hair.
[youtube EX5qIuVhGWs 468]
This very repetitive bird emanates sound waves and the wind and
temperature in the atmosphere above are derived from their influence
on the speed of sound.
In trailers parked as control stations for ground instrumentation they are monitoring every spike in incoming particulates. Everything is very peaceful…trees, Sun, and even digital birds chirping.


Rushing back to the meeting, I found a room plenty with people anxious to display their first week of data. It is very important in the beginning of a campaign to make sure we establish a consistent baseline among all the different instruments.
Big discussions have already been engaged as to what pertains to local events as opposed to consistent transport patterns, but some points confirm the expectations. On a daily basis, a wide variety of small particles including black carbon get transported until they’re detected miles downwind from the sources, growing in size and getting coated with sulfates and other organics. More mysteries are hidden behind the unexpected amount of ultrafine particles, less than 10 nanometers in size (1 nanometer is a billionth of a meter). We’re not sure where they come from but they’re all around the urban areas.
Matteo