

A successful field campaign collecting meteorological and hydrological data almost always involves a forecasting element. A detailed high quality forecast briefing on the potential evolution of weather events allows the scientists behind the scenes and out in the field to make crucial decisions that ultimately may determine the success of a project. While many joke that weather forecasters are allowed to be wrong half of the time, making a forecast that can affect the outcome of data collection is a serious task. Whether it be forecasting for strong winds (which affects the manual installation of multi-million dollar high resolution radar systems) or large hail (which can damage these expensive tools), providing the most accurate information possible was the primary goal for us at Iowa State University who provided a weather briefing every morning during IFloodS.
Each day, our forecast team of Dr. William Gallus, Ben Moser, and myself (Brian Squitieri) woke up bright and early to prepare the 9 AM weather briefing. We began each day by evaluating precipitation and stream data from the recent past to determine the extent of ground saturation present or the current height of the streams. This information is vital for making a flood forecast, particularly during a progressive weather pattern, where a series of atmospheric disturbances moving overhead may bring multiple days of heavy rainfall.
We as forecasters may determine a specific region or location that may be at greatest risk for experiencing flooding if we know the precipitation and river/stream gauge data for specific areas most affected by previous rainfall events and the current observations and model output –mathematical representations of the laws of physics used to simulate atmospheric features into the future. This is especially the case if model trends place the same area at risk for heavy rainfall that had experienced significant accumulations in the recent past.
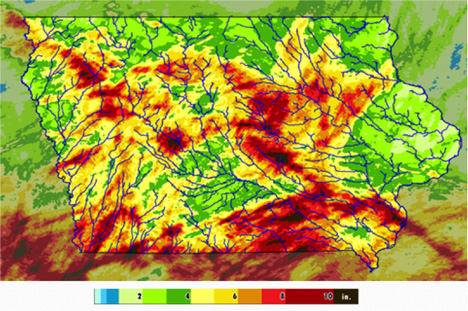
Rain gauge measurements and interpolation of rainfall totals within a six day period (valid 8 AM 05/31/2013). Areas of darkest red show regions that have accumulated the most rainfall. Rivers, streams, and sub-basins in these areas are most vulnerable for future flooding. Extra attention is thus given to these areas by the forecasters. Credit: NASA
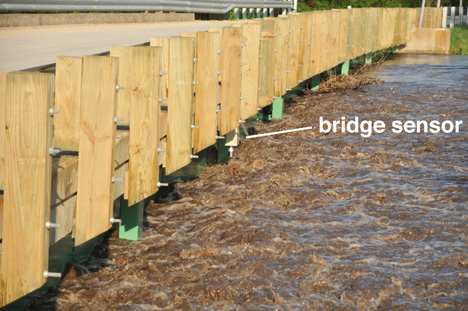
May 20, 2013. Bridge sensors like this one on the Little Cedar River measure the height of the water below it. When compared with past data, these measurements allow researchers to determine if the river is at flood stage or above. Credit: Iowa Flood Center
While one of the main goals of the IFloodS project was to evaluate precipitation events, observing and understanding severe thunderstorm events proved to be an equally vital component of the mission. Not only do many heavy rainfall events originate from severe thunderstorms, but the storms themselves can prove to be very damaging and pose a threat to the researchers and their equipment. As such, we had the additional duty of providing the most up to date forecast information from observations and model runs regarding the potential development of severe weather. Details included what the primary hazards were (strong straight line winds, large hail, tornadoes, or some combination of the three), where the most likely regions of impact were and what time frame was most favorable for the activity to occur.
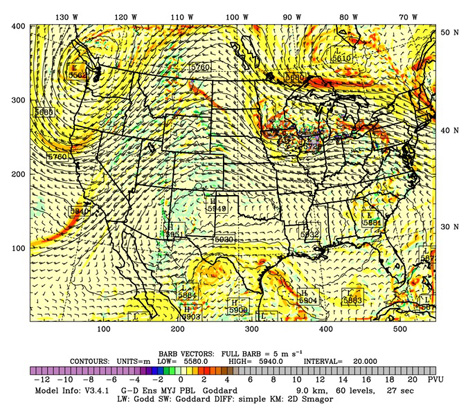
This map shows the atmospheric pattern at 500 mb for 7 PM CST 06/12/2013. A low pressure disturbance with a “U” shaped pattern over Iowa creates favorable conditions for air to rapidly rise upward to create showers and thunderstorms. Credit: NASA

This map shows the Convective Available Potential Energy (CAPE), the amount of energy available for thunderstorm to form and produce strong updrafts, capable of large hail and tornadoes (image valid for 4 PM CST 06/12/2013). Across Iowa, there is an east to west boundary dividing higher CAPE south from lower values immediately to the north. It is along this “CAPE Boundary” that one would expect severe storms on this particular day. Both this image and the one above are generated from the high resolution NASA Unified Weather Research and Forecasting (NU-WRF) model. The model run was initialized at 7 PM CST on 06/11/2013 and the images above were forecasts valid 24 and 21 hours into the simulation. Credit: NASA
One challenging event requiring accurate forecasting of both heavy rainfall and severe weather occurred June 12, 2013, where eastern Iowa was under the gun for significant severe thunderstorms. Observations and model outputs showed that the atmosphere was primed for a potential outbreak of thunderstorms. Supercells were expected with an initial threat of large hail (perhaps larger than golfballs) and strong tornadoes.
Within a few hours of development, a line of powerful storms was expected to further develop as the supercells would merge with each other and produce a widespread swath of very damaging straight line winds. Our Iowa State University Forecast team had briefed the IFloodS project at 9 AM of the potential for a dangerous weather event, particularly for the eastern most Iowa counties in the IFloodS project domain. The Waterloo area was of specific concern because the N-POL radar was located there and was susceptible to hail and wind damage.
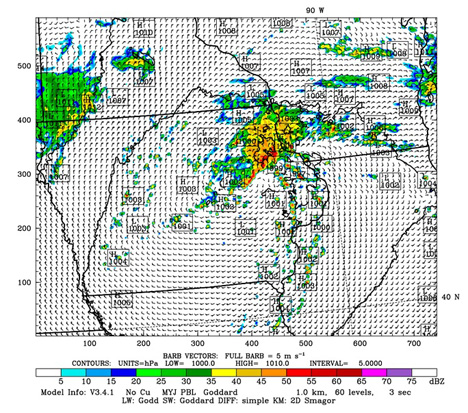
The image is NASA WRF model output from the 7 PM CST June 11, 2013 model run. It simulates what the radar would see in 24 hours at 4 PM CST on June 12, 2013. Credit: NASA
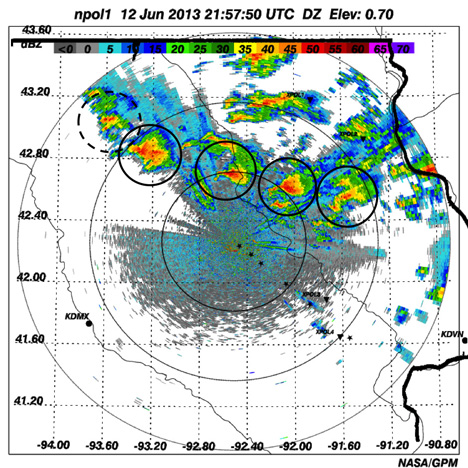
Actual radar measurements of the thunderstorm supercells at 3:57 p.m. CDT on June 12. Note the scale is not the same as the model output. Credit: NASA
This forecast proved to be rather accurate, as a northwest to southeast oriented line of supercell thunderstorms developed and moved just a few miles north of the city of Waterloo. While the damaging tornadoes were mainly confined immediately to the west and east of I-35 during a 45 minute period, large hail and winds threatened the rural areas immediately north of Waterloo.
Overall, the IFloodS project forecasting tasks proved to be an enlightening, challenging and exciting experience for the three of us. We learned a lot, and were especially happy with the use of the NASA Unified Weather Research and Forecasting (NU-WRF) mode, which proved to greatly enhance the accuracy of the forecasts themselves. While this tool was experimental, its first 24 hours of output handled the placement, timing and intensity of rainfall events very well. We quickly noticed the skill of this product and openly praised its usefulness in operations. Lastly, we thoroughly enjoyed this experience, and though the work was difficult at times, we look forward to possible similar future collaborations.
From May 1 to June 15, NASA and Iowa Flood Center scientists from the University of Iowa measured rainfall in eastern Iowa with ground instruments and satellites as part of a field campaign called Iowa Flood Studies (IFloodS). They will evaluate the accuracy of flood forecasting models and precipitation measurements from space with data they collect.
As an undergraduate (from February 2008 to May 2009), I worked for Dan Ceynar, the engineer who coordinates the instrumentation networks for the Iowa Flood Center, and a large part of my job then and since returning to the Iowa Flood Center last October has been taking care of our rain gauges in the field.
For the IFloodS campaign itself, I have also been working with rain gauges. I have been a part of the process of developing these instruments all the way through their construction, deployment, and now maintenance.
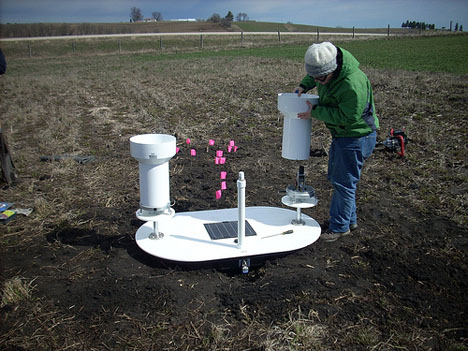
April 15, 2013. Kara Prior installs a rain gauge and soil moisture platform in the Turkey River basin in northeast Iowa. Credit: Iowa Flood Center
We use what are called, tipping bucket rain gauges that are a couple steps up from what many people have in their yards. The most important part is a central swinging shaft: on the top are two small buckets, and on the bottom is a magnet. Each bucket holds exactly 1/100th of an inch of rain, and when one fills up it makes the shaft swing to the other side. As it swings, the magnet on the bottom passes over two wires and causes them to touch and complete an electrical circuit– and that’s how we record that rain has fallen.
The engineers I work with designed the electronics that sit under the rain gauges and record their tips. I built the electronics boxes, which sit inside the rain gauge platform and have a cell phone modem, computer, and battery, which the rain gauges use to communicate data back to us every 15 minutes. A network of these gauges like what we have now in the Turkey River Basin can give us very detailed information about where and when rain has fallen.
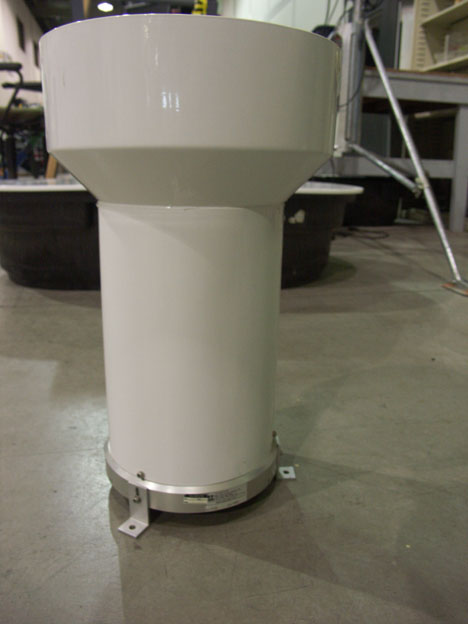
On the outside, a tipping bucket rain gauge looks like a typical plastic container. Credit: Kara Prior
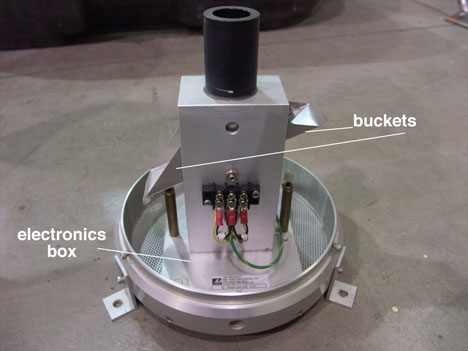
The inside of a tipping bucket rain gauge is shown here. The rain enters through the black pipe on top and fills one of two triangular buckets, here, the one on the right. When it fills to 1/100th of an inch, the bucket tips downward, raising the bucket on the left to collect rain. Below the buckets (not pictured, but inside the gray compartment), is a magnet that swings and completes a circuit that records the data onto the computer. Credit: Kara Prior
I also helped build the platforms they sit on — starting by picking up 50-gallon trough/tubs from a farm supply store in Cedar Rapids. All of this is our own design — Jim Niemeier’s and Dan Ceynar’s — and we just order the tipping bucket rain gauges themselves.
When I started with the Iowa Flood Center last year, I also built the latest batch of stream-stage sensors. The ones I built that have been deployed thus far are in the Ames area. So, they are not directly in the IFloodS area of interest, but they are identical to the ones we have around the state. So I still feel connected to them all!
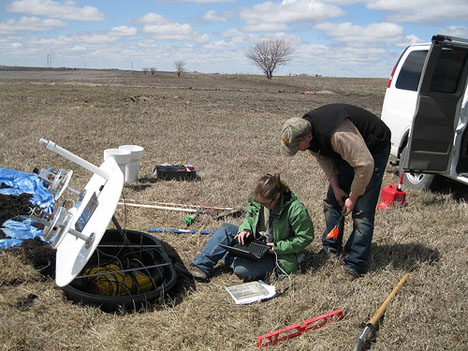
April 23, 2013. Setting up another rain gauge and soil moisture platform for IFloodS. Credit: Iowa Flood Center
The rain gauge and soil moisture sensor installations involve a fair amount of digging — and with the lingering winter, we did some of our digging with a pickaxe because the ground was still frozen solid! We had quite a few cold days, which made the few warm days feel like a gift. It was surprising a couple of times how much faster things went when our fingers weren’t cold and stiff!
I have loved getting to know this side of science research. Seeing all the different people and concerns that are a part of a project like this — getting to meet the landowners who let us install on their property — has been really cool.
Kara Prior is a research assistant at the Iowa Flood Center, where she helps oversee a network of rain gauges. She recently finished three years of study and teaching English in China and South Korea, where she earned a graduate certificate in Chinese studies from the Johns Hopkins University-Nanjing University Center for Chinese and American Studies. Kara also holds a BA/BS in international studies and environmental science from the University of Iowa. She has a strong interest in hydroscience and water resource management.
Vijay Mishra and I went to do a maintenance check yesterday on one of the 4 X-band radars that the University of Iowa is contributing to the IFloodS field campaign. Below is a photo of the radar, located at a topographical high point near Elkader, Iowa.
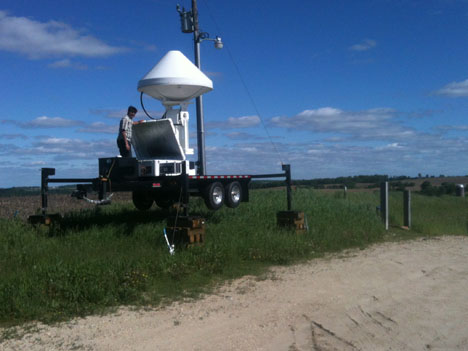
Vijay Mishra performs maintenance on the X-Band radar in the Turkey River basin. Credit: Matt Schwaller/ NASA
The X-band radar has a panoramic view of part of the Turkey River basin. Another University of Iowa X-band radar is located about 20 kilometers away and has a similar view of the watershed, although from a different perspective, of course.
A significant amount of rain has fallen during the IFloodS campaign, some areas within the campaign area received more than 11 inches of rain since May 1. The Turkey River is now and at or above flood stage.
Matt Schwaller is the GPM Ground Validation project manager with responsibilities for coordinating the development and operations of GPM GV in the pre- and post-launch phases of the GPM mission. He also occasionally takes the role of a field campaign mission scientist.
Although the significant convection stayed well south of the IFloodS area of study on the evening of 28 May, the multiple wavelength radars at the NPOL site captured the large anvil spreading out from the convection and the associated undulations beneath, known as mammatus. Mammatus clouds are often (but not necessarily) associated with severe weather and form on the underside of anvils due to large temperature, density and wind shear gradients between the cloud and the air. These types of clouds are very photogenic, especially at sunset.

May 28, 2013. Panorama of D3R (left) scanning mammatus at sunset. Copyright B. Dolan, Colorado State University

May 28, 2013.The NPOL radar under a large anvil with mammatus. Copyright Brenda Dolan, Colorado State University.
This case provides an interesting perspective from three different radar wavelengths. The S-band NPOL radar, with the longest wavelength of 10 cm, is less prone to attenuation (fading out over distance) and is most sensitive to precipitation-sized hydrometeors. NPOL captures the larger domain out to 135 km, with some indications of the undulations on the under side of the anvil and fingers of virga (rain evaporating before reaching the surface) beyond 50 km in range.
The shorter wavelengths of the D3R are more sensitive to smaller hydormeteors, but subject to more significant attenuation and only see out to 40 kilometers. The Ku-band (2.2 cm) shows the incredible structure in this type of cloud, while the shortest wavelength Ka-band (0.85 cm) is somewhat attenuated by water vapor in the atmosphere, resulting in less reflectivity than the Ku-band frequency. Using these three wavelengths in concert helps to provide a more complete picture of these beautiful clouds.
From May 1 to June 15, NASA and Iowa Flood Center scientists from the University of Iowa will measure rainfall in eastern Iowa with ground instruments and satellites as part of a field campaign called Iowa Flood Studies (IFloodS). They will evaluate the accuracy of flood forecasting models and precipitation measurements from space with data they collect.
Brenda Dolan is a Research Scientist at Colorado State University, Fort Collins Colo. in the Radar Meteorology group. Her interests include cloud microphysics and polarimetric radar. During IFloodS, she is spending nearly two weeks as the overnight radar scientist at NPOL and sent these observation notes from the NPOL site near Traer, Iowa.
When I heard that student volunteers were needed for IFloodS, I knew I wanted to take part. I had had little experience with fieldwork in the past. Most of my graduate work has been spent in front of a computer, conducting data analysis and performing hydrological modeling. I had difficulty visualizing the information I was working on — I didn’t have a good sense of how much 20 mm of rainfall is. I wanted to get outside and see for myself!
I was one of three Iowa Flood Center students who helped set up the NASA NPOL radar near Waterloo. It was a wonderful experience. The radar is really impressive — the antenna is 10 meters in diameter! I got to talk with some of the NASA representatives about the radar. It represents the next generation of radar systems, and will provide much more accurate rainfall estimates.
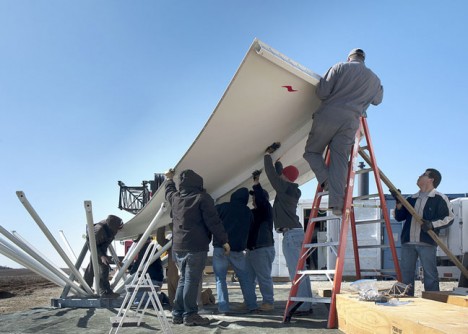
Apr. 25, 2013. IFloodS has provided students at the University of Iowa a unique opportunity. Graduate student, Bo Chen (far right), helps install the NASA NPOL radar Credit: Aneta Goska, Iowa Flood Center.
It was chilly in the morning when we started work, but it warmed up a lot as the day progressed — we all got sunburned! I didn’t have a good idea what kind of clothes to wear for fieldwork — I learned that it’s best to wear clothes you don’t care too much about. We got pretty dirty.
I also helped install four observation stations (three rain gauges each) near Shueyville, south of Cedar Rapids. We go to Shueyville once a week to clean and maintain the gauges — since the instruments are deployed in farm fields, they get dirty very quickly. It’s important to clean them up regularly. We saw dust in the buckets in just a few days’ time. While we’re there, we also download the data from the data logger. It is then uploaded into the IFloodS portal where the science teams can access it and displayed on Iowa Flood Information System, IFIS.
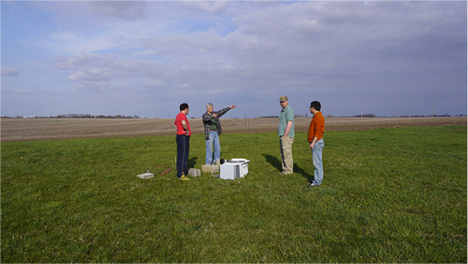
Gilles Molinié, Université Joseph Fourier and Witold Krajewski, Jim Neimeier, and Bo Chen, Iowa Flood Center, discuss the location for a disdrometer for the IFloodS campaign. Molinié brought the disdrometer from Switzerland to collect data during the IFloodS campaign. Credit: Fred Ogden, University of Wyoming.
I worked with Jim Niemeier to install three rain gauges at an experimental Iowa State site near Des Moines. It was a tough day! We saw a lot of mice, and Jim explained that sometimes animals like to burrow in under the platforms. When we remove the platforms, who knows what might be waiting for us? Perhaps a scared and threatened animal. Animals also sometimes chew the wires, so we have to watch out for that.
For me, this fieldwork experience has been really fun. I now understand the importance of getting out into the field. Tiny things do matter — if it’s not done right, the data can be biased. I learned that careful fieldwork is vital for research. For instance, I learned that I can’t sit on the base of the rain gauges, because my body weight could destroy the level and bias the measurement. I caught myself just before I sat down. I jumped up and thought, “No, I can’t do that!”
I also learned that my professors in Engineering do make efforts to collect reliable firsthand data. I also found that fieldwork is difficult, and we have to be very careful in order to collect good data. Exposure to experiments like IFloods may help to build up our knowledge about fieldwork, and ultimately advance our understanding of complex natural processes.
Bo Chen is a doctoral student in the Civil and Environmental Engineering Department at the University of Iowa working with Professor Witold Krajewski. His research interests include enhancing flood prediction and hydrologic modeling, specifically the hillslope hydrological process and channel routing. During the IFloodS campaign, he is heading up a group of University of Iowa students in servicing and collecting data from one of the field sites.