Hi there,
After a science-packed 3 weeks on the ice sheet, the team has returned to Kulusuk, more successful than we ever expected. We accomplished the following:
- Drilled ice cores at three sites to measure firn density, and to take chemistry samples
- Installed wells at three sites for water sampling
- Measured firn permeability at different depths within the ice sheet at three sites
- Used dye to measure how long it takes for surface meltwater to flow to the aquifer
- Injected saltwater into the aquifer to measure how fast the water in the aquifer is flowing
- Measured the volume of water at 12 sites with magnetic resonance soundings
- Located the bottom of the aquifer at 12 sites using seismic refraction (4120 reps of hitting a sledge hammer on a metal plate!)
- Identified the water table along 16 km with ground penetrating radar (GPR)
- Maintained a weather station and 2 water level and temperature monitoring stations we installed last year
- Installed a new water level and temperature monitoring station
First, I’ll describe a little bit about life on the ice sheet, followed by a description of the science work we did.
On a typical day, we get up around 7 and begin melting ice to make water so we can make breakfast. We generally eat instant oatmeal or, on special days, pancakes. We discuss our plans for the day and make a daily check in call to get weather updates and logistics support. This year, with 6 people in the field, we were able to divide into groups of 2 or 3. Generally, we had an ice core and hydrology team and a geophysics team. The ice core drilling and hydrology team would drill ice cores and install wells. The geophysics team did the seismic, magnetic resonance, and GPR work. Some days our work sites were in camp and we could eat a hot lunch, and other days we commuted to remote sites and packed a lunch. We had daylight until close to midnight so we often worked until 7 or 8 at night, before heading back to the cook tent to melt snow for dinner. For dinner, we eat things like pasta, couscous, or indian food that you boil in a bag. The weather was fantastic for our field work. The highs were around 5C and the lows and night were around -5C. We only had two cloudy days, which were actually a nice break from the intense sunlight we experienced the rest of the time.
Right before we went out to the ice sheet, we heard news about a polar bear entering a science camp much farther north. In response to this scary news, we beefed up our bear protection. We placed our 4 sleep tents close together, surrounded first by an electric fence and then by a trip wire that sets off a loud alarm when it is broken (I know it is loud because we had a few false alarms in the middle of the night! I have never jumped out of my 2 sleeping bags and tent so fast!) We also carried a rifle, bear spray, and noisemakers. Luckily, the only wildlife we saw was a bird on our last day on the ice.
Now for the science!This field season we had a very ambitious plan for the seismic imaging of the base of the aquifer. Based upon what we learned in last year’s field season, we wanted to investigate more of the ice lying beneath the aquifer. To do this with our seismic refraction lines, we needed to have a much longer line (540 meters vs. last year’s 275 meters). This required flipping the line of geophones after shooting the first one, and then reshooting the reversed line. Each line took 340 hammer swings to complete, with an invigorating 30 shot stack at either end being the big challenge for the hammer swingers. We also wanted a regular spacing of the seismic lines this field season; this required a bit more travel than last year on the snowmobile, with a total of 12 seismic lines spaced nearly every 2 kilometers. Some really interesting structure emerged from all this work, with in-field analysis allowing us to find the base of the water-ice transition and even see the ice-rock interface at the bed! Everyone lent an arm to the seismic work, for a total of 4120 recorded hammer swings (and a pretty dented metal plate)!
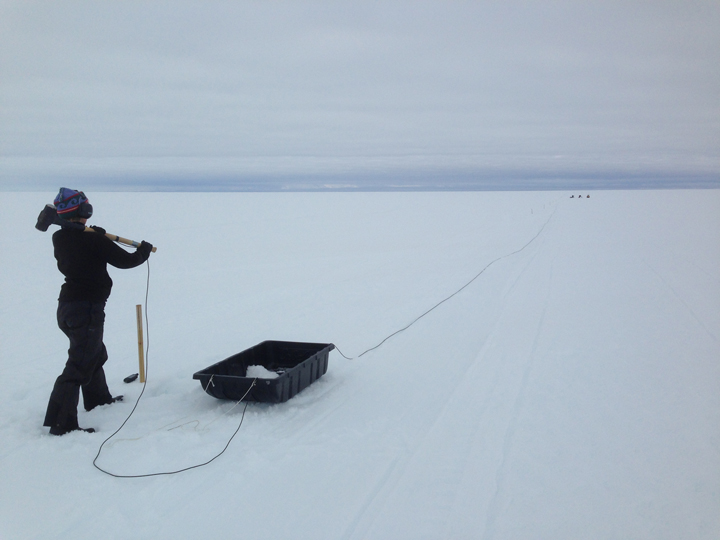
Olivia waiting for the okay to swing the hammer one more time.
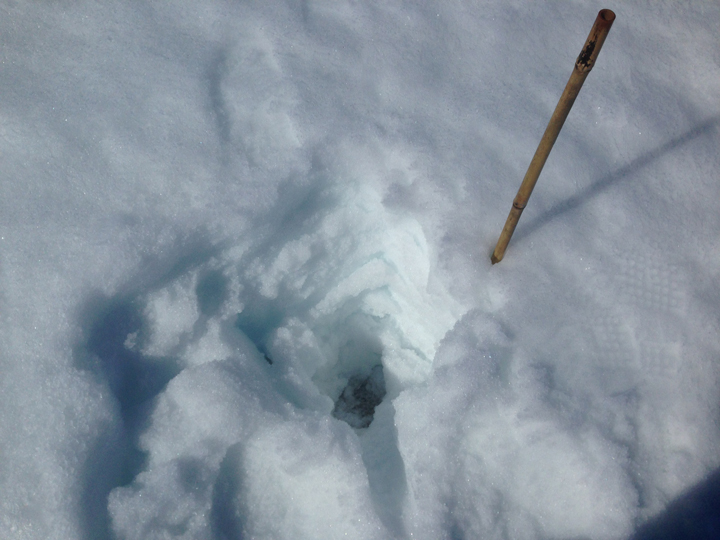
A buried plate after 30 hammer swings.
In addition to the seismic experiments, our team performed some magnetic resonance soundings and ground-penetrating radar (GPR) surveys. These two measurements combined with the seismic data help us to understand the firn aquifer structure as a whole. While the seismic measurements give us a good idea of the transition of the firn aquifer to the ice, the ice-penetrating radar was able to precisely (30 cm resolution) image the water table by sending electromagnetic waves from the surface and recording the time it takes to get them back (like a sonar on a boat). Combining seismic and radar data allowed us to get both top and bottom of the firn aquifer, therefore its thickness and its variations in space and time.
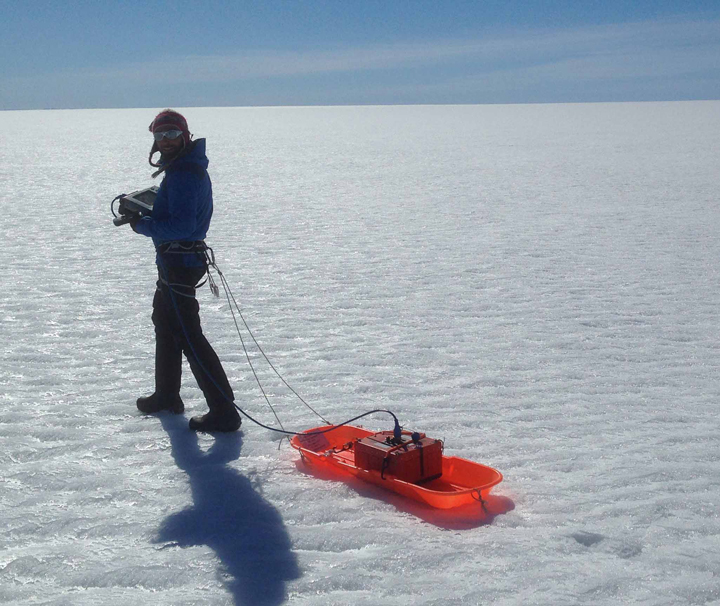
Initial GPR measurements by foot to check the presence of water and its depth. Later on we used a snowmobile to tow the radar.
The magnetic-resonance soundings (MRSs) complement the two previously described techniques by giving the total volume of free water (liquid) at each location. To measure the liquid water volume, we laid a loop of wire in a square shape, 80 x 80 m. This wire loop acts as both a transmitting and receiving antenna. For a short time, we transmit a current pulse at a known frequency through the firn and then allow the same antenna to receive the magnetic resonance response. Since only the proton in the water can generate a magnetic resonance signal at a precise frequency, we can estimate the water amount present within the wire loop.
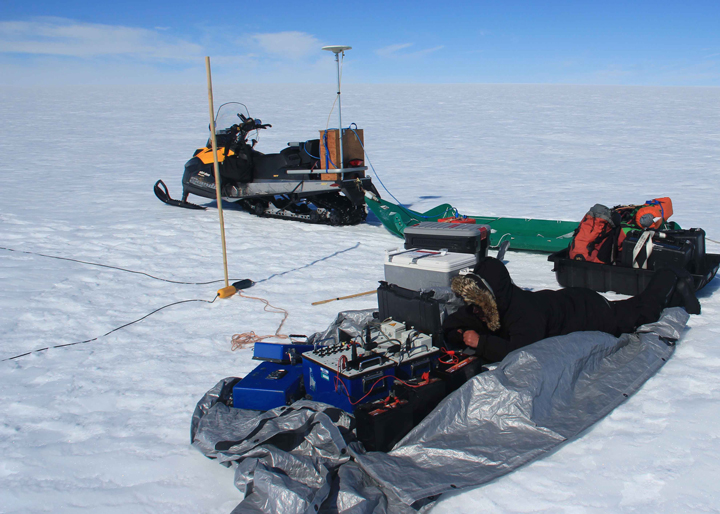
RS equipment ready for a sounding. Usually a sounding lasts between 3 and 5 hours based on how noisy the signal gets (the noisier it is, the longer the sounding takes).
Those three techniques (seismic, GPR, and MRS) complement each other nicely giving us crucial parameters to study the water present in the firn aquifer over our fieldwork location. During the 20 days in the field we were able to make 10 magnetic-resonance soundings and collect up to 100 km of GPR data, which will gives us very good spatial resolution while understanding the spread of this firn aquifer.
On the hydrology side, we installed wells and took water samples, measured permeability, and the water level like we did last year in 3 new locations. We also added a few new experiments. We did one experiments called a point dilution test where we injected salt water into the aquifer and measured how the fresh water flowing through the aquifer diluted the salt water. We can use these measurements to estimate how fast the water is flowing through the aquifer. This was really fun because we could see very quickly that the salt diluted more quickly in some parts of the aquifer than others, which tells us that the water flows at different rates in different zones.
Last summer we tried a test to measure how permeable the aquifer is called a pumping test. During a pumping test, you pump water out of the aquifer and measure how much you can lower the water table. If the water table doesn’t go down very much, it means that the water nearby can flow to the pump fairly easily. If the water table goes down a lot, it means that the water in the surrounding firn cannot flow easily enough to keep up with all the water you pump out. This summer we improved this test and were able to pump 1 liter of water per second out of the ice sheet for 5 hours! And even with all that pumping, we barely lowered the water table. This tells us that the firn is very permeable. Watch the video below to see the pumping test in in action.
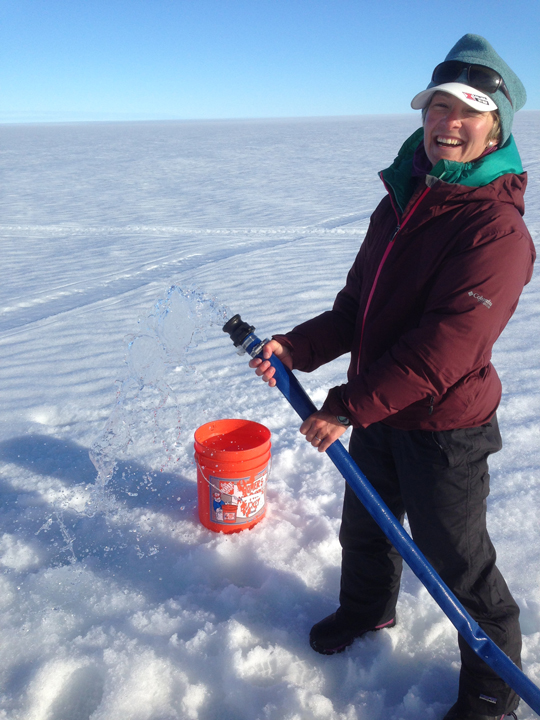
Pumping lots of water out of the ice sheet!
We also drilled ice cores at the same three sites. We measure the size and mass of each core, to determine the density of the firn and how it changes with depth. We also did a new test this year to measure the water content of the cores, and collected firn samples for chemical analysis.
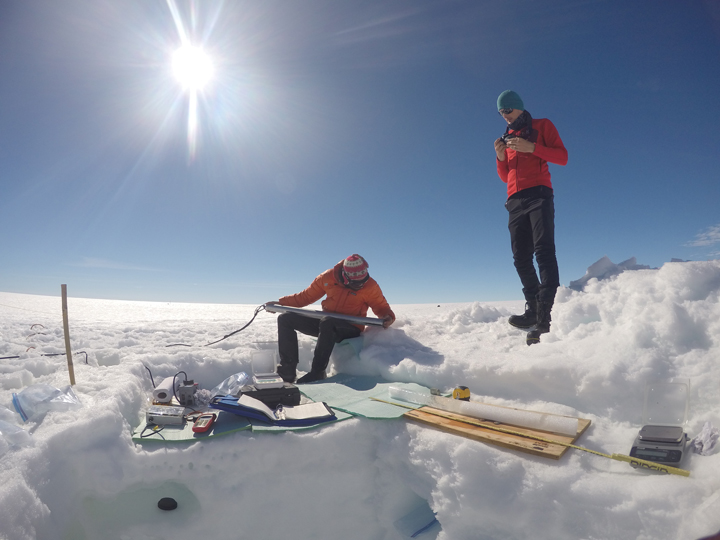
Clem and Stefan studying an ice core.
All in all, we got tons of data that tells us about the aquifer structure, where the water comes from, how fast it flows, how much liquid water is stored within the ice sheet, and what impact it has on melting of the ice sheet and sea level rise.
This was a fantastic team to spend 3 weeks in isolation on the ice with! Everyone worked hard and pitched in to help each other out. We all got a chance to try doing field work for all the different kinds of science going on too. This was a really fun way to learn about other people’s work.
Now that we are back in Kulusuk, we have some work to do drying our equipment out and pacing everything up in preparation to ship it home. Time flies in the Arctic. The sun is setting much earlier, and there is a little hint of fall in the air.


Knowledge leads to understanding. I wonder how many people believe you wasted time and money on this expedition. Thanks for all you do!