
On December 16, 2014, a science team led by Miguel Román of NASA’s Goddard Space Flight Center announced that they could detect significant changes in the amount and distribution of artificial lighting during the holiday seasons in North America, the Caribbean, and the Middle East. For instance, nighttime lights around many major U.S. cities shine 20 to 50 percent brighter due to holiday light displays and other activities in December. While the trend says some interesting things about culture, it also tells us something important about energy use.
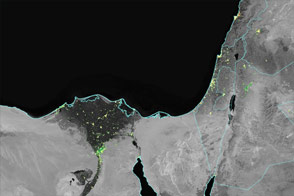
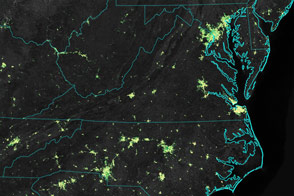
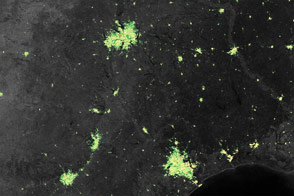
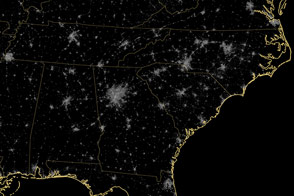
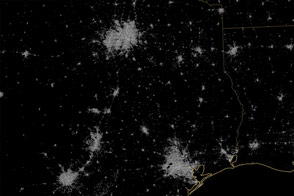
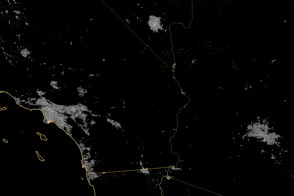
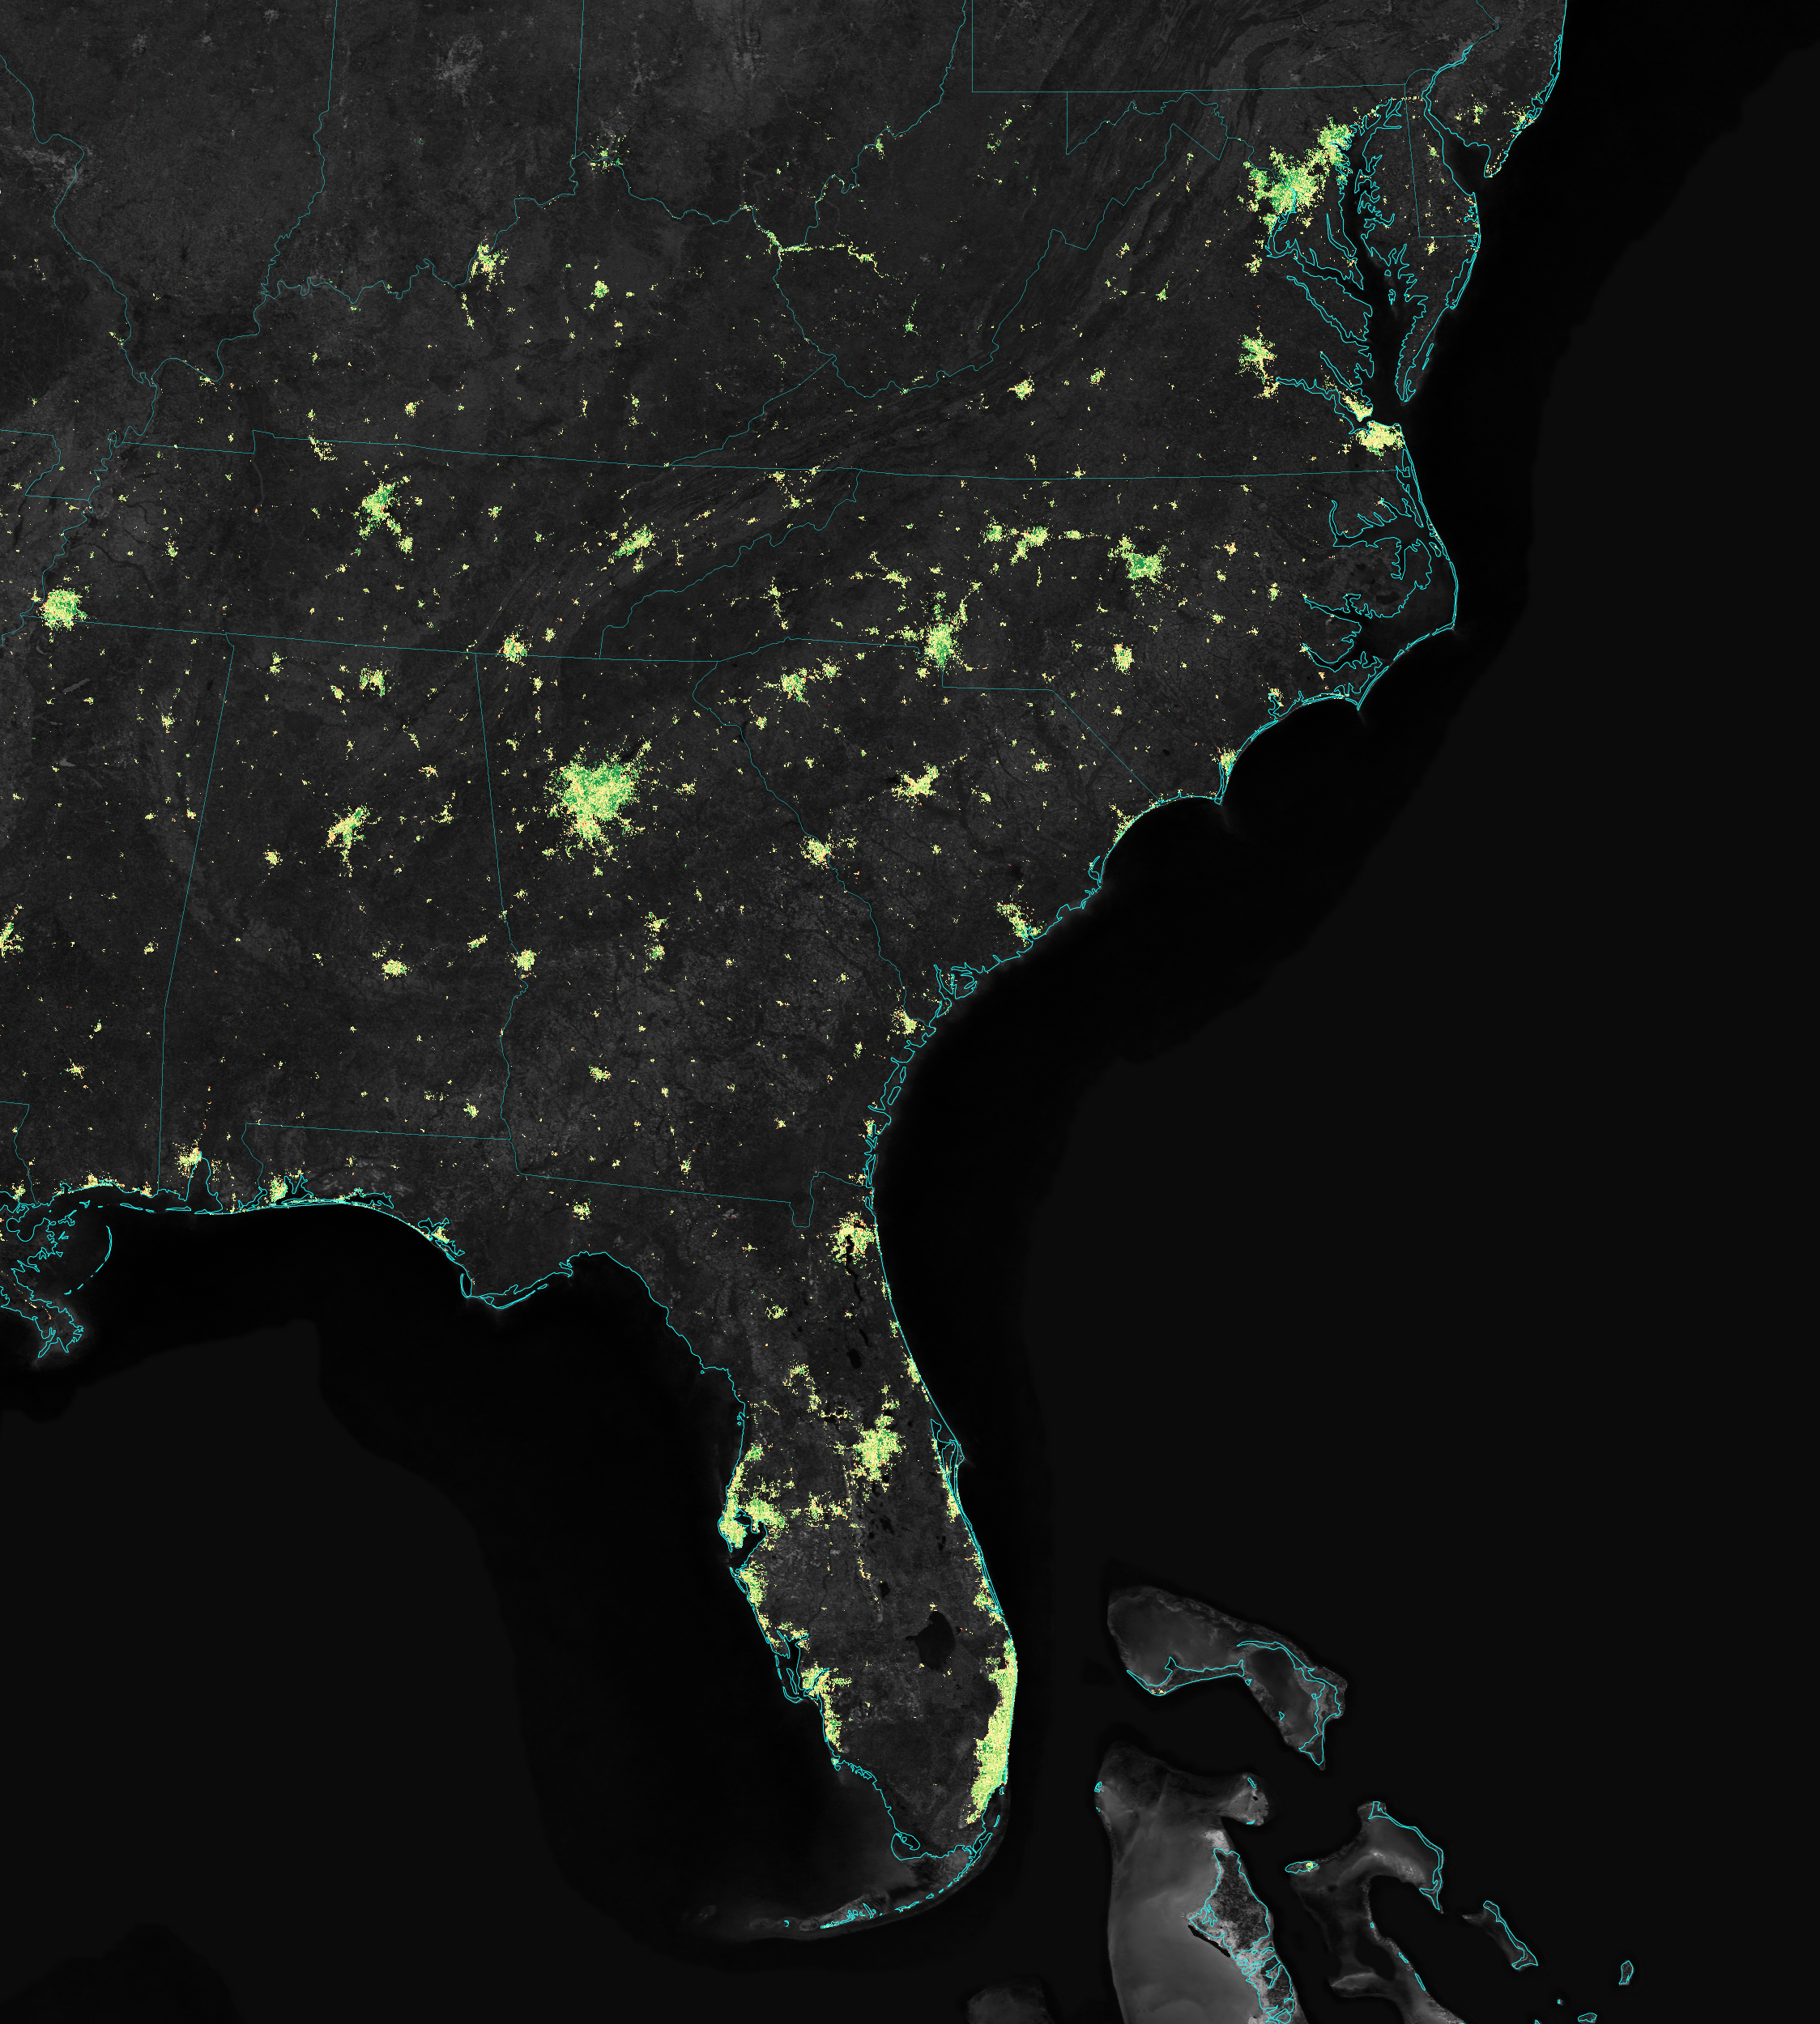
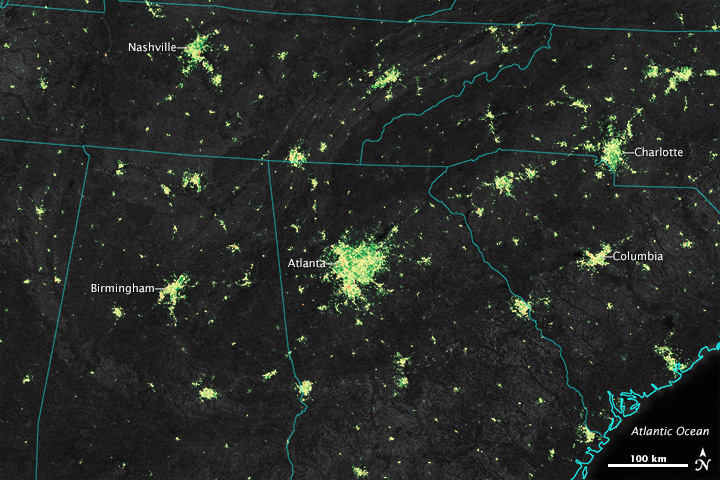
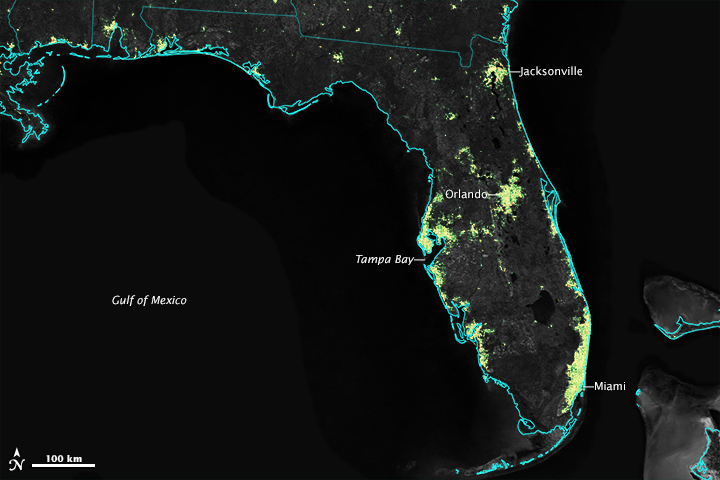
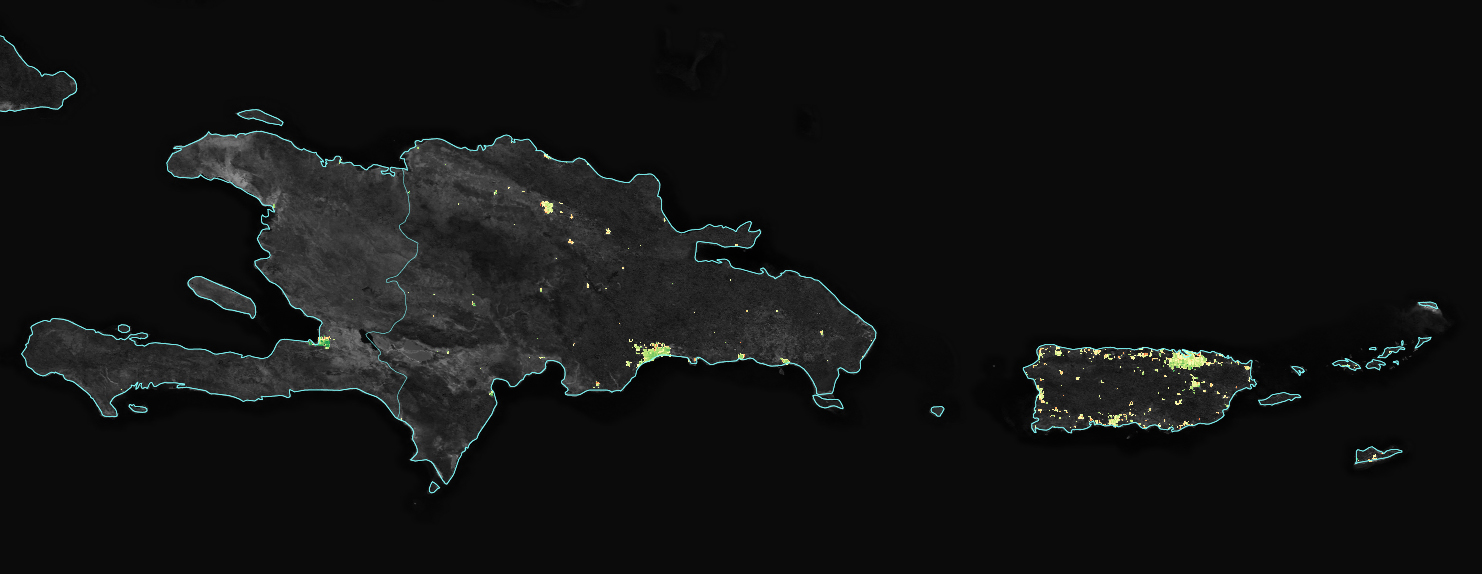
The maps on this page show changes in lighting intensity and location in the Southeastern United States, Puerto Rico, Haiti, and the Dominican Republic. They are based on data from the Visible Infrared Imaging Radiometer Suite (VIIRS) on the Suomi NPP satellite. The maps compare the nighttime light signals from December 2012 and 2013 to the average light output for the rest of 2012 to 2014. Green shading marks areas where light usage increased in December; yellow marks areas with little change; and red marks areas where less light was used.
Román and colleagues examined the light output from 70 U.S. cities as a first step toward determining patterns in urban energy use. They found that light intensity increased by 30 to 50 percent in the suburbs and outskirts of major cities. Lights in the central urban areas also increased, but not as much.
“Having a daily global dynamic dataset of nighttime lights is a new way to understand the broad societal forces impacting energy decisions,” said Eleanor Stokes, a NASA Jenkins Graduate Fellow and doctoral candidate at Yale University, who collaborated on the study with Román. As noted by the Intergovernmental Panel on Climate Change, improvements in energy efficiency and conservation are critical for making greenhouse gas reductions. Therefore, scientists and policymakers will need to better understand the forces and patterns driving energy use.

“More than 70 percent of greenhouse gas emissions come from urban areas,” Román said. “If we're going to reduce these emissions, then we’ll have to do more than just use energy-efficient cars and appliances. We also need to understand how dominant social phenomena, the changing demographics of urban centers, and socio-cultural settings affect energy-use decisions.”
Daily night lights data also provide a new way of looking at how people use cities. Earth-observing satellites such as Landsat have mapped the buildings and infrastructure within urban boundaries for decades. But the presence of buildings does not reveal whether people are actually using them. The new daily dynamic data from VIIRS is a step in that direction, Román noted.
“What’s really difficult to do is to try and track people’s activity patterns and to understand how this shapes the demand for energy services, ” Román said. “We can now see pieces of these patterns from space—when, where, and how often we turn on the lights.”
To view this video in English, click here.
NASA Earth Observatory images by Jesse Allen, using VIIRS day-night band data provided by Miguel Román (NASA/GSFC). Suomi NPP is the result of a partnership between NASA, the National Oceanic and Atmospheric Administration, and the Department of Defense. Caption by Kate Ramsayer and Mike Carlowicz.