
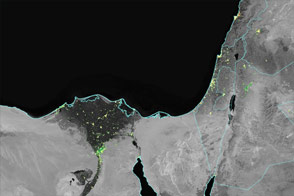
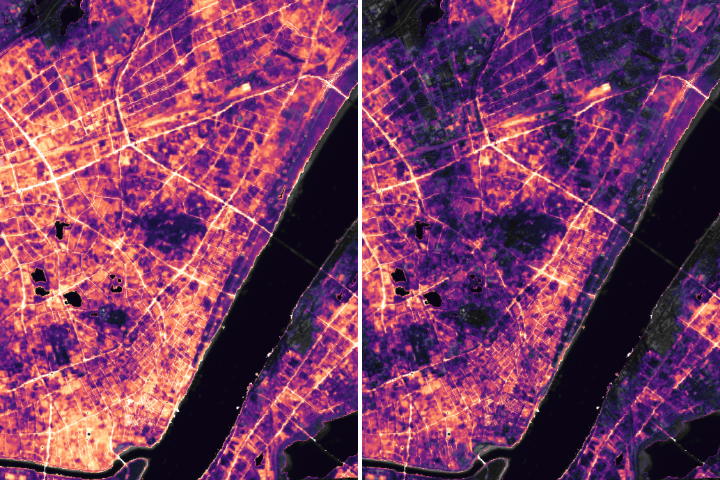
With a new look at daily data from the Suomi NPP satellite, a NASA scientist and colleagues have identified how patterns in nighttime light intensity change during major holiday seasons. According to the data, nighttime lights around many major U.S. cities shine 20 to 50 percent brighter during Christmas and New Year’s when compared to light output during the rest of the year. In some Middle Eastern cities, nighttime lights shine more than 50 percent brighter during Ramadan than the rest of the year.
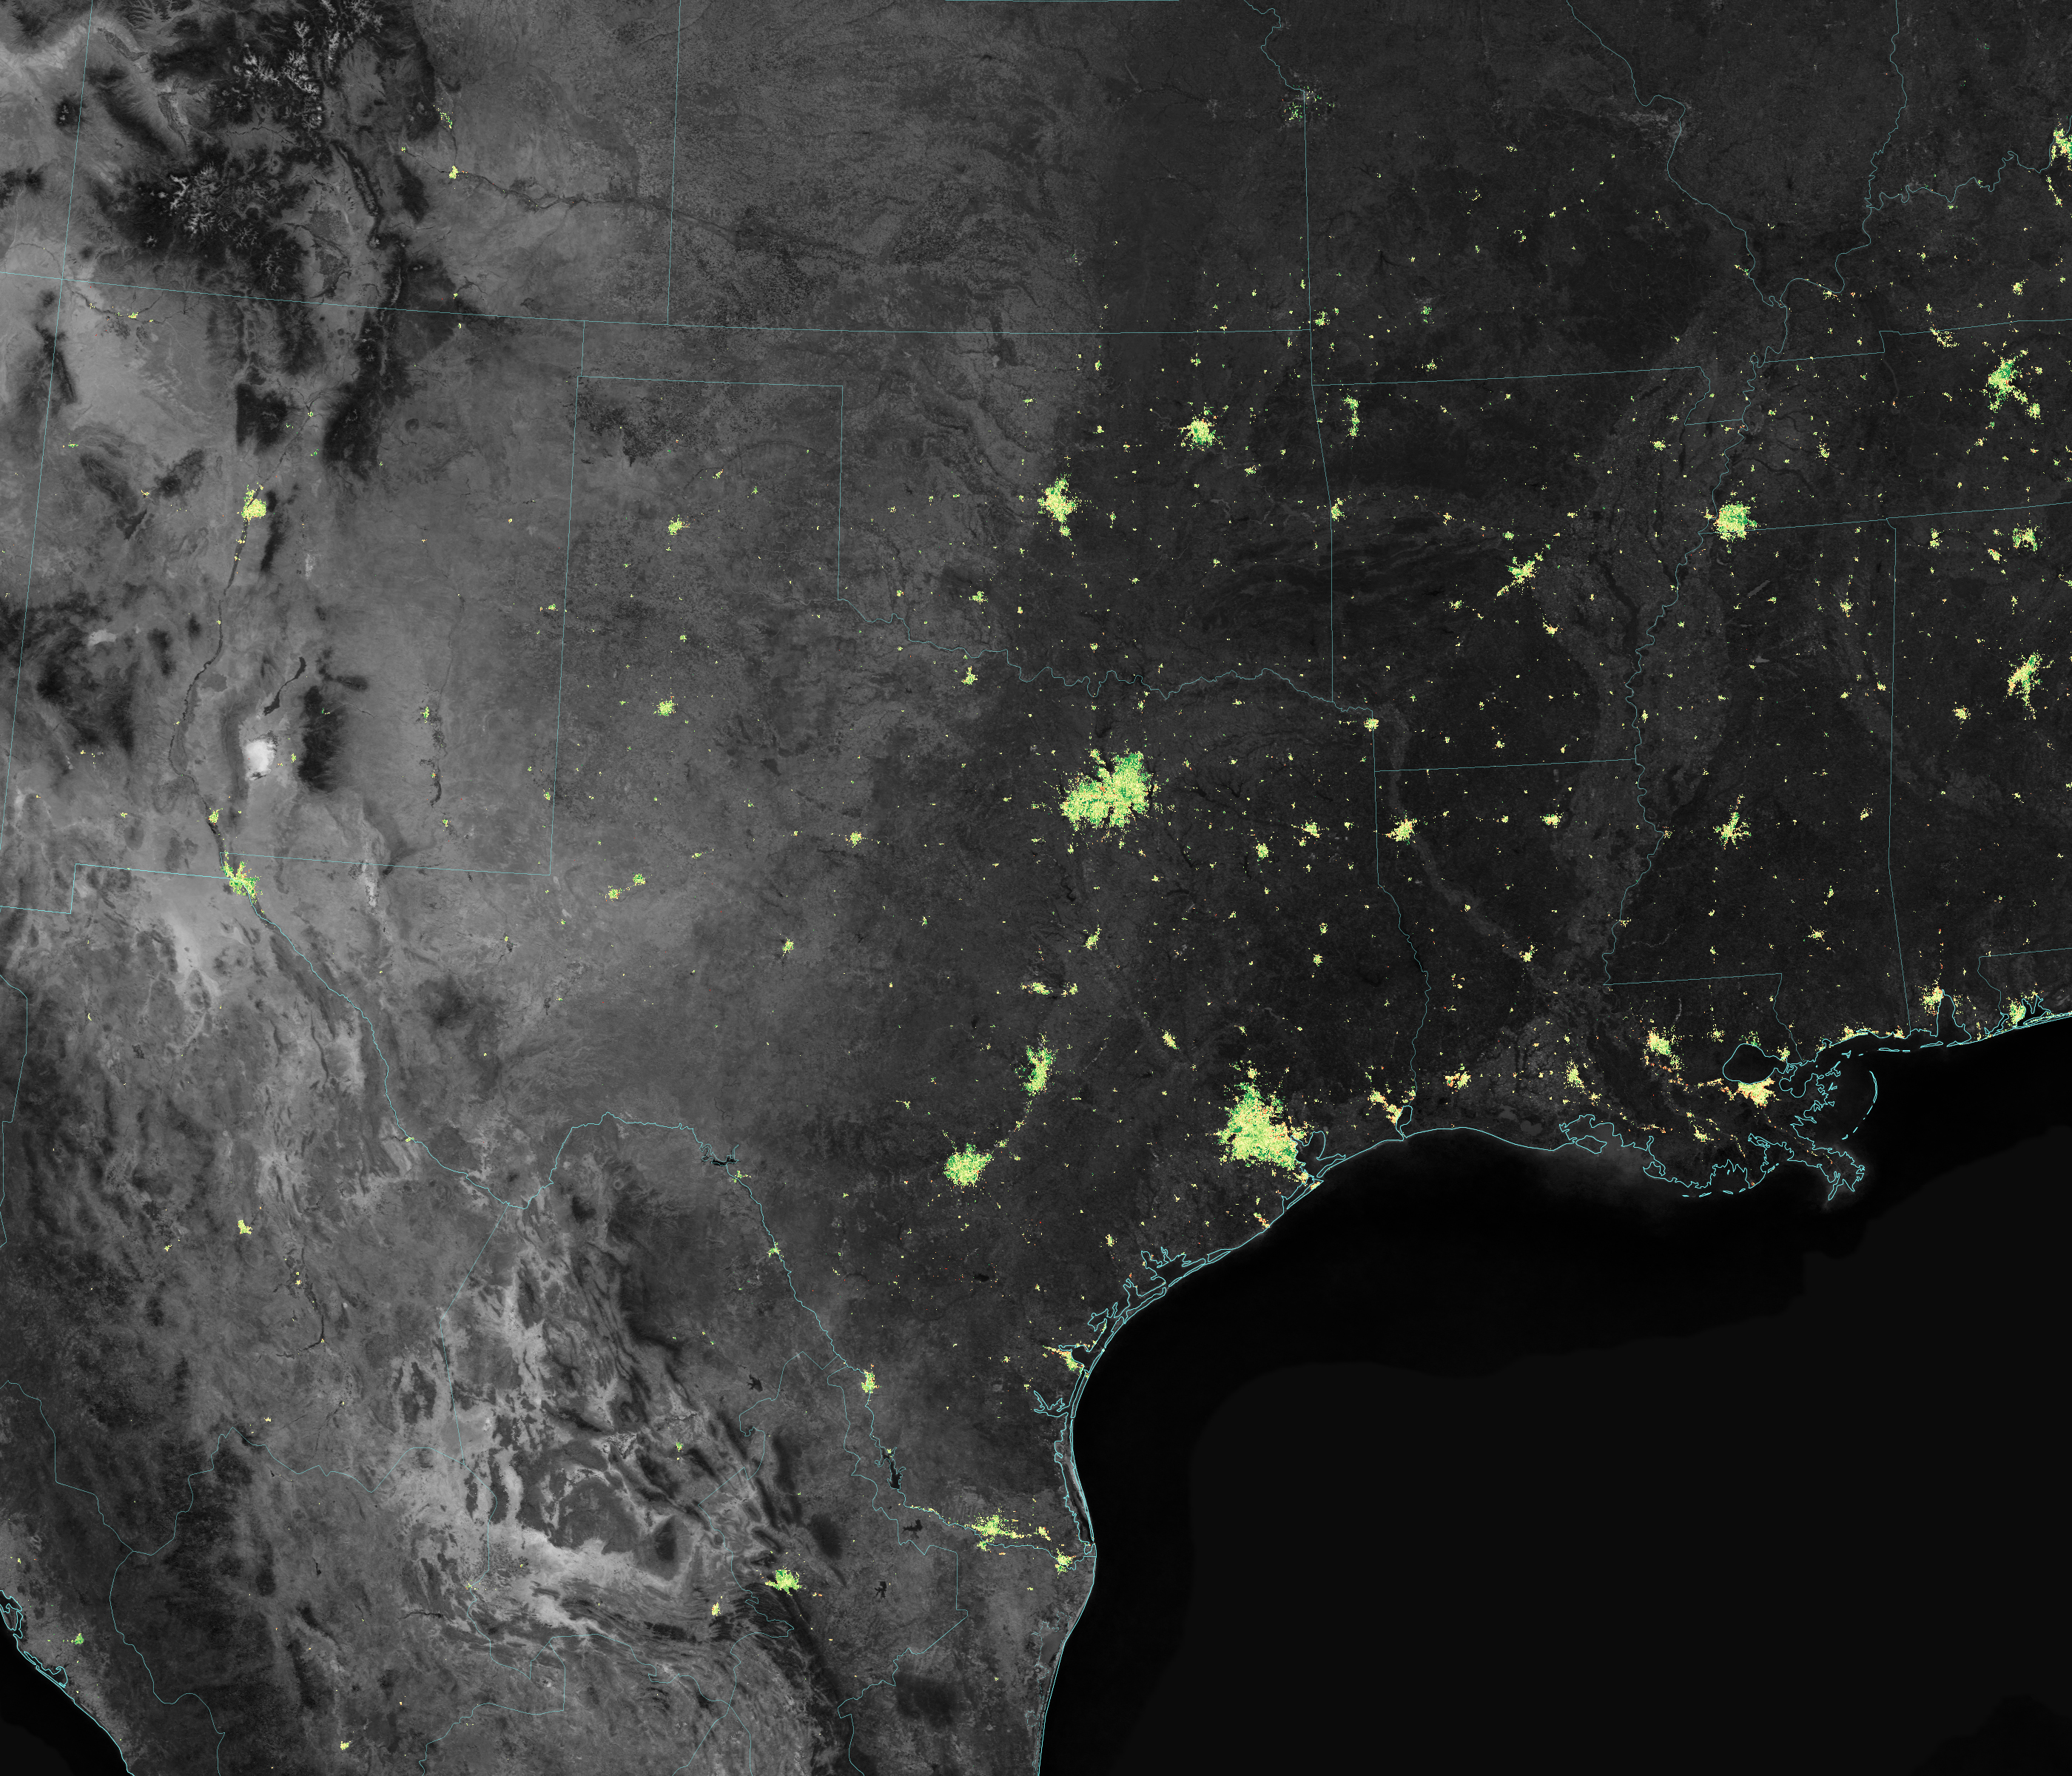
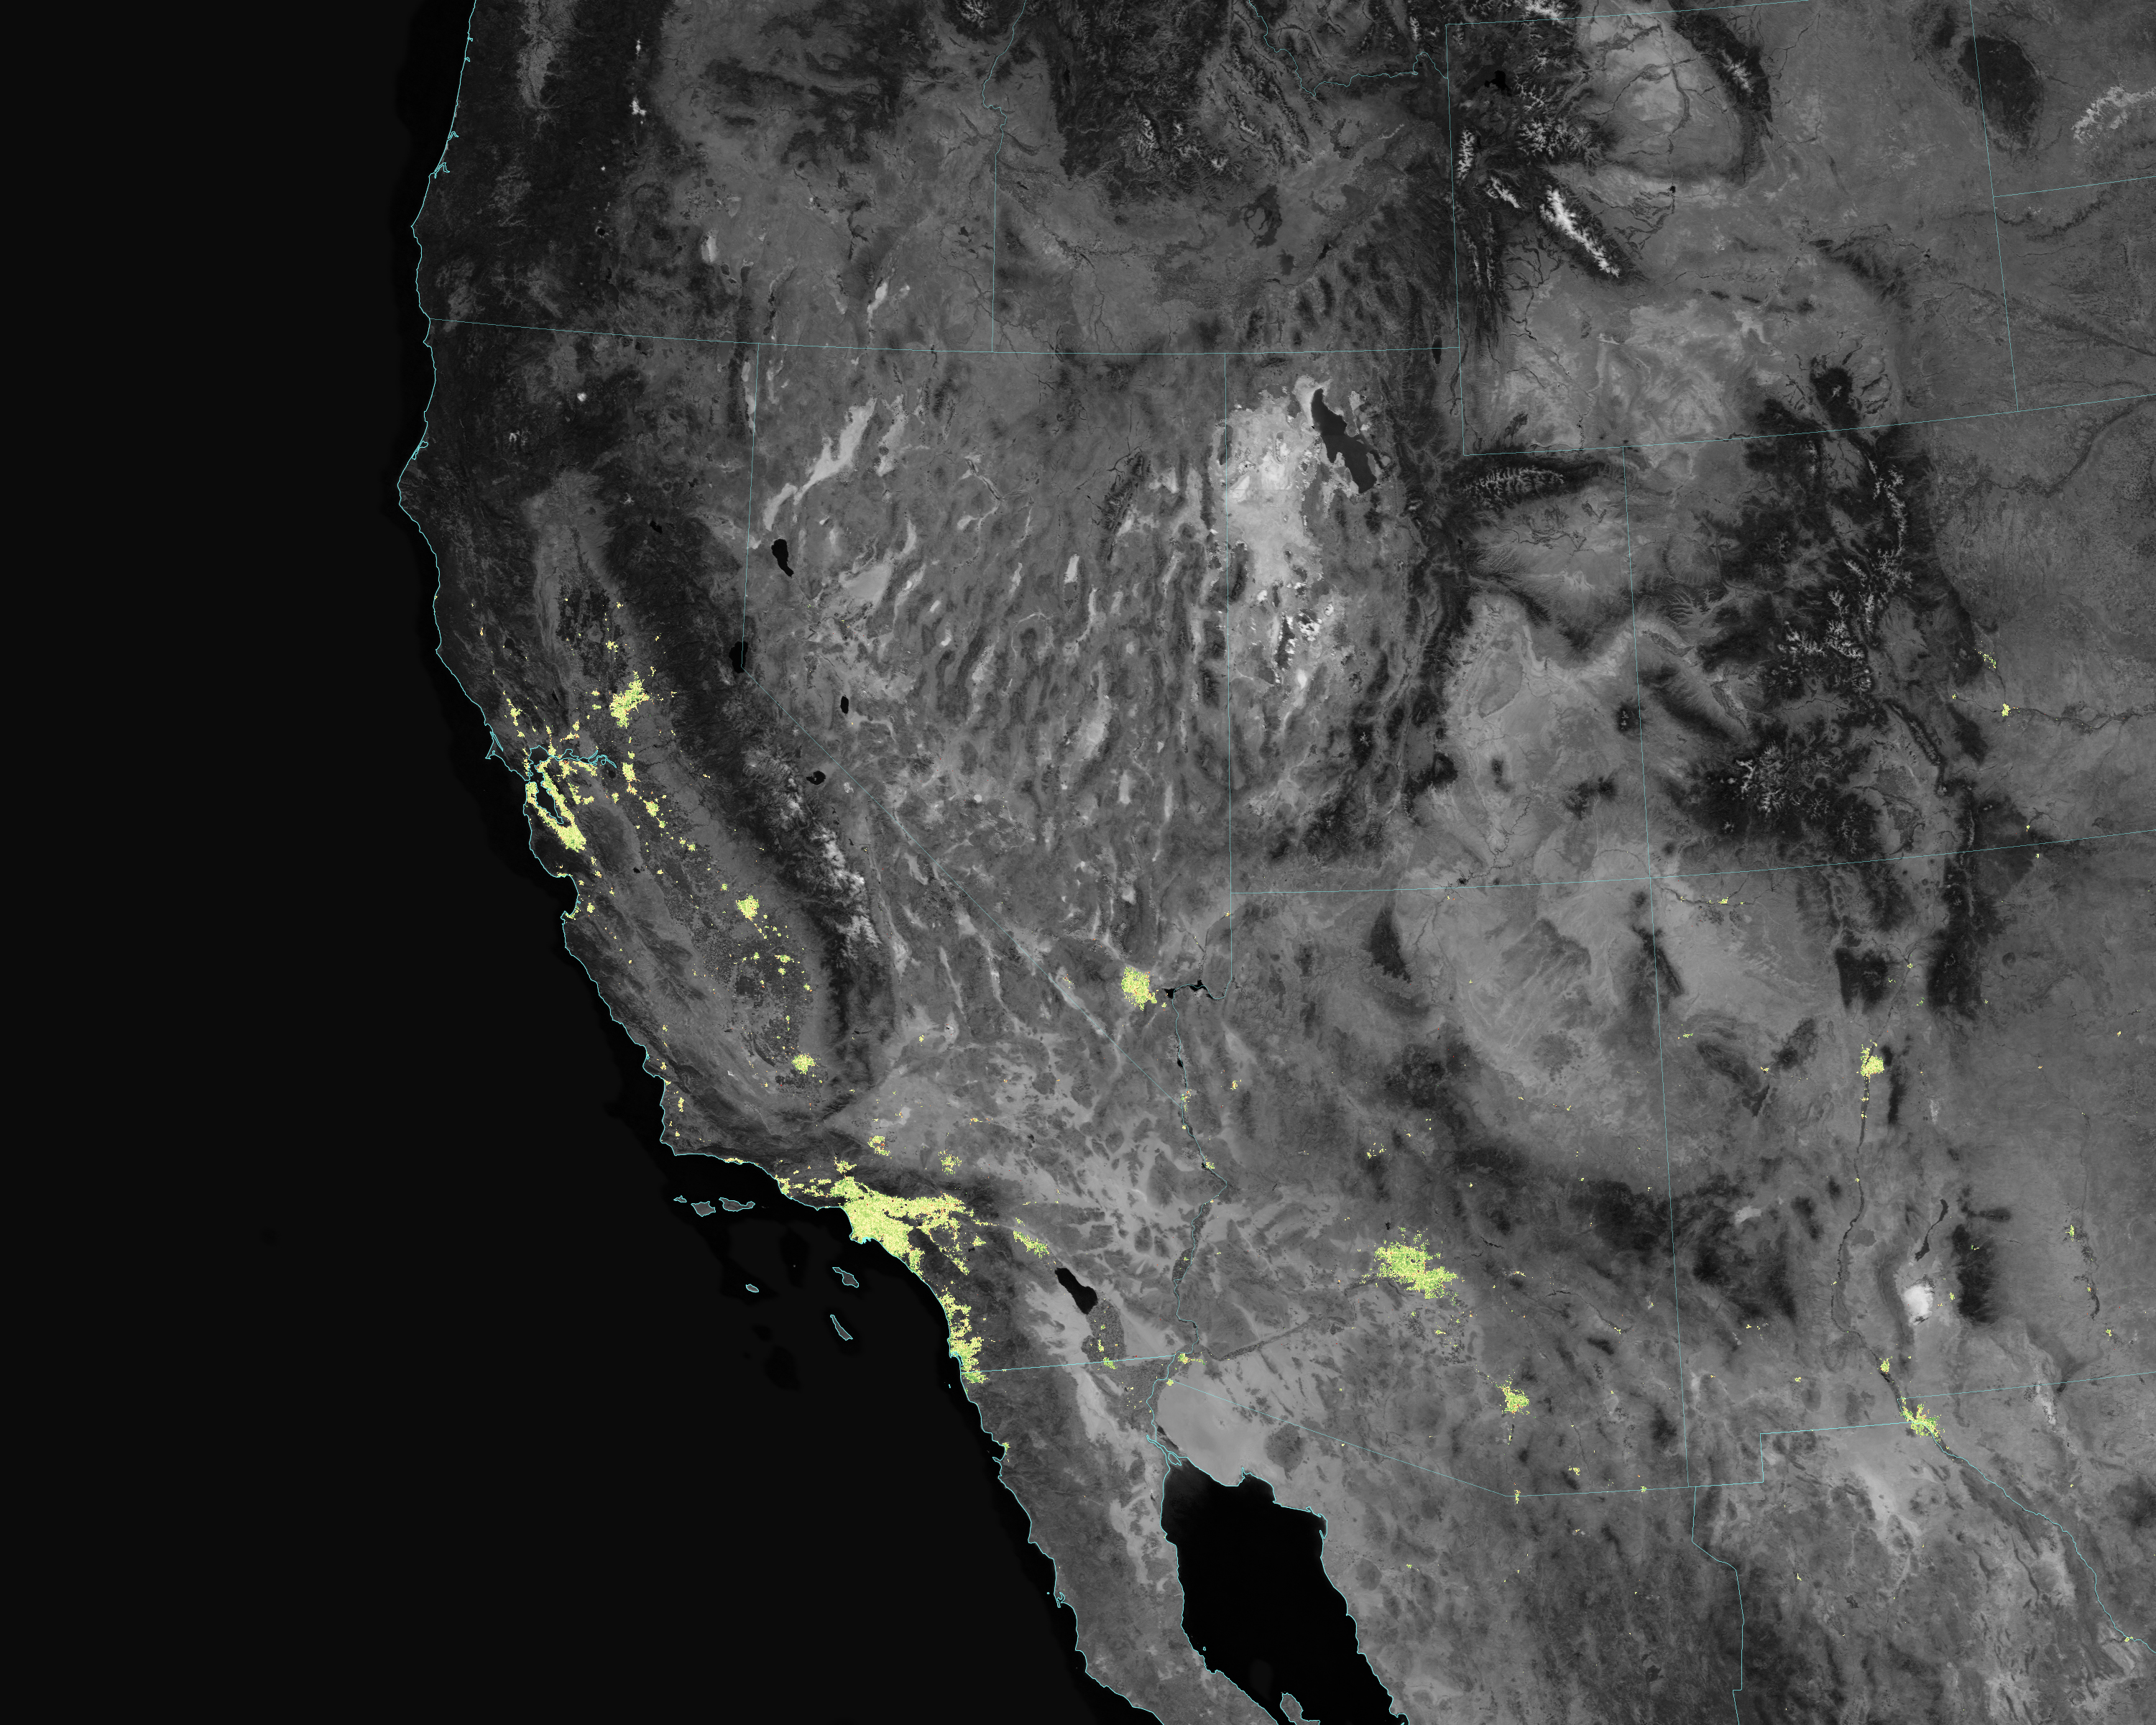
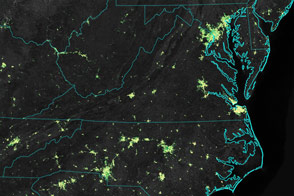
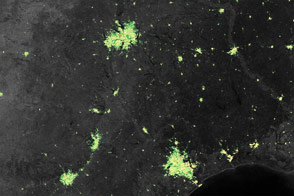
The maps above and below show the change in lighting intensity and location in Texas and Louisiana (top) and California, Arizona, Nevada, and northwest Mexico. The map compares the nighttime light signals from December 2012 and 2013 to the average light output for the rest of 2012 to 2014. Green shading marks areas where light usage increased in December; yellow marks areas with little change; and red marks areas where less light was used.
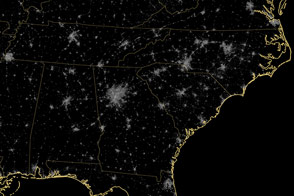
Suomi NPP, a joint NASA/National Oceanic and Atmospheric Administration (NOAA) mission, carries an instrument called the Visible Infrared Imaging Radiometer Suite (VIIRS) that detects light in a range of wavelengths from green to near-infrared as it flies over at roughly 1:30 a.m. and 1:30 p.m. each day. VIIRS has a low-light sensor, or “day-night band (DNB),” that can distinguish night lights tens to hundreds of times better than previous satellites. Scientists use the DNB to observe comparatively dim signals such as city lights, auroras, wildfires, and reflected moonlight.
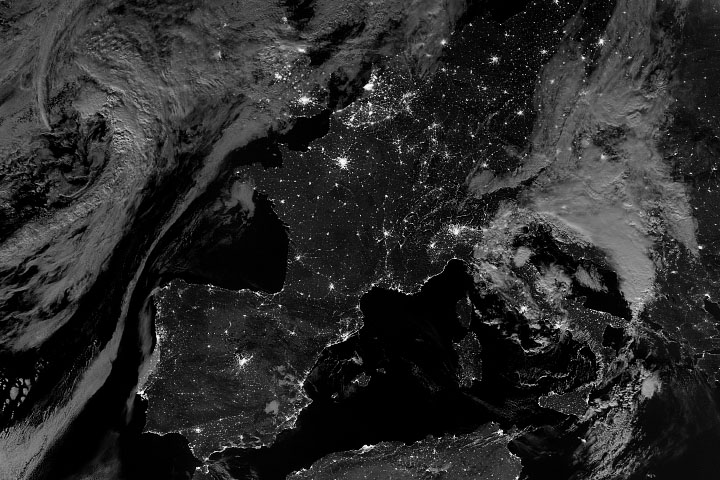
In 2012, scientists released new composite maps of Earth at night that were created from VIIRS DNB data. Those images were stitched together nights when there were no clouds or moonlight over any given area.
The new analysis of holiday lights uses an advanced algorithm that filters out moonlight, clouds, and airborne particles in order to isolate the lights on a daily basis. The data from this algorithm can provide high-quality satellite information on light output across the globe, allowing scientists to track when and how brightly people illuminate the night.
In the United States, the lights started getting brighter on the day after Thanksgiving and continued through New Years Day, said Miguel Román, a scientist at NASA’s Goddard Space Flight Center and member of the Suomi NPP Land Discipline Team. Román and colleagues examined the light output from 70 U.S. cities in 2012 and 2013 as a first step toward determining patterns in urban energy use—a key factor in greenhouse gas emissions.
The science team found that light intensity increased by 30 to 50 percent in the suburbs and outskirts of major cities. Lights in the central urban areas did not increase as much as in the suburbs, but still brightened by 20 to 30 percent. On any given night, the signal is subtle. But averaged over days and weeks, it is more perceptible. Click here to view raw images from individual nights in Texas and Louisiana; click here to see raw images from California and the Southwest.
“It’s a near ubiquitous signal,” said Román. “Despite being ethnically and religiously diverse, we found that the U.S. experiences a holiday increase across most urban communities. These lighting patterns are tracking a national, shared tradition.”
Because snow reflects so much light, the researchers could only analyze snow-free cities. They focused on the U.S. West Coast from San Francisco to Los Angeles and on cities south of a rough line from St. Louis to Washington, D.C.
"Overall, we see less light increases in the dense urban centers compared to the suburbs and small towns, where you have more yard space and single-family homes," said Eleanor Stokes, a NASA Jenkins Graduate Fellow and doctoral candidate at Yale University, who collaborated on the study with Román.
To view this video in Spanish, click here.
Read and view more about the day-night band and Earth at Night by clicking on the links below. Come back to the Earth Observatory later this month for more details and other regional view from the holiday lights study.
NASA Earth Observatory images by Jesse Allen, using VIIRS day-night band data provided by Miguel Román (NASA/GSFC). Suomi NPP is the result of a partnership between NASA, the National Oceanic and Atmospheric Administration, and the Department of Defense. Caption by Kate Ramsayer and Mike Carlowicz.


