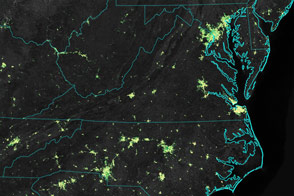

In December 2014, scientists using a NASA-NOAA satellite announced that they had detected significant changes in the amount and distribution of nighttime lighting during holiday seasons in the Middle East and North America. For instance, nighttime lights in some Middle East cities were 50 to 100 percent brighter during the holy month of Ramadan.
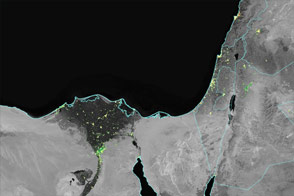
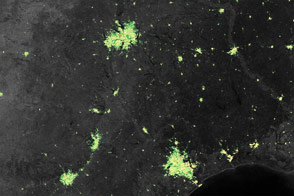
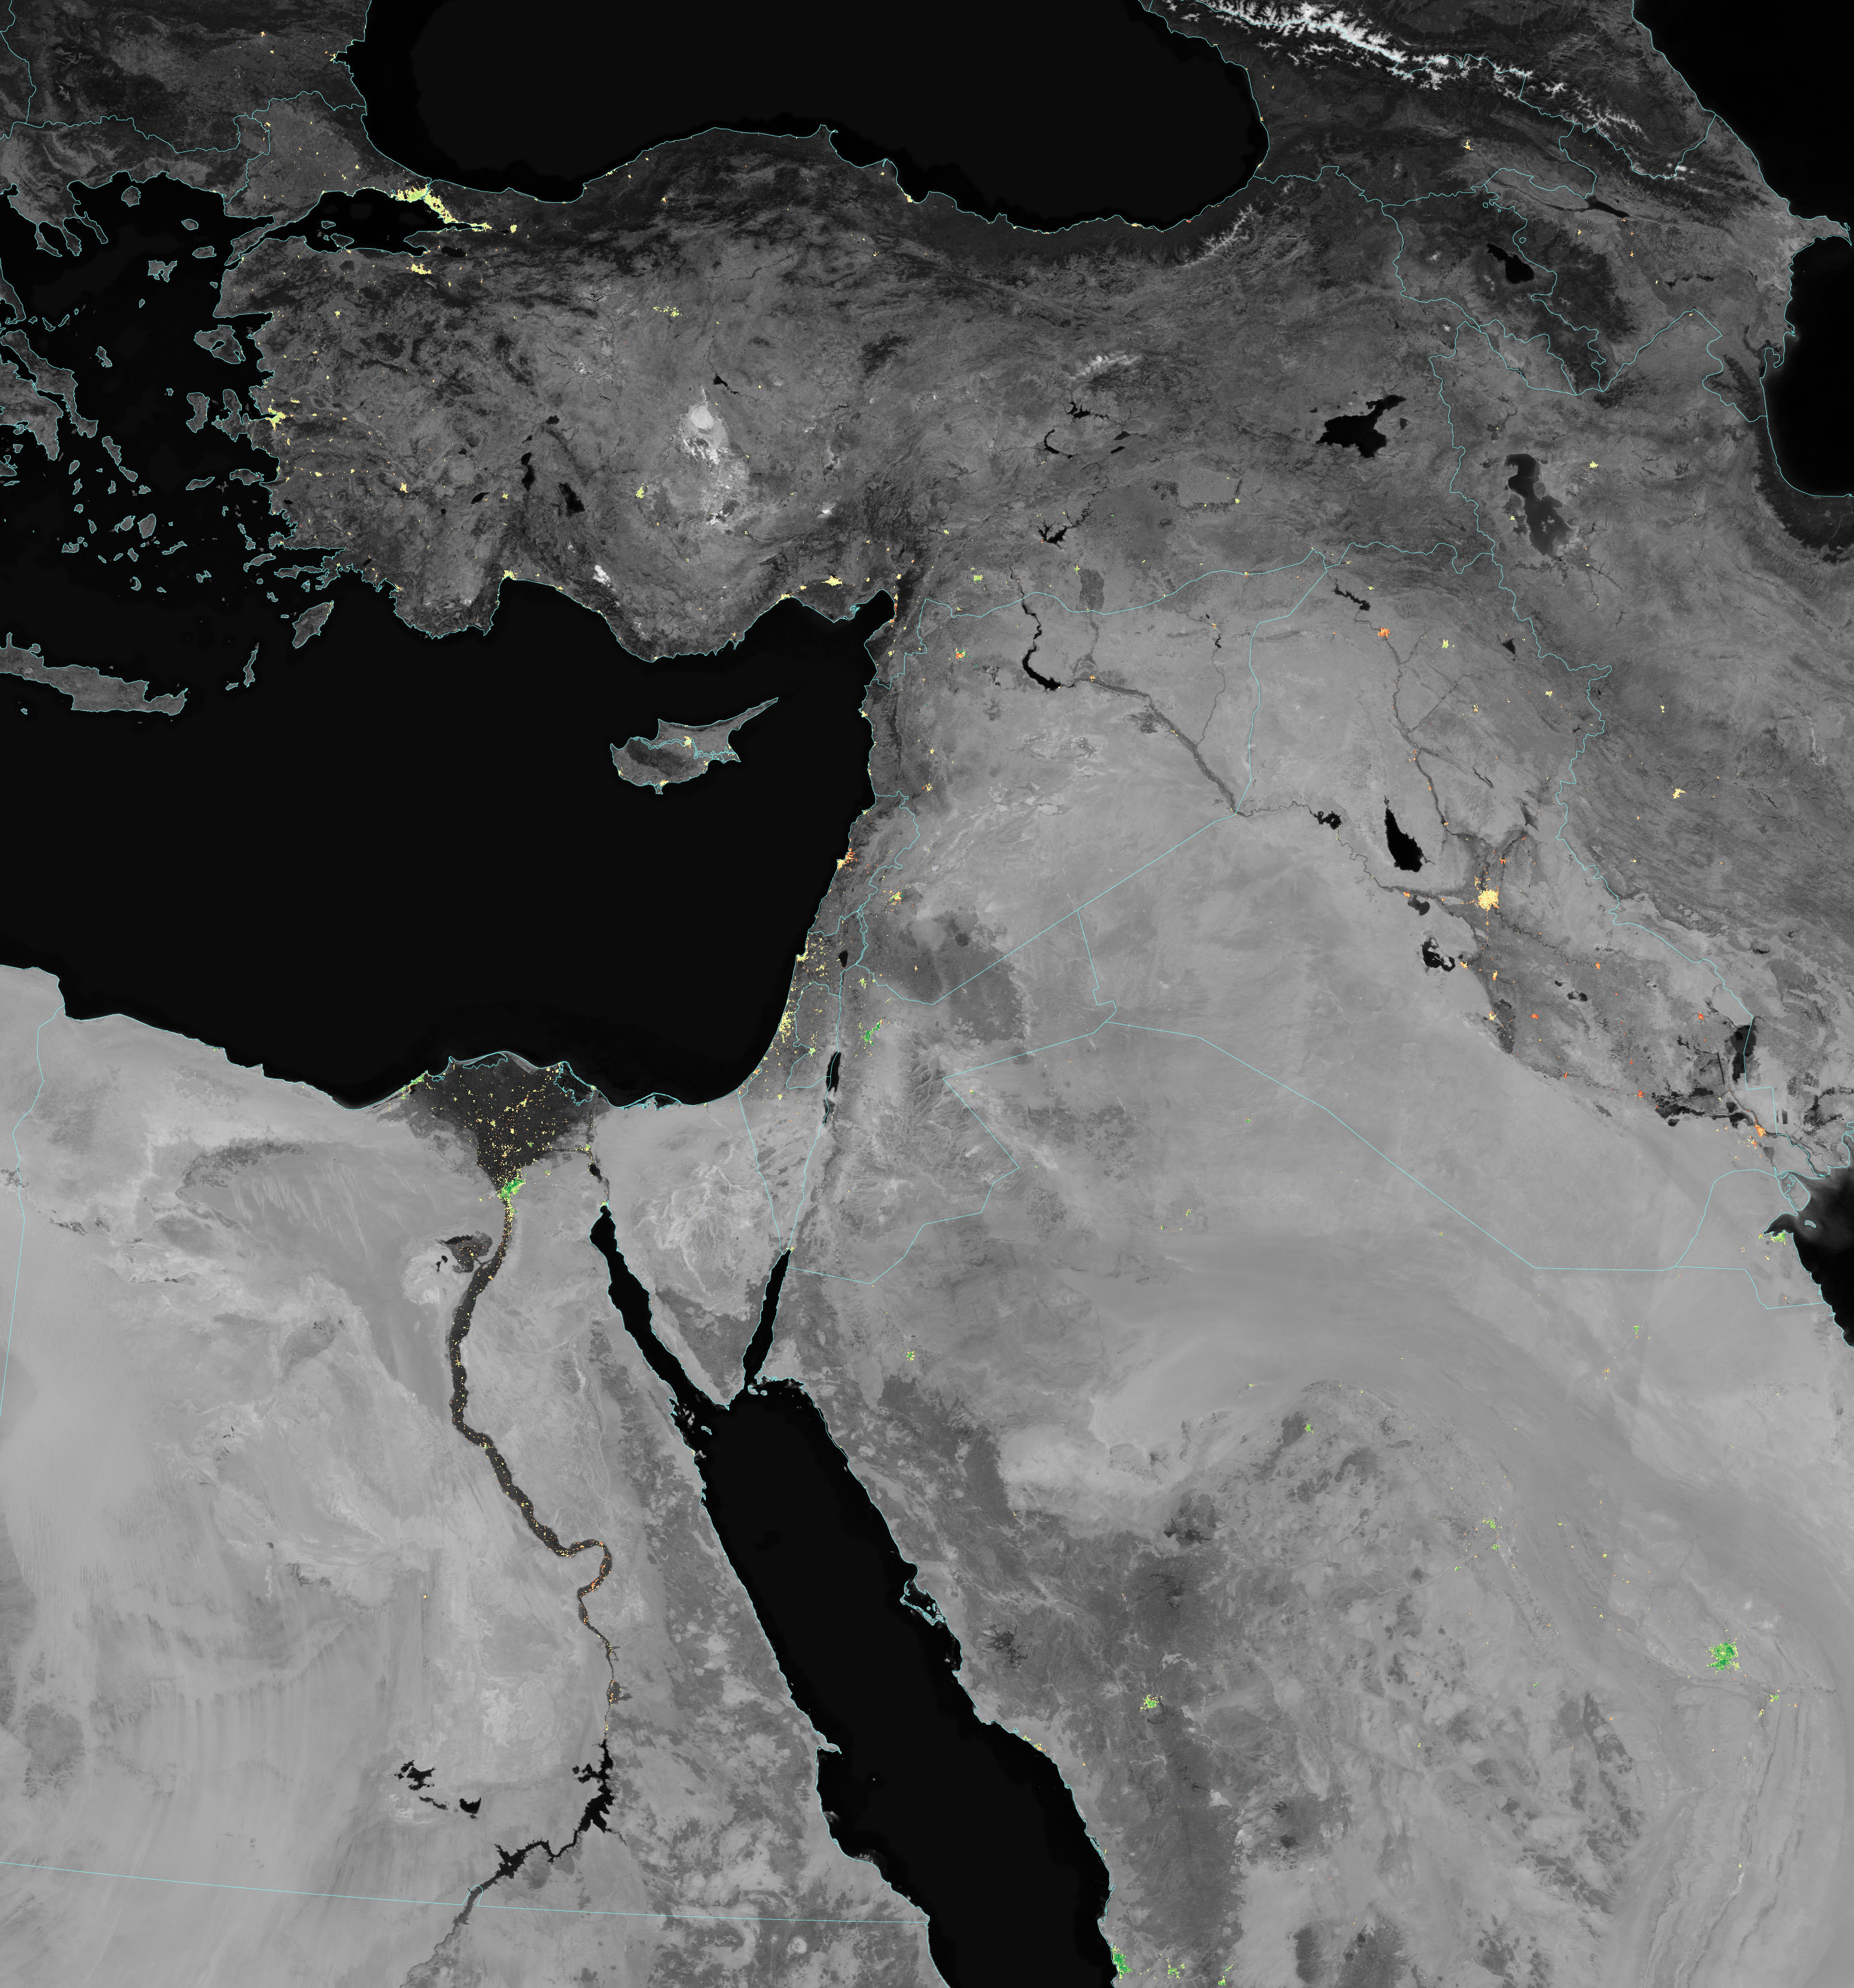
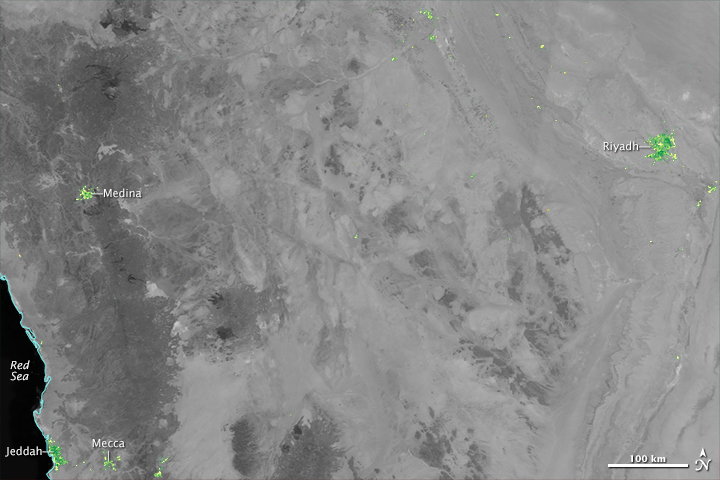
The maps on this page show changes in lighting intensity and location on the Arabian Peninsula and in the countries along the eastern Mediterranean coast. They are based on data from the Visible Infrared Imaging Radiometer Suite (VIIRS) on the Suomi NPP satellite. The maps compare the night light signals from the months of Ramadan in 2012–2014 (parts of July and August in these years) to the average light output for the rest of 2012 to 2014. Green shading marks areas where light usage increased during the holy days; yellow marks areas with little change; and red marks areas where less light was used.
The VIIRS instrument on Suomi NPP can observe faint light signals on the night side of our planet, including reflected moonlight, airglow, auroras, and manmade light sources. In 2012, scientists assembled a new composite map of Earth at night created from averaged data from 22 nights of VIIRS data. The new 2014 analysis of holiday lights uses a new algorithm that filters out moonlight, clouds, and airborne particles to show city lights on a nightly basis.
The idea to examine holiday lights arose in 2012 out of an issue with some nighttime images of Cairo, Egypt. A science team led by Miguel Román of NASA’s Goddard Space Flight Center noticed a discrepancy in city light signals while performing quality checks on early mission data. The science team realized that there was either an error in the data or an unknown signal that they should study further.
After digging deeper, the team found that the large increase in light output around the Egyptian capital corresponded with the holy month of Ramadan. The change made sense because Muslims fast during daylight in Ramadan, pushing meals, social gatherings, commerce and other activities into nighttime hours. To confirm that the nighttime signal was not merely an instrument artifact, the team examined all of the nighttime data from spring 2012 through autumn 2014. They found that the peaks in light use closely tracked the Islamic calendar, as Ramadan shifted earlier in the summer each year.
Light use in Saudi Arabian cities, such as Riyadh and Jeddah, increased by 60 to 100 percent throughout the month of Ramadan. Light use in Turkish cities, however, increased far less. Some regions in Syria, Iraq, and Lebanon did not have an increase in light output—and some even demonstrated a moderate decrease, possibly due to unstable electrical grids and conflict in the region. Click on the large, downloadable map for a closer view of the differences.

“Even within majority Muslim populations, there are a lot of variations,” said Eleanor Stokes, a Yale researcher and collaborator with Román. “What we have seen is that these lighting patterns track cultural variation within the Middle East.”
These variations appear even at the neighborhood level. Román and Stokes compared night lights data from Cairo with socioeconomic data, voting patterns, access to public sanitation, and literacy rates. Some of the poorest and most devout areas observed Ramadan without significant increases in light use throughout the month, choosing—whether for cultural or financial reasons—to leave their lights off at night. But during the Eid al-Fitr celebration that marks of the end of Ramadan, light use soared across all study groups, as all the neighborhoods appeared to join in the festivities.
“Whether you are rich or poor, or religious or not, everybody in Egypt is celebrating Eid al-Fitr,” Román said. This is telling Stokes and Román that energy use patterns are reflecting social and cultural identities, as well as the habits of city dwellers, and not just price or other commercial factors.
NASA Earth Observatory images by Jesse Allen, using VIIRS day-night band data provided by Miguel Román (NASA/GSFC). Suomi NPP is the result of a partnership between NASA, the National Oceanic and Atmospheric Administration, and the Department of Defense. Caption by Kate Ramsayer and Mike Carlowicz.