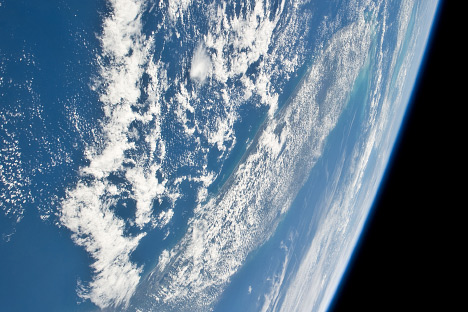
Throughout its long history, Earth has warmed and cooled time and again. Climate has changed when the planet received more or less sunlight due to subtle shifts in its orbit, as the atmosphere or surface changed, or when the Sun’s energy varied. But in the past century, another force has started to influence Earth’s climate: humanity.
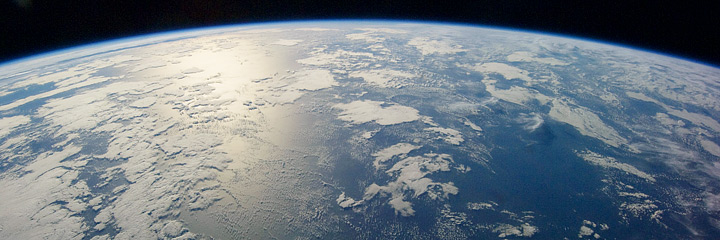
(NASA astronaut photograph ISS022-E-6674.)
Global warming is the unusually rapid increase in Earth’s average surface temperature over the past century primarily due to the greenhouse gases released by people burning fossil fuels.
Earth has experienced climate change in the past without help from humanity. But the current climatic warming is occurring much more rapidly than past warming events.
In Earth’s history before the Industrial Revolution, Earth’s climate changed due to natural causes unrelated to human activity. These natural causes are still in play today, but their influence is too small or they occur too slowly to explain the rapid warming seen in recent decades.
Models predict that as the world consumes ever more fossil fuel, greenhouse gas concentrations will continue to rise, and Earth’s average surface temperature will rise with them. Based on plausible emission scenarios, average surface temperatures could rise between 2°C and 6°C by the end of the 21st century. Some of this warming will occur even if future greenhouse gas emissions are reduced, because the Earth system has not yet fully adjusted to environmental changes we have already made.
The impact of global warming is far greater than just increasing temperatures. Warming modifies rainfall patterns, amplifies coastal erosion, lengthens the growing season in some regions, melts ice caps and glaciers, and alters the ranges of some infectious diseases. Some of these changes are already occurring.
Throughout its long history, Earth has warmed and cooled time and again. Climate has changed when the planet received more or less sunlight due to subtle shifts in its orbit, as the atmosphere or surface changed, or when the Sun’s energy varied. But in the past century, another force has started to influence Earth’s climate: humanity
How does this warming compare to previous changes in Earth’s climate? How can we be certain that human-released greenhouse gases are causing the warming? How much more will the Earth warm? How will Earth respond? Answering these questions is perhaps the most significant scientific challenge of our time.
Global warming is the unusually rapid increase in Earth’s average surface temperature over the past century primarily due to the greenhouse gases released as people burn fossil fuels. The global average surface temperature rose 0.6 to 0.9 degrees Celsius (1.1 to 1.6° F) between 1906 and 2005, and the rate of temperature increase has nearly doubled in the last 50 years. Temperatures are certain to go up further.
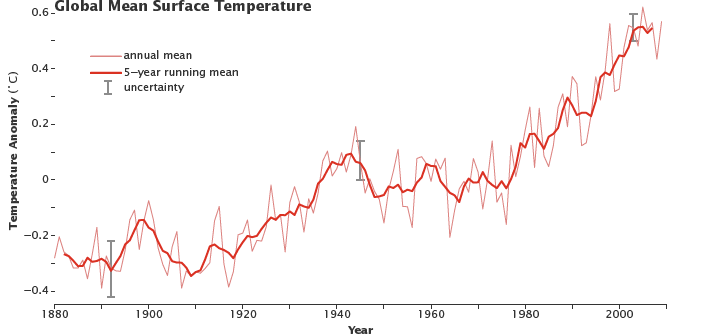
Despite ups and downs from year to year, global average surface temperature is rising. By the beginning of the 21st century, Earth’s temperature was roughly 0.5 degrees Celsius above the long-term (1951–1980) average. (NASA figure adapted from Goddard Institute for Space Studies Surface Temperature Analysis.)
Earth’s temperature begins with the Sun. Roughly 30 percent of incoming sunlight is reflected back into space by bright surfaces like clouds and ice. Of the remaining 70 percent, most is absorbed by the land and ocean, and the rest is absorbed by the atmosphere. The absorbed solar energy heats our planet.
As the rocks, the air, and the seas warm, they radiate “heat” energy (thermal infrared radiation). From the surface, this energy travels into the atmosphere where much of it is absorbed by water vapor and long-lived greenhouse gases such as carbon dioxide and methane.
When they absorb the energy radiating from Earth’s surface, microscopic water or greenhouse gas molecules turn into tiny heaters— like the bricks in a fireplace, they radiate heat even after the fire goes out. They radiate in all directions. The energy that radiates back toward Earth heats both the lower atmosphere and the surface, enhancing the heating they get from direct sunlight.
This absorption and radiation of heat by the atmosphere—the natural greenhouse effect—is beneficial for life on Earth. If there were no greenhouse effect, the Earth’s average surface temperature would be a very chilly -18°C (0°F) instead of the comfortable 15°C (59°F) that it is today.
See Climate and Earth’s Energy Budget to read more about how sunlight fuels Earth’s climate.
What has scientists concerned now is that over the past 250 years, humans have been artificially raising the concentration of greenhouse gases in the atmosphere at an ever-increasing rate, mostly by burning fossil fuels, but also from cutting down carbon-absorbing forests. Since the Industrial Revolution began in about 1750, carbon dioxide levels have increased nearly 38 percent as of 2009 and methane levels have increased 148 percent.
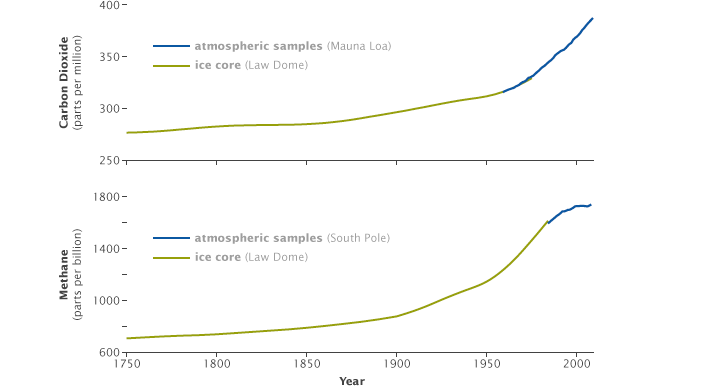
Increases in concentrations of carbon dioxide (top) and methane (bottom) coincided with the start of the Industrial Revolution in about 1750. Measurements from Antarctic ice cores (green lines) combined with direct atmospheric measurements (blue lines) show the increase of both gases over time. (NASA graphs by Robert Simmon, based on data from the NOAA Paleoclimatology and Earth System Research Laboratory.)
The atmosphere today contains more greenhouse gas molecules, so more of the infrared energy emitted by the surface ends up being absorbed by the atmosphere. Since some of the extra energy from a warmer atmosphere radiates back down to the surface, Earth’s surface temperature rises. By increasing the concentration of greenhouse gases, we are making Earth’s atmosphere a more efficient greenhouse.
Earth has experienced climate change in the past without help from humanity. We know about past climates because of evidence left in tree rings, layers of ice in glaciers, ocean sediments, coral reefs, and layers of sedimentary rocks. For example, bubbles of air in glacial ice trap tiny samples of Earth’s atmosphere, giving scientists a history of greenhouse gases that stretches back more than 800,000 years. The chemical make-up of the ice provides clues to the average global temperature.
See the Earth Observatory’s series Paleoclimatology for details about how scientists study past climates.

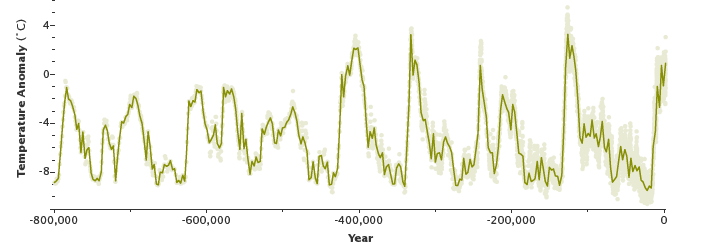
Glacial ice and air bubbles trapped in it (top) preserve an 800,000-year record of temperature & carbon dioxide. Earth has cycled between ice ages (low points, large negative anomalies) and warm interglacials (peaks). (Photograph courtesy National Snow & Ice Data Center. NASA graph by Robert Simmon, based on data from Jouzel et al., 2007.)
Using this ancient evidence, scientists have built a record of Earth’s past climates, or “paleoclimates.” The paleoclimate record combined with global models shows past ice ages as well as periods even warmer than today. But the paleoclimate record also reveals that the current climatic warming is occurring much more rapidly than past warming events.
As the Earth moved out of ice ages over the past million years, the global temperature rose a total of 4 to 7 degrees Celsius over about 5,000 years. In the past century alone, the temperature has climbed 0.7 degrees Celsius, roughly ten times faster than the average rate of ice-age-recovery warming.
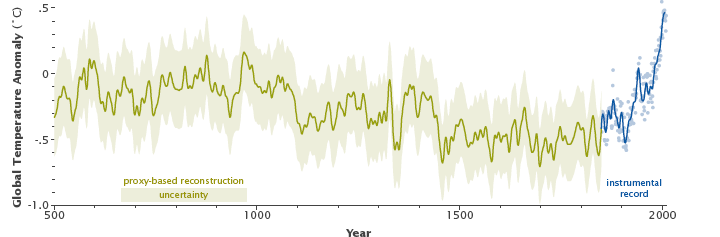
Temperature histories from paleoclimate data (green line) compared to the history based on modern instruments (blue line) suggest that global temperature is warmer now than it has been in the past 1,000 years, and possibly longer. (Graph adapted from Mann et al., 2008.)
Models predict that Earth will warm between 2 and 6 degrees Celsius in the next century. When global warming has happened at various times in the past two million years, it has taken the planet about 5,000 years to warm 5 degrees. The predicted rate of warming for the next century is at least 20 times faster. This rate of change is extremely unusual.
In Earth’s history before the Industrial Revolution, Earth’s climate changed due to natural causes not related to human activity. Most often, global climate has changed because of variations in sunlight. Tiny wobbles in Earth’s orbit altered when and where sunlight falls on Earth’s surface. Variations in the Sun itself have alternately increased and decreased the amount of solar energy reaching Earth. Volcanic eruptions have generated particles that reflect sunlight, brightening the planet and cooling the climate. Volcanic activity has also, in the deep past, increased greenhouse gases over millions of years, contributing to episodes of global warming.
A biographical sketch of Milutin Milankovitch describes how changes in Earth’s orbit affects its climate.
These natural causes are still in play today, but their influence is too small or they occur too slowly to explain the rapid warming seen in recent decades. We know this because scientists closely monitor the natural and human activities that influence climate with a fleet of satellites and surface instruments.
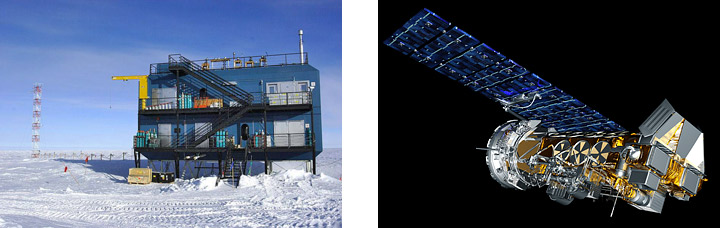
Remote meteorological stations (left) and orbiting satellites (right) help scientists monitor the causes and effects of global warming. [Images courtesy NOAA Network for the Detection of Atmospheric Composition Change (left) and Environmental Visualization Laboratory (right).]
NASA satellites record a host of vital signs including atmospheric aerosols (particles from both natural sources and human activities, such as factories, fires, deserts, and erupting volcanoes), atmospheric gases (including greenhouse gases), energy radiated from Earth’s surface and the Sun, ocean surface temperature changes, global sea level, the extent of ice sheets, glaciers and sea ice, plant growth, rainfall, cloud structure, and more.
On the ground, many agencies and nations support networks of weather and climate-monitoring stations that maintain temperature, rainfall, and snow depth records, and buoys that measure surface water and deep ocean temperatures. Taken together, these measurements provide an ever-improving record of both natural events and human activity for the past 150 years.
Scientists integrate these measurements into climate models to recreate temperatures recorded over the past 150 years. Climate model simulations that consider only natural solar variability and volcanic aerosols since 1750—omitting observed increases in greenhouse gases—are able to fit the observations of global temperatures only up until about 1950. After that point, the decadal trend in global surface warming cannot be explained without including the contribution of the greenhouse gases added by humans.
Though people have had the largest impact on our climate since 1950, natural changes to Earth’s climate have also occurred in recent times. For example, two major volcanic eruptions, El Chichon in 1982 and Pinatubo in 1991, pumped sulfur dioxide gas high into the atmosphere. The gas was converted into tiny particles that lingered for more than a year, reflecting sunlight and shading Earth’s surface. Temperatures across the globe dipped for two to three years.
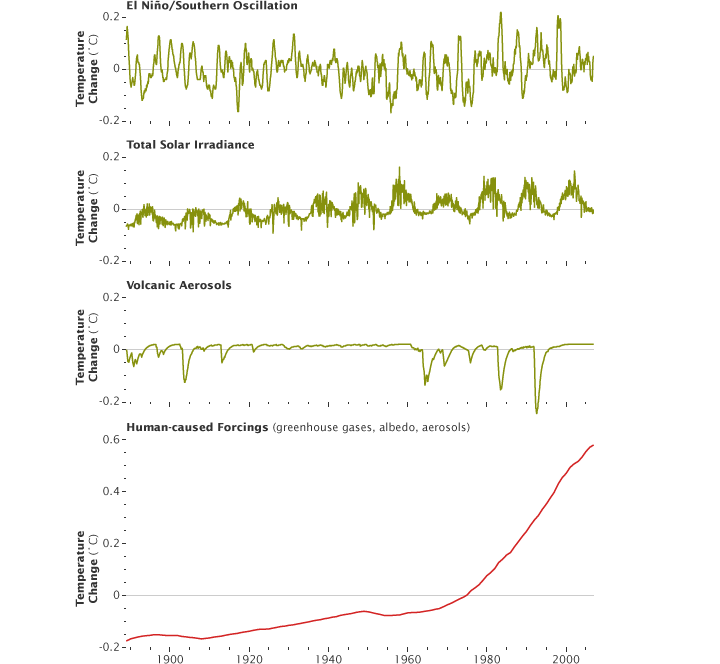
Although Earth’s temperature fluctuates naturally, human influence on climate has eclipsed the magnitude of natural temperature changes over the past 120 years. Natural influences on temperature—El Niño, solar variability, and volcanic aerosols—have varied approximately plus and minus 0.2° C (0.4° F), (averaging to about zero), while human influences have contributed roughly 0.8° C (1° F) of warming since 1889. (Graphs adapted from Lean et al., 2008.)
Although volcanoes are active around the world, and continue to emit carbon dioxide as they did in the past, the amount of carbon dioxide they release is extremely small compared to human emissions. On average, volcanoes emit between 130 and 230 million tonnes of carbon dioxide per year. By burning fossil fuels, people release in excess of 100 times more, about 26 billion tonnes of carbon dioxide, into the atmosphere every year (as of 2005). As a result, human activity overshadows any contribution volcanoes may have made to recent global warming.
Changes in the brightness of the Sun can influence the climate from decade to decade, but an increase in solar output falls short as an explanation for recent warming. NASA satellites have been measuring the Sun’s output since 1978. The total energy the Sun radiates varies over an 11-year cycle. During solar maxima, solar energy is approximately 0.1 percent higher on average than it is during solar minima.
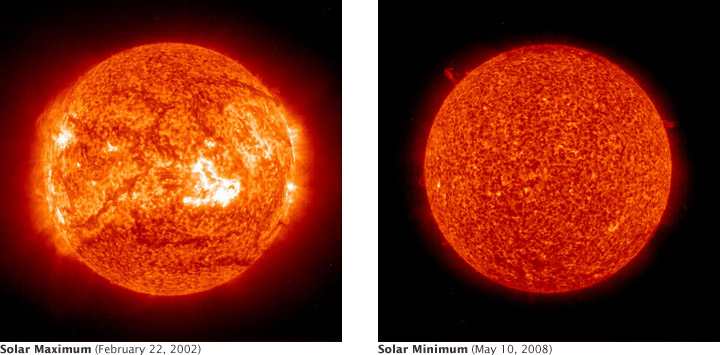
The transparent halo known as the solar corona changes between solar maximum (left) and solar minimum (right). (NASA Extreme Ultraviolet Telescope images from the SOHO Data Archive.)
Each cycle exhibits subtle differences in intensity and duration. As of early 2010, the solar brightness since 2005 has been slightly lower, not higher, than it was during the previous 11-year minimum in solar activity, which occurred in the late 1990s. This implies that the Sun’s impact between 2005 and 2010 might have been to slightly decrease the warming that greenhouse emissions alone would have caused.
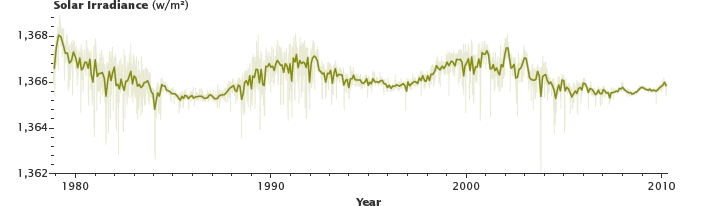
Satellite measurements of daily (light line) and monthly average (dark line) total solar irradiance since 1979 have not detected a clear long-term trend. (NASA graph by Robert Simmon, based on data from the ACRIM Science Team.)
Scientists theorize that there may be a multi-decadal trend in solar output, though if one exists, it has not been observed as yet. Even if the Sun were getting brighter, however, the pattern of warming observed on Earth since 1950 does not match the type of warming the Sun alone would cause. When the Sun’s energy is at its peak (solar maxima), temperatures in both the lower atmosphere (troposphere) and the upper atmosphere (stratosphere) become warmer. Instead, observations show the pattern expected from greenhouse gas effects: Earth’s surface and troposphere have warmed, but the stratosphere has cooled.
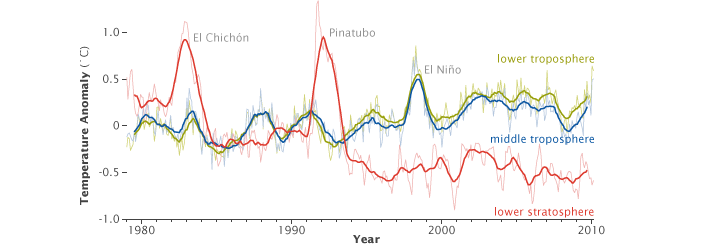
Satellite measurements show warming in the troposphere (lower atmosphere, green line) but cooling in the stratosphere (upper atmosphere, red line). This vertical pattern is consistent with global warming due to increasing greenhouse gases, but inconsistent with warming from natural causes. (Graph by Robert Simmon, based on data from Remote Sensing Systems, sponsored by the NOAA Climate and Global Change Program.)
The stratosphere gets warmer during solar maxima because the ozone layer absorbs ultraviolet light; more ultraviolet light during solar maxima means warmer temperatures. Ozone depletion explains the biggest part of the cooling of the stratosphere over recent decades, but it can’t account for all of it. Increased concentrations of carbon dioxide in the troposphere and stratosphere together contribute to cooling in the stratosphere.
To further explore the causes and effects of global warming and to predict future warming, scientists build climate models—computer simulations of the climate system. Climate models are designed to simulate the responses and interactions of the oceans and atmosphere, and to account for changes to the land surface, both natural and human-induced. They comply with fundamental laws of physics—conservation of energy, mass, and momentum—and account for dozens of factors that influence Earth’s climate.
Though the models are complicated, rigorous tests with real-world data hone them into powerful tools that allow scientists to explore our understanding of climate in ways not otherwise possible. By experimenting with the models—removing greenhouse gases emitted by the burning of fossil fuels or changing the intensity of the Sun to see how each influences the climate—scientists use the models to better understand Earth’s current climate and to predict future climate.
The models predict that as the world consumes ever more fossil fuel, greenhouse gas concentrations will continue to rise, and Earth’s average surface temperature will rise with them. Based on a range of plausible emission scenarios, average surface temperatures could rise between 2°C and 6°C by the end of the 21st century.
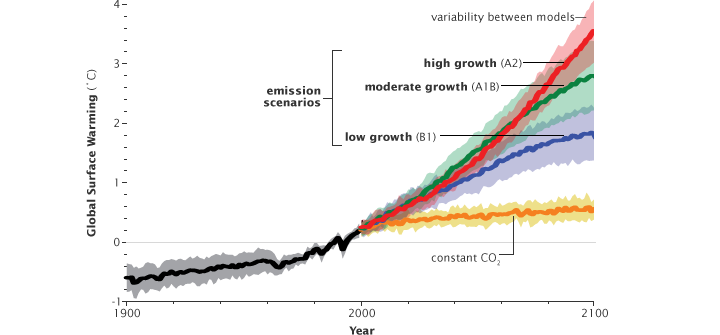
Model simulations by the Intergovernmental Panel on Climate Change estimate that Earth will warm between two and six degrees Celsius over the next century, depending on how fast carbon dioxide emissions grow. Scenarios that assume that people will burn more and more fossil fuel provide the estimates in the top end of the temperature range, while scenarios that assume that greenhouse gas emissions will grow slowly give lower temperature predictions. The orange line provides an estimate of global temperatures if greenhouse gases stayed at year 2000 levels. (©2007 IPCC WG1 AR-4.)
Greenhouse gases are only part of the story when it comes to global warming. Changes to one part of the climate system can cause additional changes to the way the planet absorbs or reflects energy. These secondary changes are called climate feedbacks, and they could more than double the amount of warming caused by carbon dioxide alone. The primary feedbacks are due to snow and ice, water vapor, clouds, and the carbon cycle.
Perhaps the most well known feedback comes from melting snow and ice in the Northern Hemisphere. Warming temperatures are already melting a growing percentage of Arctic sea ice, exposing dark ocean water during the perpetual sunlight of summer. Snow cover on land is also dwindling in many areas. In the absence of snow and ice, these areas go from having bright, sunlight-reflecting surfaces that cool the planet to having dark, sunlight-absorbing surfaces that bring more energy into the Earth system and cause more warming.
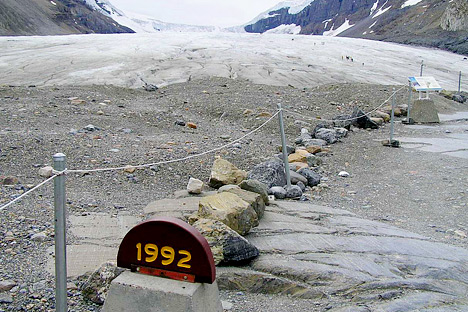
Canada’s Athabasca Glacier has been shrinking by about 15 meters per year. In the past 125 years, the glacier has lost half its volume and has retreated more than 1.5 kilometers. As glaciers retreat, sea ice disappears, and snow melts earlier in the spring, the Earth absorbs more sunlight than it would if the reflective snow and ice remained. (Photograph ©2005 Hugh Saxby.)
The largest feedback is water vapor. Water vapor is a strong greenhouse gas. In fact, because of its abundance in the atmosphere, water vapor causes about two-thirds of greenhouse warming, a key factor in keeping temperatures in the habitable range on Earth. But as temperatures warm, more water vapor evaporates from the surface into the atmosphere, where it can cause temperatures to climb further.
The question that scientists ask is, how much water vapor will be in the atmosphere in a warming world? The atmosphere currently has an average equilibrium or balance between water vapor concentration and temperature. As temperatures warm, the atmosphere becomes capable of containing more water vapor, and so water vapor concentrations go up to regain equilibrium. Will that trend hold as temperatures continue to warm?
The amount of water vapor that enters the atmosphere ultimately determines how much additional warming will occur due to the water vapor feedback. The atmosphere responds quickly to the water vapor feedback. So far, most of the atmosphere has maintained a near constant balance between temperature and water vapor concentration as temperatures have gone up in recent decades. If this trend continues, and many models say that it will, water vapor has the capacity to double the warming caused by carbon dioxide alone.
Closely related to the water vapor feedback is the cloud feedback. Clouds cause cooling by reflecting solar energy, but they also cause warming by absorbing infrared energy (like greenhouse gases) from the surface when they are over areas that are warmer than they are. In our current climate, clouds have a cooling effect overall, but that could change in a warmer environment.
Clouds can both cool the planet (by reflecting visible light from the sun) and warm the planet (by absorbing heat radiation emitted by the surface). On balance, clouds slightly cool the Earth. (NASA Astronaut Photograph STS31-E-9552 courtesy Johnson space Center Earth Observations Lab.)
If clouds become brighter, or the geographical extent of bright clouds expands, they will tend to cool Earth’s surface. Clouds can become brighter if more moisture converges in a particular region or if more fine particles (aerosols) enter the air. If fewer bright clouds form, it will contribute to warming from the cloud feedback.
See Ship Tracks South of Alaska to learn how aerosols can make clouds brighter.
Clouds, like greenhouse gases, also absorb and re-emit infrared energy. Low, warm clouds emit more energy than high, cold clouds. However, in many parts of the world, energy emitted by low clouds can be absorbed by the abundant water vapor above them. Further, low clouds often have nearly the same temperatures as the Earth’s surface, and so emit similar amounts of infrared energy. In a world without low clouds, the amount of emitted infrared energy escaping to space would not be too different from a world with low clouds.
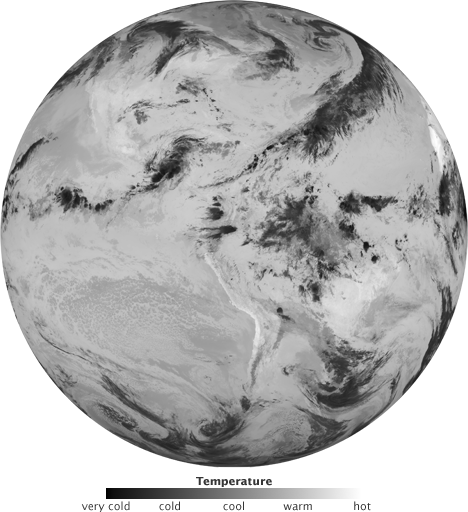
Clouds emit thermal infrared (heat) radiation in proportion to their temperature, which is related to altitude. This image shows the Western Hemisphere in the thermal infrared. Warm ocean and land surface areas are white and light gray; cool, low-level clouds are medium gray; and cold, high-altitude clouds are dark gray and black. (NASA image courtesy GOES Project Science.)
High cold clouds, however, form in a part of the atmosphere where energy-absorbing water vapor is scarce. These clouds trap (absorb) energy coming from the lower atmosphere, and emit little energy to space because of their frigid temperatures. In a world with high clouds, a significant amount of energy that would otherwise escape to space is captured in the atmosphere. As a result, global temperatures are higher than in a world without high clouds.
If warmer temperatures result in a greater amount of high clouds, then less infrared energy will be emitted to space. In other words, more high clouds would enhance the greenhouse effect, reducing the Earth’s capability to cool and causing temperatures to warm.
See Clouds and Radiation for a more complete description.
Scientists aren’t entirely sure where and to what degree clouds will end up amplifying or moderating warming, but most climate models predict a slight overall positive feedback or amplification of warming due to a reduction in low cloud cover. A recent observational study found that fewer low, dense clouds formed over a region in the Pacific Ocean when temperatures warmed, suggesting a positive cloud feedback in this region as the models predicted. Such direct observational evidence is limited, however, and clouds remain the biggest source of uncertainty--apart from human choices to control greenhouse gases—in predicting how much the climate will change.
Increased atmospheric carbon dioxide concentrations and warming temperatures are causing changes in the Earth’s natural carbon cycle that also can feedback on atmospheric carbon dioxide concentration. For now, primarily ocean water, and to some extent ecosystems on land, are taking up about half of our fossil fuel and biomass burning emissions. This behavior slows global warming by decreasing the rate of atmospheric carbon dioxide increase, but that trend may not continue. Warmer ocean waters will hold less dissolved carbon, leaving more in the atmosphere.
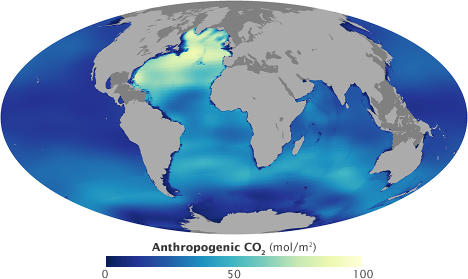
About half the carbon dioxide emitted into the air from burning fossil fuels dissolves in the ocean. This map shows the total amount of human-made carbon dioxide in ocean water from the surface to the sea floor. Blue areas have low amounts, while yellow regions are rich in anthropogenic carbon dioxide. High amounts occur where currents carry the carbon-dioxide-rich surface water into the ocean depths. (Map adapted from Sabine et al., 2004.)
See The Ocean’s Carbon Balance on the Earth Observatory.
On land, changes in the carbon cycle are more complicated. Under a warmer climate, soils, especially thawing Arctic tundra, could release trapped carbon dioxide or methane to the atmosphere. Increased fire frequency and insect infestations also release more carbon as trees burn or die and decay.
On the other hand, extra carbon dioxide can stimulate plant growth in some ecosystems, allowing these plants to take additional carbon out of the atmosphere. However, this effect may be reduced when plant growth is limited by water, nitrogen, and temperature. This effect may also diminish as carbon dioxide increases to levels that become saturating for photosynthesis. Because of these complications, it is not clear how much additional carbon dioxide plants can take out of the atmosphere and how long they could continue to do so.
The impact of climate change on the land carbon cycle is extremely complex, but on balance, land carbon sinks will become less efficient as plants reach saturation, where they can no longer take up additional carbon dioxide, and other limitations on growth occur, and as land starts to add more carbon to the atmosphere from warming soil, fires, and insect infestations. This will result in a faster increase in atmospheric carbon dioxide and more rapid global warming. In some climate models, carbon cycle feedbacks from both land and ocean add more than a degree Celsius to global temperatures by 2100.
Scientists predict the range of likely temperature increase by running many possible future scenarios through climate models. Although some of the uncertainty in climate forecasts comes from imperfect knowledge of climate feedbacks, the most significant source of uncertainty in these predictions is that scientists don’t know what choices people will make to control greenhouse gas emissions.
The higher estimates are made on the assumption that the entire world will continue using more and more fossil fuel per capita, a scenario scientists call “business-as-usual.” More modest estimates come from scenarios in which environmentally friendly technologies such as fuel cells, solar panels, and wind energy replace much of today’s fossil fuel combustion.
It takes decades to centuries for Earth to fully react to increases in greenhouse gases. Carbon dioxide, among other greenhouse gases, will remain in the atmosphere long after emissions are reduced, contributing to continuing warming. In addition, as Earth has warmed, much of the excess energy has gone into heating the upper layers of the ocean. Like a hot water bottle on a cold night, the heated ocean will continue warming the lower atmosphere well after greenhouse gases have stopped increasing.
These considerations mean that people won’t immediately see the impact of reduced greenhouse gas emissions. Even if greenhouse gas concentrations stabilized today, the planet would continue to warm by about 0.6°C over the next century because of greenhouses gases already in the atmosphere.
See Earth’s Big Heat Bucket, Correcting Ocean Cooling, and Climate Q&A: If we immediately stopped emitting greenhouse gases, would global warming stop? to learn more about the ocean heat and global warming.
The impact of increased surface temperatures is significant in itself. But global warming will have additional, far-reaching effects on the planet. Warming modifies rainfall patterns, amplifies coastal erosion, lengthens the growing season in some regions, melts ice caps and glaciers, and alters the ranges of some infectious diseases. Some of these changes are already occurring.

Global warming will shift major climate patterns, possibly prolonging and intensifying the current drought in the U.S. Southwest. The white ring of bleached rock on the once-red cliffs that hold Lake Powell indicate the drop in water level over the past decade—the result of repeated winters with low snowfall. (Photograph ©2006 Tigresblanco.)
For most places, global warming will result in more frequent hot days and fewer cool days, with the greatest warming occurring over land. Longer, more intense heat waves will become more common. Storms, floods, and droughts will generally be more severe as precipitation patterns change. Hurricanes may increase in intensity due to warmer ocean surface temperatures.
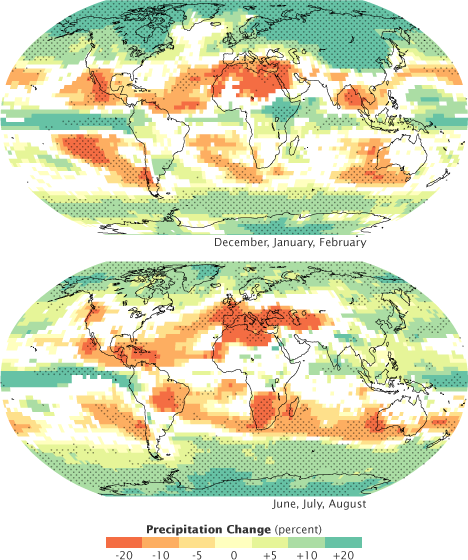
Apart from driving temperatures up, global warming is likely to cause bigger, more destructive storms, leading to an overall increase in precipitation. With some exceptions, the tropics will likely receive less rain (orange) as the planet warms, while the polar regions will receive more precipitation (green). White areas indicate that fewer than two-thirds of the climate models agreed on how precipitation will change. Stippled areas reveal where more than 90 percent of the models agreed. (©2007 IPCC WG1 AR-4.)
It is impossible to pin any single unusual weather event on global warming, but emerging evidence suggests that global warming is already influencing the weather. Heat waves, droughts, and intense rain events have increased in frequency during the last 50 years, and human-induced global warming more likely than not contributed to the trend.
The weather isn’t the only thing global warming will impact: rising sea levels will erode coasts and cause more frequent coastal flooding. Some island nations will disappear. The problem is serious because up to 10 percent of the world’s population lives in vulnerable areas less than 10 meters (about 30 feet) above sea level.
Between 1870 and 2000, the sea level increased by 1.7 millimeters per year on average, for a total sea level rise of 221 millimeters (0.7 feet or 8.7 inches). And the rate of sea level rise is accelerating. Since 1993, NASA satellites have shown that sea levels are rising more quickly, about 3 millimeters per year, for a total sea level rise of 48 millimeters (0.16 feet or 1.89 inches) between 1993 and 2009.
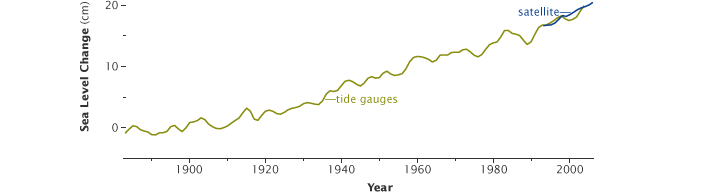
Sea levels crept up about 20 centimeters (7.9 inches) during the twentieth century. Sea levels are predicted to go up between 18 and 59 cm (7.1 and 23 inches) over the next century, though the increase could be greater if ice sheets in Greenland and Antarctica melt more quickly than predicted. Higher sea levels will erode coastlines and cause more frequent flooding. (Graph ©2007 Robert Rohde.)
The Intergovernmental Panel on Climate Change (IPCC) estimates that sea levels will rise between 0.18 and 0.59 meters (0.59 to 1.9 feet) by 2099 as warming sea water expands, and mountain and polar glaciers melt. These sea level change predictions may be underestimates, however, because they do not account for any increases in the rate at which the world’s major ice sheets are melting. As temperatures rise, ice will melt more quickly. Satellite measurements reveal that the Greenland and West Antarctic ice sheets are shedding about 125 billion tons of ice per year—enough to raise sea levels by 0.35 millimeters (0.01 inches) per year. If the melting accelerates, the increase in sea level could be significantly higher.
More importantly, perhaps, global warming is already putting pressure on ecosystems, the plants and animals that co-exist in a particular climate zone, both on land and in the ocean. Warmer temperatures have already shifted the growing season in many parts of the globe. The growing season in parts of the Northern Hemisphere became two weeks longer in the second half of the 20th century. Spring is coming earlier in both hemispheres.
This change in the growing season affects the broader ecosystem. Migrating animals have to start seeking food sources earlier. The shift in seasons may already be causing the lifecycles of pollinators, like bees, to be out of synch with flowering plants and trees. This mismatch can limit the ability of both pollinators and plants to survive and reproduce, which would reduce food availability throughout the food chain.
See Buzzing About Climate Change to read more about how the lifecycle of bees is synched with flowering plants.
Warmer temperatures also extend the growing season. This means that plants need more water to keep growing throughout the season or they will dry out, increasing the risk of failed crops and wildfires. Once the growing season ends, shorter, milder winters fail to kill dormant insects, increasing the risk of large, damaging infestations in subsequent seasons.
In some ecosystems, maximum daily temperatures might climb beyond the tolerance of indigenous plant or animal. To survive the extreme temperatures, both marine and land-based plants and animals have started to migrate towards the poles. Those species, and in some cases, entire ecosystems, that cannot quickly migrate or adapt, face extinction. The IPCC estimates that 20-30 percent of plant and animal species will be at risk of extinction if temperatures climb more than 1.5° to 2.5°C.
The changes to weather and ecosystems will also affect people more directly. Hardest hit will be those living in low-lying coastal areas, and residents of poorer countries who do not have the resources to adapt to changes in temperature extremes and water resources. As tropical temperature zones expand, the reach of some infectious diseases, such as malaria, will change. More intense rains and hurricanes and rising sea levels will lead to more severe flooding and potential loss of property and life.
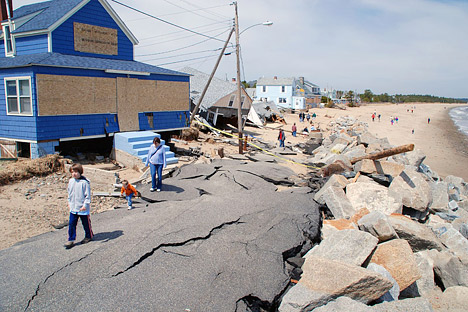
One inevitable consequence of global warming is sea-level rise. In the face of higher sea levels and more intense storms, coastal communities face greater risk of rapid beach erosion from destructive storms like the intense nor’easter of April 2007 that caused this damage. (Photograph ©2007 metimbers2000.)
Hotter summers and more frequent fires will lead to more cases of heat stroke and deaths, and to higher levels of near-surface ozone and smoke, which would cause more ‘code red’ air quality days. Intense droughts can lead to an increase in malnutrition. On a longer time scale, fresh water will become scarcer, especially during the summer, as mountain glaciers disappear, particularly in Asia and parts of North America.
On the flip side, there could be “winners” in a few places. For example, as long as the rise in global average temperature stays below 3 degrees Celsius, some models predict that global food production could increase because of the longer growing season at mid- to high-latitudes, provided adequate water resources are available. The same small change in temperature, however, would reduce food production at lower latitudes, where many countries already face food shortages. On balance, most research suggests that the negative impacts of a changing climate far outweigh the positive impacts. Current civilization—agriculture and population distribution—has developed based on the current climate. The more the climate changes, and the more rapidly it changes, the greater the cost of adaptation.
Ultimately, global warming will impact life on Earth in many ways, but the extent of the change is largely up to us. Scientists have shown that human emissions of greenhouse gases are pushing global temperatures up, and many aspects of climate are responding to the warming in the way that scientists predicted they would. This offers hope. Since people are causing global warming, people can mitigate global warming, if they act in time. Greenhouse gases are long-lived, so the planet will continue to warm and changes will continue to happen far into the future, but the degree to which global warming changes life on Earth depends on our decisions now.
