In 136 years of modern record-keeping, July 2016 was the warmest July according to a monthly analysis of global temperatures by scientists at NASA's Goddard Institute for Space Studies (GISS).
Because the seasonal temperature cycle peaks in July, that means July 2016 also was warmer than any other month on record. July 2016 was a statistically small 0.1 degrees Celsius warmer than the previous record Julys in 2015, 2011, and 2009.
“It wasn’t by the widest of margins, but July 2016 was the warmest month since modern record-keeping began in 1880,” said GISS Director Gavin Schmidt. “It appears almost a certainty that 2016 also will be the warmest year on record.”
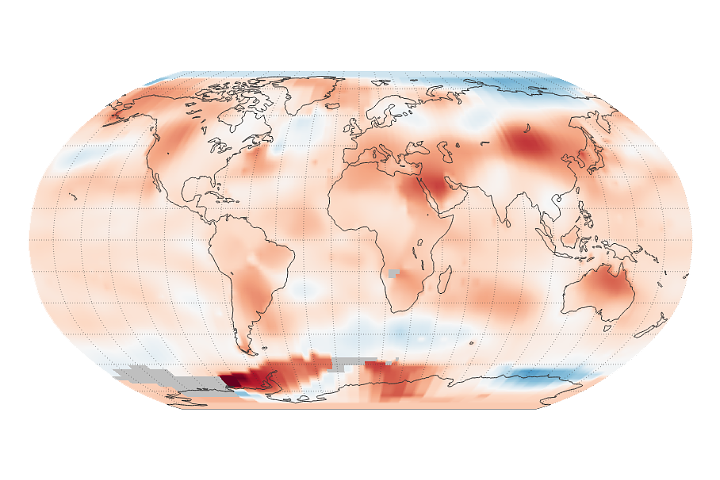
The map above depicts global temperature anomalies for July 2016. It does not represent absolute temperatures; instead it shows how much warmer or cooler the Earth was compared to the baseline average from 1951 to 1980. Note that the strongest reds are as much as 7 degrees Celsius (13 degrees Fahrenheit) above the monthly mean.
The record-warm July continued a streak of ten consecutive months (since October 2015) that have set new monthly high-temperature records. Compared to previous years, the warmer global temperatures last month were most pronounced in the northern hemisphere, particularly near the Arctic.
The long-term warming trend has been driven by rising concentrations of heat-trapping carbon dioxide and other greenhouse gases in the atmosphere. “While the El Niño event in the tropical Pacific this winter gave a boost to global temperatures from October onwards,” Schmidt said, “it is the underlying trend which is producing these record numbers.”
The animated figure above shows global temperature anomalies for every month since 1880, a result of the Modern-Era Retrospective analysis for Research and Applications, version 2 (MERRA-2) model run by NASA’s Global Modeling and Assimilation Office. Each line shows how much the global monthly temperature was above or below the annual global mean from 1980–2015. Note how monthly temperature anomalies rise over the 136-year record.
The GISS team assembles its temperature analysis from publicly available data acquired by roughly 6,300 meteorological stations around the world; by ship- and buoy-based instruments measuring sea surface temperature; and by Antarctic research stations. This raw data is analyzed using methods that account for the varied spacing of temperature stations around the globe and for urban heating effects that could skew the calculations. There are sufficient observations from about 1880 (particularly in the southern hemisphere) to produce a reasonably precise global temperature record. Prior to that, uncertainties (due to gaps in spatial coverage) increase substantially.
NASA Earth Observatory images by Joshua Stevens, based on data from the NASA Goddard Institute for Space Studies. Caption adapted by Mike Carlowicz from stories by Patrick Lynch, Leslie McCarthy, and Mike Cabbage.