
February 2016 was the warmest February in 136 years of modern temperature records. That month deviated more from normal than any month on record.
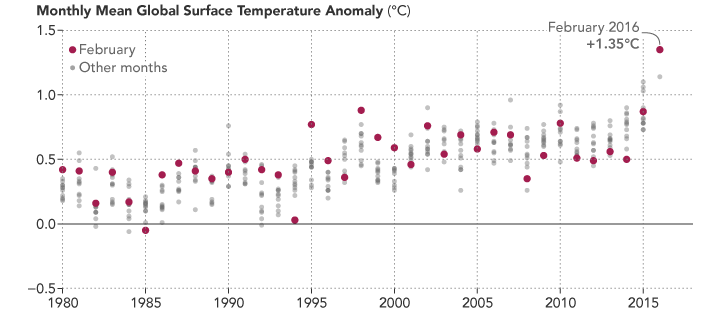
According to an ongoing temperature analysis conducted by scientists at NASA’s Goddard Institute for Space Studies (GISS), the average global temperature in February was about 0.5 degrees Celsius (0.8 degrees Fahrenheit) warmer than the previous record (February 1998). February 2016 was 1.35 degrees Celsius above the 1951–80 average; February 1998 was 0.88°C above it. Both records were set during strong El Niño events.
The map above depicts global temperature anomalies for February 2016. It does not show absolute temperatures; instead it shows how much warmer or cooler the Earth was compared to a baseline average from 1951 to 1980.
Almost all land surfaces on Earth experienced unusually warm temperatures in February 2016. The warmest temperatures occurred in Asia, North America, and the Arctic. Two of the exceptions were the Kamchatka Peninsula and a small portion of southeast Asia, which saw unusually cool temperatures. Note the clear fingerprint of El Niño in the equatorial Pacific Ocean.

The chart above plots the global temperature anomaly for each month of the year since 1980. Each February is highlighted with a red dot. All dots, red or gray, show how much global temperatures rose above or below the 1951–1980 average. Despite monthly variability, the long-term trend due to global warming is clear and now punctuated by the unusually warm data point for February 2016.
The GISS team assembles its temperature analysis from publicly available data acquired by roughly 6,300 meteorological stations around the world; by ship- and buoy-based instruments measuring sea surface temperature; and by Antarctic research stations. This raw data is analyzed using methods that account for the varied spacing of temperature stations around the globe and for urban heating effects that could skew the calculations. The modern global temperature record begins around 1880 because observations did not cover enough of the planet prior to that time.
For more explanation of how the analysis works, visit the GISS Surface Temperature F.A.Q. page.
NASA Earth Observatory images by Joshua Stevens, using data from the Goddard Institute for Space Studies. Caption by Adam Voiland.