

In the first half of June 2014, news accounts described an extreme heatwave in India, as well as the late and somewhat weak arrival of the seasonal monsoon. Air temperatures in New Delhi climbed as high as 48° Celsius (118° Fahrenheit) and stayed above 43°C (110°F) for seven days. Satellite data offer some insights on what was happening on the ground.
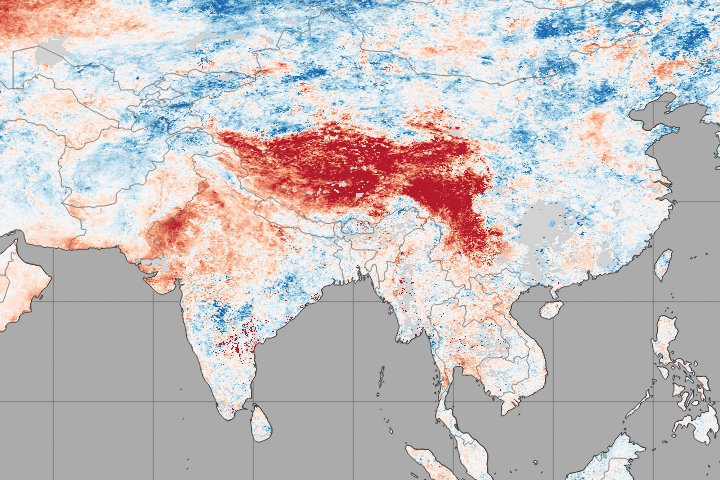
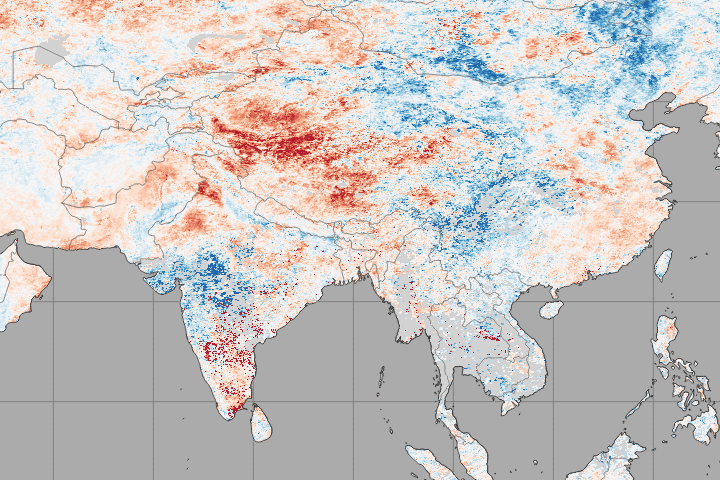
The maps above show land surface temperature (LST) anomalies for southern Asia from June 2–9 and June 10–17, 2014. LST anomalies are not absolute temperatures; instead, they show how much the land surface was heated above or below the average. The darkest reds show areas where the ground was as much as 12°C (22°F) above the norm from 2001–2010; blues show areas that were below normal; and grays depicts areas with incomplete data (usually due to excessive cloud cover).
The top map depicts extreme heating northwestern India, Tibet, and southern China in the first week of June; the temperature highs were less extreme in the June 10–17 period. (Turn on the image-comparison tool to see the changes over two weeks.) Yet neither map fully captures the heatwave that occurred in northern and central India because it overlapped two different weeks of data. Each map shows an average of eight days, so the extreme temperatures of individual days gets smoothed out by the average to cooler temperatures on other days in the period. The extremes around New Delhi also might not show up as brightly in this map because temperatures were about 5°C above the norm while other areas went as much as 12°C above.
But the map does reveal something else: the arrival of the monsoon. Note how much of central and western India is cooler in the second week; there are also several gray areas where cloudiness masked out measurements of the ground. Rainfall, cloud cover, and moist breezes from the Arabian Sea likely explain the change in land surface temperatures. India’s meteorological agency noted that the monsoon has arrived, but rainfall in the June to September period is expected to be weaker than normal.
Observed by satellites uniformly around the world, land surface temperatures are a measure of the amount of infrared energy (thermal radiance) emitted by Earth’s surface as it is heated by daylight and cooled in the dark of night. LSTs are sometimes referred to as land “skin” temperatures, and indeed they are a reflection of how hot a surface would feel to the touch. To learn more about LSTs, read Where is the Hottest Place on Earth? If you would like to view maps of surface temperatures for the rest of the world, click here.
NASA Earth Observatory image by Kevin Ward, using data from the Land Processes Distributed Active Archive Center (LPDAAC). Caption by Michael Carlowicz.