Land Surface Temperature Anomaly

Global Map Land Surface Temperature Anomaly Image 1 Global Map Land Surface Temperature Anomaly Image 2 Global Map Land Surface Temperature Anomaly Image 3 Global Map Land Surface Temperature Anomaly Image 4 Global Map Land Surface Temperature Anomaly Image 5 Global Map Land Surface Temperature Anomaly Image 6 Global Map Land Surface Temperature Anomaly Image 7 Global Map Land Surface Temperature Anomaly Image 8 Global Map Land Surface Temperature Anomaly Image 9 Global Map Land Surface Temperature Anomaly Image 10 Global Map Land Surface Temperature Anomaly Image 11 Global Map Land Surface Temperature Anomaly Image 12 Global Map Land Surface Temperature Anomaly Image 13 Global Map Land Surface Temperature Anomaly Image 14 Global Map Land Surface Temperature Anomaly Image 15 Global Map Land Surface Temperature Anomaly Image 16 Global Map Land Surface Temperature Anomaly Image 17 Global Map Land Surface Temperature Anomaly Image 18 Global Map Land Surface Temperature Anomaly Image 19 Global Map Land Surface Temperature Anomaly Image 20 Global Map Land Surface Temperature Anomaly Image 21 Global Map Land Surface Temperature Anomaly Image 22 Global Map Land Surface Temperature Anomaly Image 23 Global Map Land Surface Temperature Anomaly Image 24 Global Map Land Surface Temperature Anomaly Image 25 Global Map Land Surface Temperature Anomaly Image 26 Global Map Land Surface Temperature Anomaly Image 27 Global Map Land Surface Temperature Anomaly Image 28 Global Map Land Surface Temperature Anomaly Image 29 Global Map Land Surface Temperature Anomaly Image 30 Global Map Land Surface Temperature Anomaly Image 31 Global Map Land Surface Temperature Anomaly Image 32 Global Map Land Surface Temperature Anomaly Image 33 Global Map Land Surface Temperature Anomaly Image 34 Global Map Land Surface Temperature Anomaly Image 35 Global Map Land Surface Temperature Anomaly Image 36 Global Map Land Surface Temperature Anomaly Image 37 Global Map Land Surface Temperature Anomaly Image 38 Global Map Land Surface Temperature Anomaly Image 39 Global Map Land Surface Temperature Anomaly Image 40 Global Map Land Surface Temperature Anomaly Image 41 Global Map Land Surface Temperature Anomaly Image 42 Global Map Land Surface Temperature Anomaly Image 43 Global Map Land Surface Temperature Anomaly Image 44 Global Map Land Surface Temperature Anomaly Image 45 Global Map Land Surface Temperature Anomaly Image 46 Global Map Land Surface Temperature Anomaly Image 47 Global Map Land Surface Temperature Anomaly Image 48 Global Map Land Surface Temperature Anomaly Image 49 Global Map Land Surface Temperature Anomaly Image 50 Global Map Land Surface Temperature Anomaly Image 51 Global Map Land Surface Temperature Anomaly Image 52 Global Map Land Surface Temperature Anomaly Image 53 Global Map Land Surface Temperature Anomaly Image 54 Global Map Land Surface Temperature Anomaly Image 55 Global Map Land Surface Temperature Anomaly Image 56 Global Map Land Surface Temperature Anomaly Image 57 Global Map Land Surface Temperature Anomaly Image 58 Global Map Land Surface Temperature Anomaly Image 59 Global Map Land Surface Temperature Anomaly Image 60 Global Map Land Surface Temperature Anomaly Image 61 Global Map Land Surface Temperature Anomaly Image 62 Global Map Land Surface Temperature Anomaly Image 63 Global Map Land Surface Temperature Anomaly Image 64 Global Map Land Surface Temperature Anomaly Image 65 Global Map Land Surface Temperature Anomaly Image 66 Global Map Land Surface Temperature Anomaly Image 67 Global Map Land Surface Temperature Anomaly Image 68 Global Map Land Surface Temperature Anomaly Image 69 Global Map Land Surface Temperature Anomaly Image 70 Global Map Land Surface Temperature Anomaly Image 71 Global Map Land Surface Temperature Anomaly Image 72 Global Map Land Surface Temperature Anomaly Image 73 Global Map Land Surface Temperature Anomaly Image 74 Global Map Land Surface Temperature Anomaly Image 75 Global Map Land Surface Temperature Anomaly Image 76 Global Map Land Surface Temperature Anomaly Image 77 Global Map Land Surface Temperature Anomaly Image 78 Global Map Land Surface Temperature Anomaly Image 79 Global Map Land Surface Temperature Anomaly Image 80 Global Map Land Surface Temperature Anomaly Image 81 Global Map Land Surface Temperature Anomaly Image 82 Global Map Land Surface Temperature Anomaly Image 83 Global Map Land Surface Temperature Anomaly Image 84 Global Map Land Surface Temperature Anomaly Image 85 Global Map Land Surface Temperature Anomaly Image 86 Global Map Land Surface Temperature Anomaly Image 87 Global Map Land Surface Temperature Anomaly Image 88 Global Map Land Surface Temperature Anomaly Image 89 Global Map Land Surface Temperature Anomaly Image 90 Global Map Land Surface Temperature Anomaly Image 91 Global Map Land Surface Temperature Anomaly Image 92 Global Map Land Surface Temperature Anomaly Image 93 Global Map Land Surface Temperature Anomaly Image 94 Global Map Land Surface Temperature Anomaly Image 95 Global Map Land Surface Temperature Anomaly Image 96 Global Map Land Surface Temperature Anomaly Image 97 Global Map Land Surface Temperature Anomaly Image 98 Global Map Land Surface Temperature Anomaly Image 99 Global Map Land Surface Temperature Anomaly Image 100 Global Map Land Surface Temperature Anomaly Image 101 Global Map Land Surface Temperature Anomaly Image 102 Global Map Land Surface Temperature Anomaly Image 103 Global Map Land Surface Temperature Anomaly Image 104 Global Map Land Surface Temperature Anomaly Image 105 Global Map Land Surface Temperature Anomaly Image 106 Global Map Land Surface Temperature Anomaly Image 107 Global Map Land Surface Temperature Anomaly Image 108 Global Map Land Surface Temperature Anomaly Image 109 Global Map Land Surface Temperature Anomaly Image 110 Global Map Land Surface Temperature Anomaly Image 111 Global Map Land Surface Temperature Anomaly Image 112 Global Map Land Surface Temperature Anomaly Image 113 Global Map Land Surface Temperature Anomaly Image 114 Global Map Land Surface Temperature Anomaly Image 115 Global Map Land Surface Temperature Anomaly Image 116 Global Map Land Surface Temperature Anomaly Image 117 Global Map Land Surface Temperature Anomaly Image 118 Global Map Land Surface Temperature Anomaly Image 119 Global Map Land Surface Temperature Anomaly Image 120 Global Map Land Surface Temperature Anomaly Image 121 Global Map Land Surface Temperature Anomaly Image 122 Global Map Land Surface Temperature Anomaly Image 123 Global Map Land Surface Temperature Anomaly Image 124 Global Map Land Surface Temperature Anomaly Image 125 Global Map Land Surface Temperature Anomaly Image 126 Global Map Land Surface Temperature Anomaly Image 127 Global Map Land Surface Temperature Anomaly Image 128 Global Map Land Surface Temperature Anomaly Image 129 Global Map Land Surface Temperature Anomaly Image 130 Global Map Land Surface Temperature Anomaly Image 131 Global Map Land Surface Temperature Anomaly Image 132 Global Map Land Surface Temperature Anomaly Image 133 Global Map Land Surface Temperature Anomaly Image 134 Global Map Land Surface Temperature Anomaly Image 135 Global Map Land Surface Temperature Anomaly Image 136 Global Map Land Surface Temperature Anomaly Image 137 Global Map Land Surface Temperature Anomaly Image 138 Global Map Land Surface Temperature Anomaly Image 139 Global Map Land Surface Temperature Anomaly Image 140 Global Map Land Surface Temperature Anomaly Image 141 Global Map Land Surface Temperature Anomaly Image 142 Global Map Land Surface Temperature Anomaly Image 143 Global Map Land Surface Temperature Anomaly Image 144 Global Map Land Surface Temperature Anomaly Image 145 Global Map Land Surface Temperature Anomaly Image 146 Global Map Land Surface Temperature Anomaly Image 147 Global Map Land Surface Temperature Anomaly Image 148 Global Map Land Surface Temperature Anomaly Image 149 Global Map Land Surface Temperature Anomaly Image 150 Global Map Land Surface Temperature Anomaly Image 151 Global Map Land Surface Temperature Anomaly Image 152 Global Map Land Surface Temperature Anomaly Image 153 Global Map Land Surface Temperature Anomaly Image 154 Global Map Land Surface Temperature Anomaly Image 155 Global Map Land Surface Temperature Anomaly Image 156 Global Map Land Surface Temperature Anomaly Image 157 Global Map Land Surface Temperature Anomaly Image 158 Global Map Land Surface Temperature Anomaly Image 159 Global Map Land Surface Temperature Anomaly Image 160 Global Map Land Surface Temperature Anomaly Image 161 Global Map Land Surface Temperature Anomaly Image 162 Global Map Land Surface Temperature Anomaly Image 163 Global Map Land Surface Temperature Anomaly Image 164 Global Map Land Surface Temperature Anomaly Image 165 Global Map Land Surface Temperature Anomaly Image 166 Global Map Land Surface Temperature Anomaly Image 167 Global Map Land Surface Temperature Anomaly Image 168 Global Map Land Surface Temperature Anomaly Image 169 Global Map Land Surface Temperature Anomaly Image 170 Global Map Land Surface Temperature Anomaly Image 171 Global Map Land Surface Temperature Anomaly Image 172 Global Map Land Surface Temperature Anomaly Image 173 Global Map Land Surface Temperature Anomaly Image 174 Global Map Land Surface Temperature Anomaly Image 175 Global Map Land Surface Temperature Anomaly Image 176 Global Map Land Surface Temperature Anomaly Image 177 Global Map Land Surface Temperature Anomaly Image 178 Global Map Land Surface Temperature Anomaly Image 179 Global Map Land Surface Temperature Anomaly Image 180 Global Map Land Surface Temperature Anomaly Image 181 Global Map Land Surface Temperature Anomaly Image 182 Global Map Land Surface Temperature Anomaly Image 183 Global Map Land Surface Temperature Anomaly Image 184 Global Map Land Surface Temperature Anomaly Image 185 Global Map Land Surface Temperature Anomaly Image 186 Global Map Land Surface Temperature Anomaly Image 187 Global Map Land Surface Temperature Anomaly Image 188 Global Map Land Surface Temperature Anomaly Image 189 Global Map Land Surface Temperature Anomaly Image 190 Global Map Land Surface Temperature Anomaly Image 191 Global Map Land Surface Temperature Anomaly Image 192 Global Map Land Surface Temperature Anomaly Image 193 Global Map Land Surface Temperature Anomaly Image 194 Global Map Land Surface Temperature Anomaly Image 195 Global Map Land Surface Temperature Anomaly Image 196 Global Map Land Surface Temperature Anomaly Image 197 Global Map Land Surface Temperature Anomaly Image 198 Global Map Land Surface Temperature Anomaly Image 199 Global Map Land Surface Temperature Anomaly Image 200 Global Map Land Surface Temperature Anomaly Image 201 Global Map Land Surface Temperature Anomaly Image 202 Global Map Land Surface Temperature Anomaly Image 203 Global Map Land Surface Temperature Anomaly Image 204 Global Map Land Surface Temperature Anomaly Image 205 Global Map Land Surface Temperature Anomaly Image 206 Global Map Land Surface Temperature Anomaly Image 207 Global Map Land Surface Temperature Anomaly Image 208 Global Map Land Surface Temperature Anomaly Image 209 Global Map Land Surface Temperature Anomaly Image 210 Global Map Land Surface Temperature Anomaly Image 211 Global Map Land Surface Temperature Anomaly Image 212 Global Map Land Surface Temperature Anomaly Image 213 Global Map Land Surface Temperature Anomaly Image 214 Global Map Land Surface Temperature Anomaly Image 215 Global Map Land Surface Temperature Anomaly Image 216 Global Map Land Surface Temperature Anomaly Image 217 Global Map Land Surface Temperature Anomaly Image 218 Global Map Land Surface Temperature Anomaly Image 219 Global Map Land Surface Temperature Anomaly Image 220 Global Map Land Surface Temperature Anomaly Image 221 Global Map Land Surface Temperature Anomaly Image 222 Global Map Land Surface Temperature Anomaly Image 223 Global Map Land Surface Temperature Anomaly Image 224 Global Map Land Surface Temperature Anomaly Image 225 Global Map Land Surface Temperature Anomaly Image 226 Global Map Land Surface Temperature Anomaly Image 227 Global Map Land Surface Temperature Anomaly Image 228 Global Map Land Surface Temperature Anomaly Image 229 Global Map Land Surface Temperature Anomaly Image 230 Global Map Land Surface Temperature Anomaly Image 231 Global Map Land Surface Temperature Anomaly Image 232 Global Map Land Surface Temperature Anomaly Image 233 Global Map Land Surface Temperature Anomaly Image 234 Global Map Land Surface Temperature Anomaly Image 235 Global Map Land Surface Temperature Anomaly Image 236 Global Map Land Surface Temperature Anomaly Image 237 Global Map Land Surface Temperature Anomaly Image 238 Global Map Land Surface Temperature Anomaly Image 239 Global Map Land Surface Temperature Anomaly Image 240 Global Map Land Surface Temperature Anomaly Image 241 Global Map Land Surface Temperature Anomaly Image 242 Global Map Land Surface Temperature Anomaly Image 243 Global Map Land Surface Temperature Anomaly Image 244 Global Map Land Surface Temperature Anomaly Image 245 Global Map Land Surface Temperature Anomaly Image 246 Global Map Land Surface Temperature Anomaly Image 247 Global Map Land Surface Temperature Anomaly Image 248 Global Map Land Surface Temperature Anomaly Image 249 Global Map Land Surface Temperature Anomaly Image 250 Global Map Land Surface Temperature Anomaly Image 251 Global Map Land Surface Temperature Anomaly Image 252 Global Map Land Surface Temperature Anomaly Image 253 Global Map Land Surface Temperature Anomaly Image 254 Global Map Land Surface Temperature Anomaly Image 255 Global Map Land Surface Temperature Anomaly Image 256 Global Map Land Surface Temperature Anomaly Image 257 Global Map Land Surface Temperature Anomaly Image 258 Global Map Land Surface Temperature Anomaly Image 259 Global Map Land Surface Temperature Anomaly Image 260 Global Map Land Surface Temperature Anomaly Image 261 Global Map Land Surface Temperature Anomaly Image 262 Global Map Land Surface Temperature Anomaly Image 263 Global Map Land Surface Temperature Anomaly Image 264 Global Map Land Surface Temperature Anomaly Image 265 Global Map Land Surface Temperature Anomaly Image 266 Global Map Land Surface Temperature Anomaly Image 267 Global Map Land Surface Temperature Anomaly Image 268 Global Map Land Surface Temperature Anomaly Image 269 Global Map Land Surface Temperature Anomaly Image 270 Global Map Land Surface Temperature Anomaly Image 271 Global Map Land Surface Temperature Anomaly Image 272 Global Map Land Surface Temperature Anomaly Image 273 Global Map Land Surface Temperature Anomaly Image 274 Global Map Land Surface Temperature Anomaly Image 275 Global Map Land Surface Temperature Anomaly Image 276 Global Map Land Surface Temperature Anomaly Image 277 Global Map Land Surface Temperature Anomaly Image 278 Global Map Land Surface Temperature Anomaly Image 279 Global Map Land Surface Temperature Anomaly Image 280 Global Map Land Surface Temperature Anomaly Image 281 Global Map Land Surface Temperature Anomaly Image 282 Global Map Land Surface Temperature Anomaly Image 283 Global Map Land Surface Temperature Anomaly Image 284 Global Map Land Surface Temperature Anomaly Image 285 Global Map Land Surface Temperature Anomaly Image 286 Global Map Land Surface Temperature Anomaly Image 287 Global Map Land Surface Temperature Anomaly Image 288
Land Surface Temperature Anomaly
Land Surface Temperature Anomaly Scale

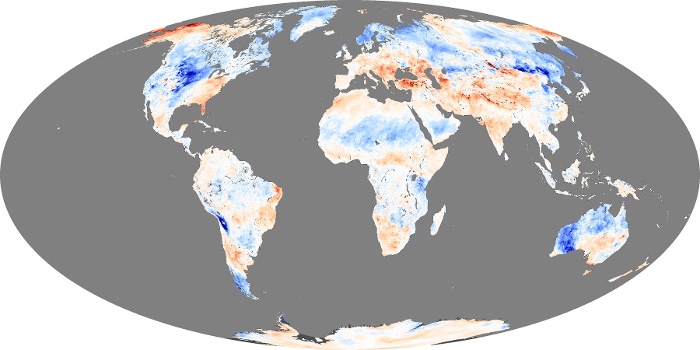
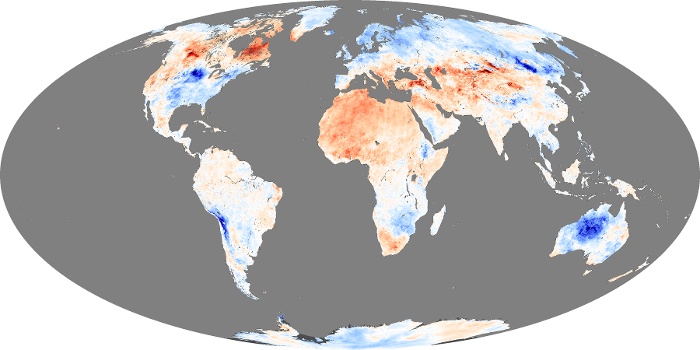
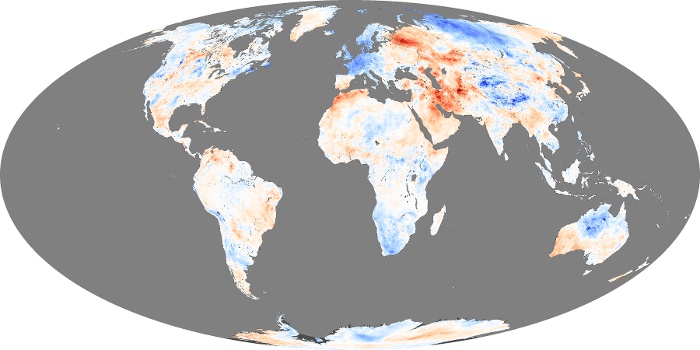
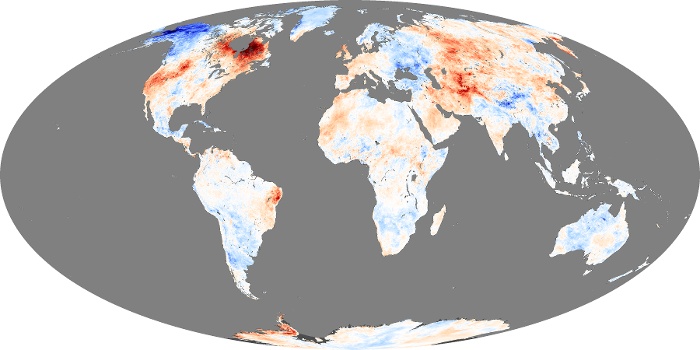
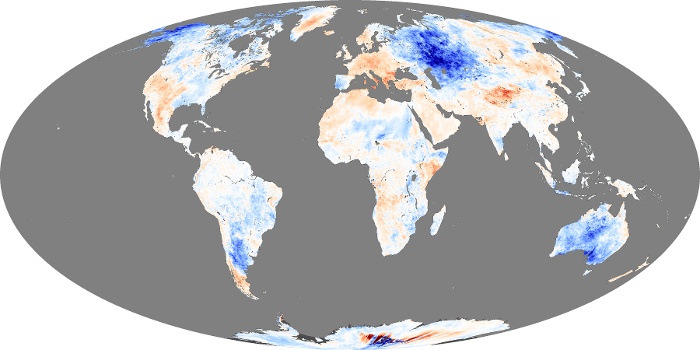
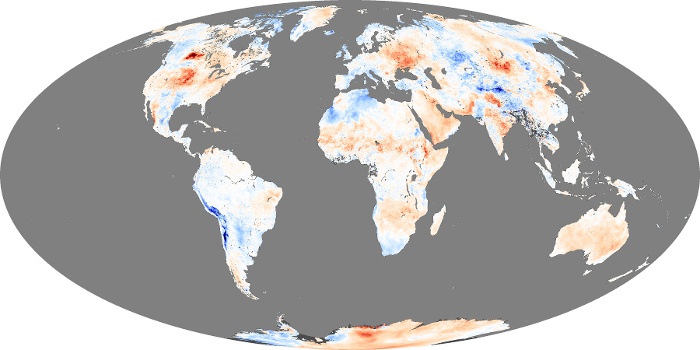
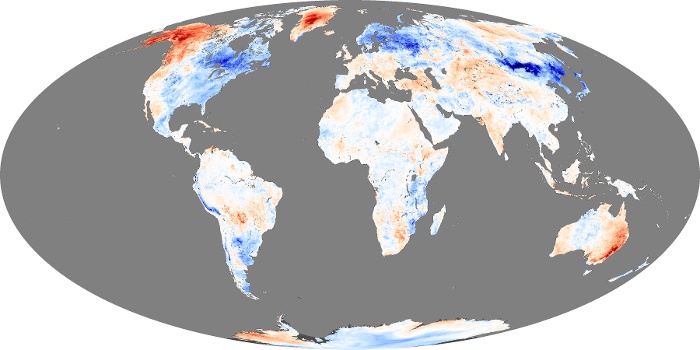
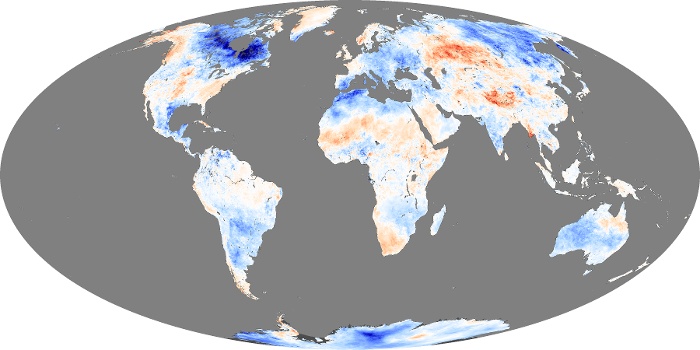
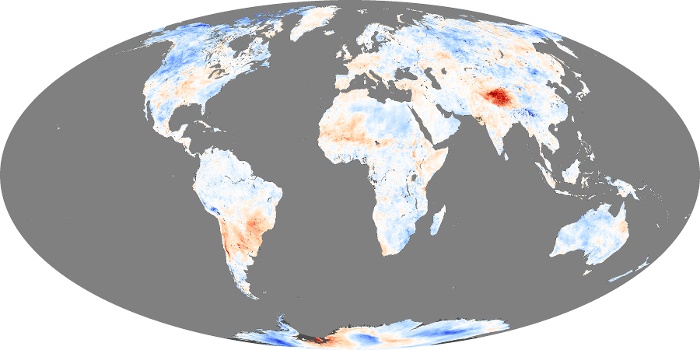
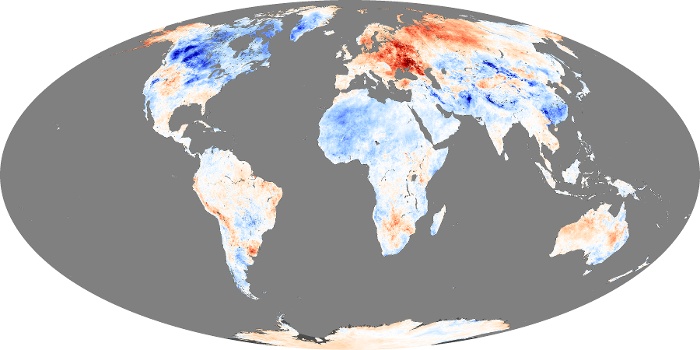
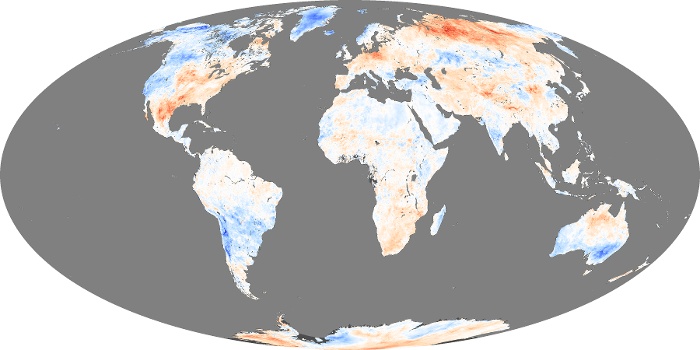
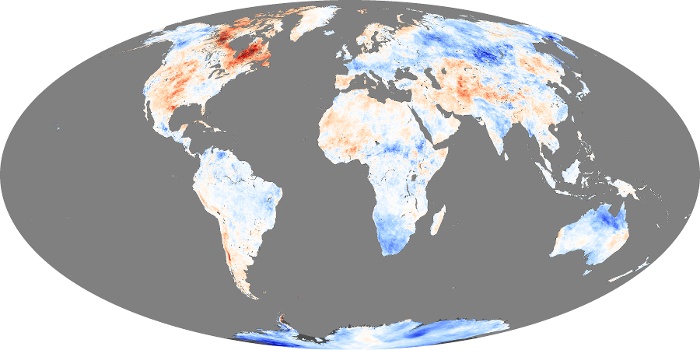
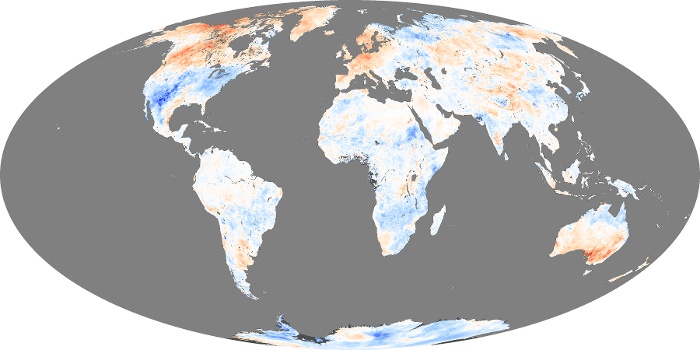
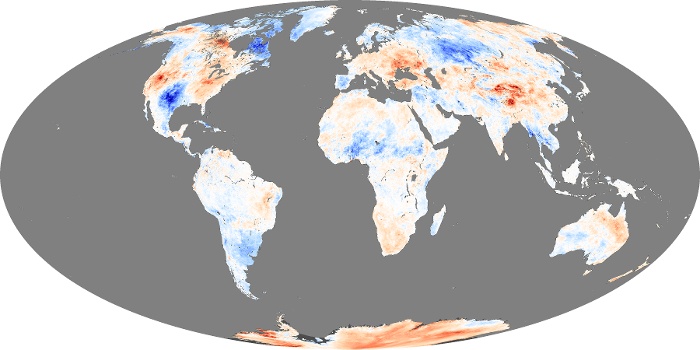
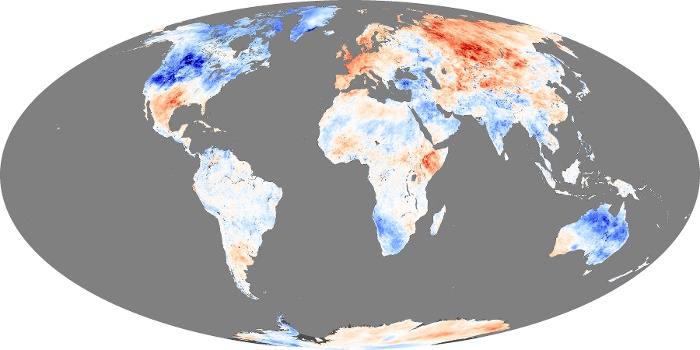
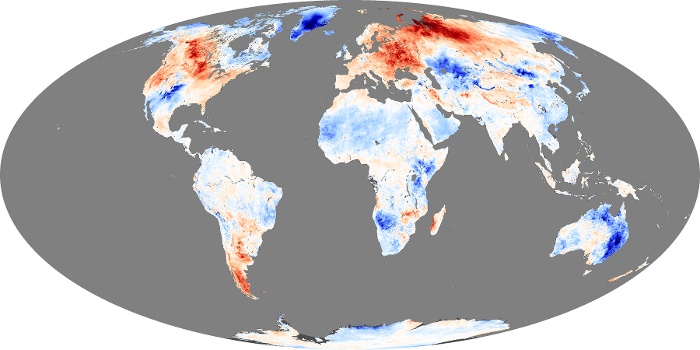
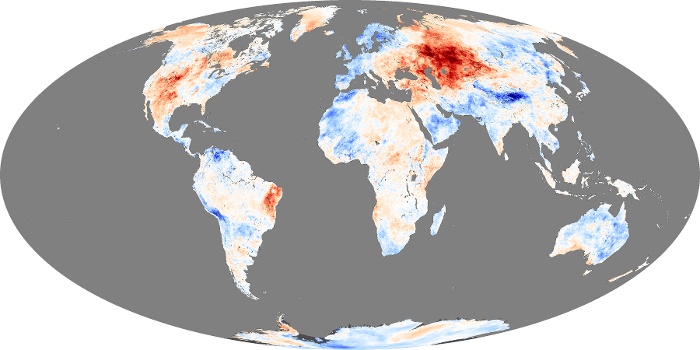
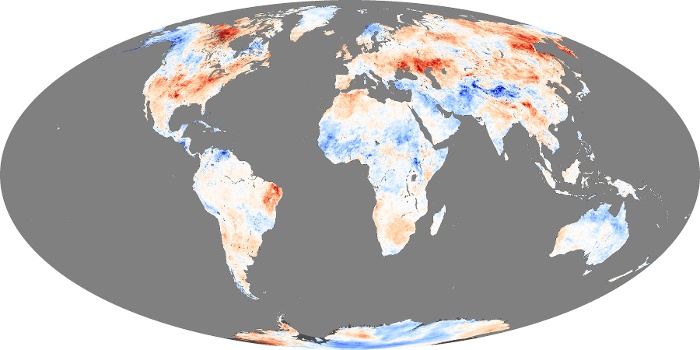
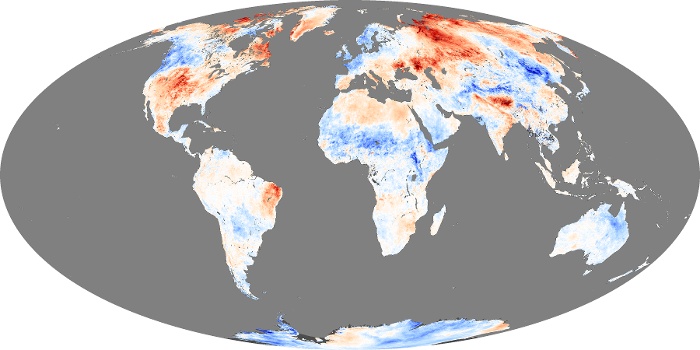
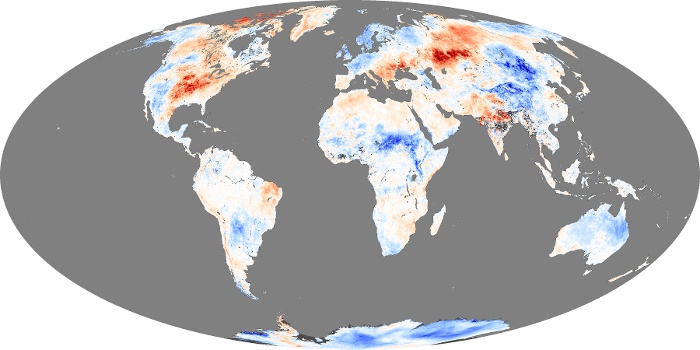
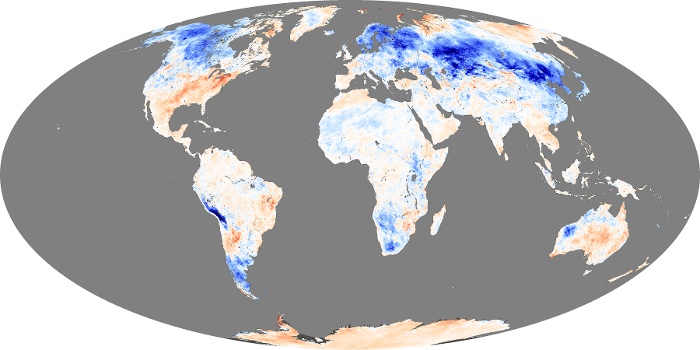
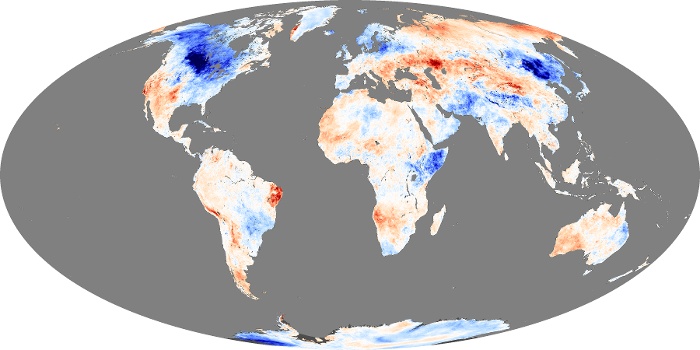
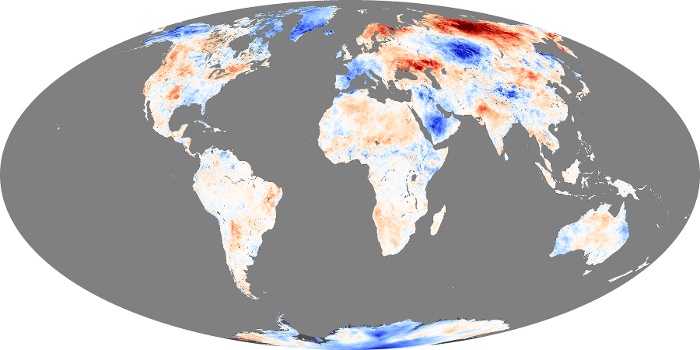
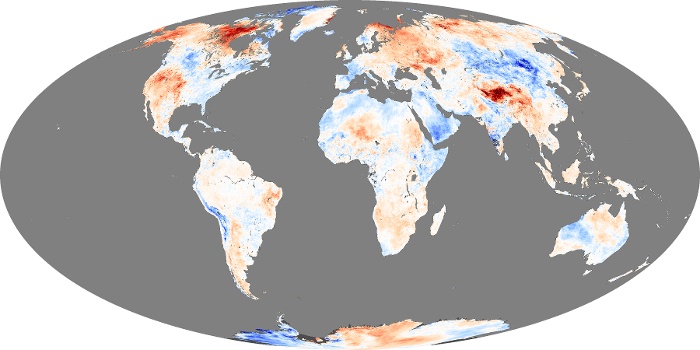
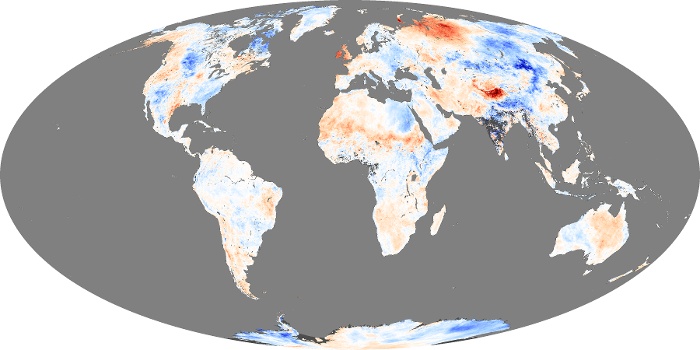
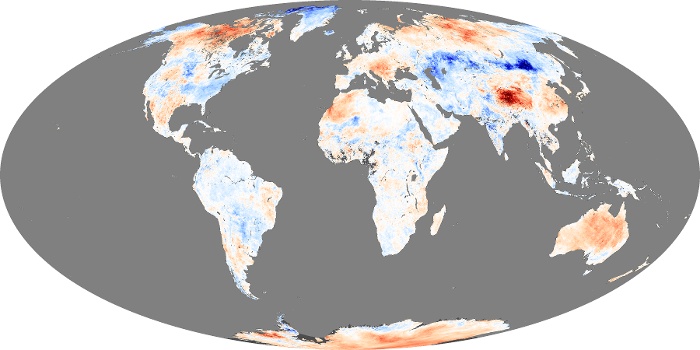
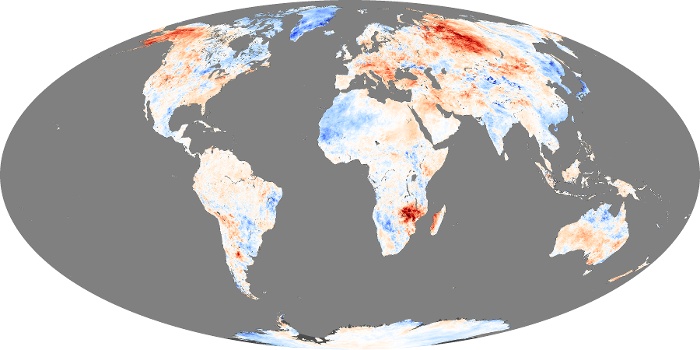
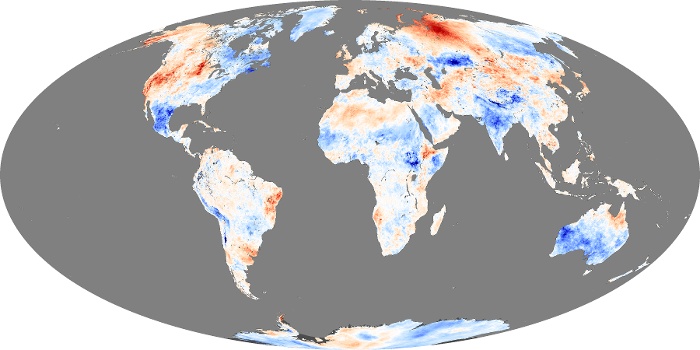
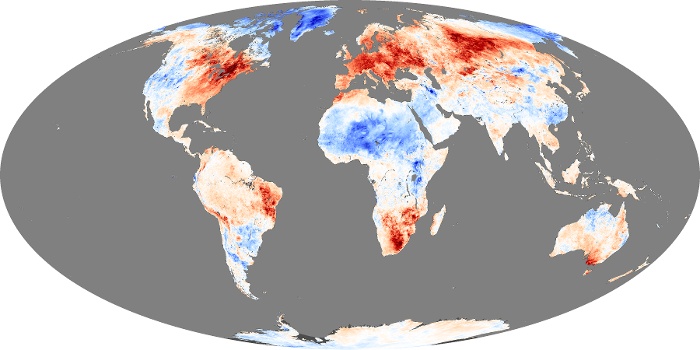
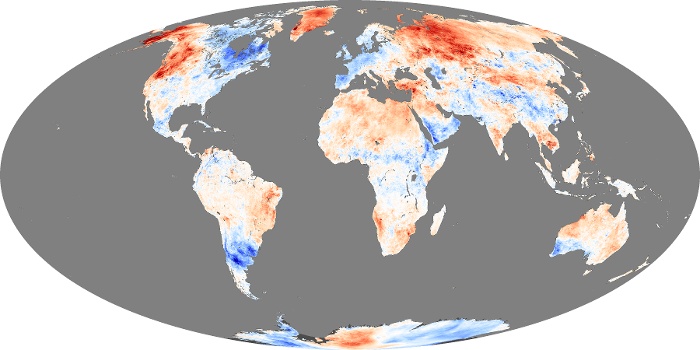
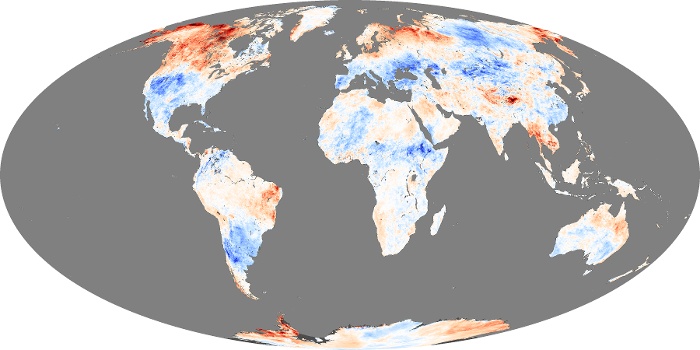
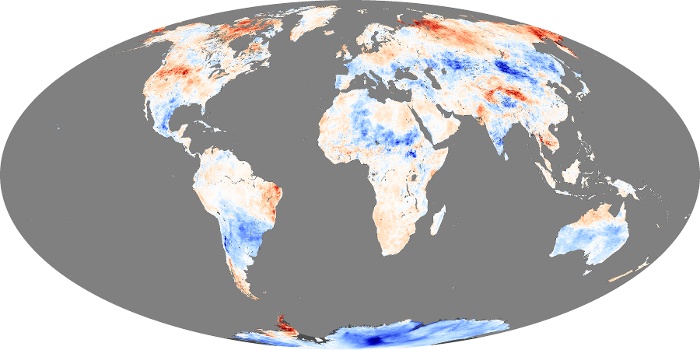
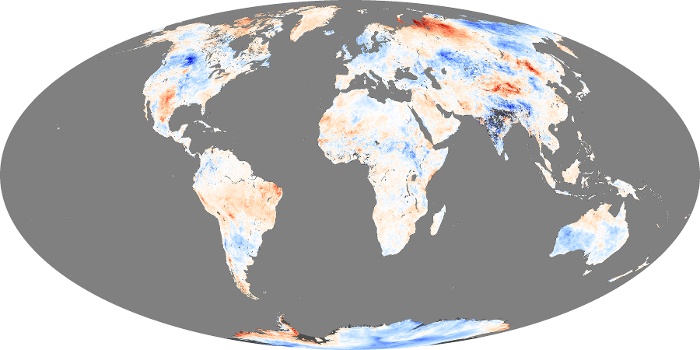
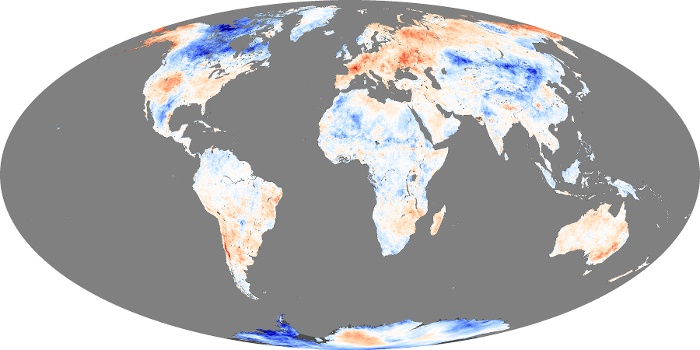
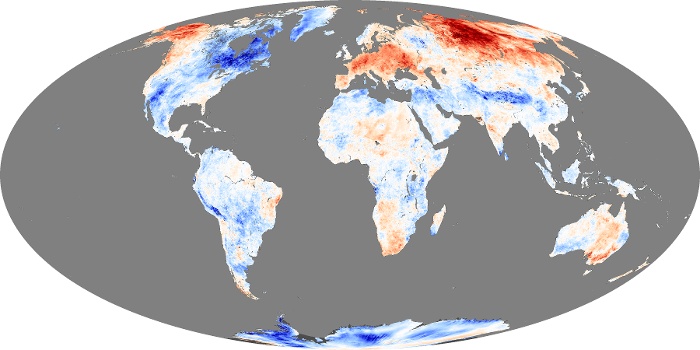
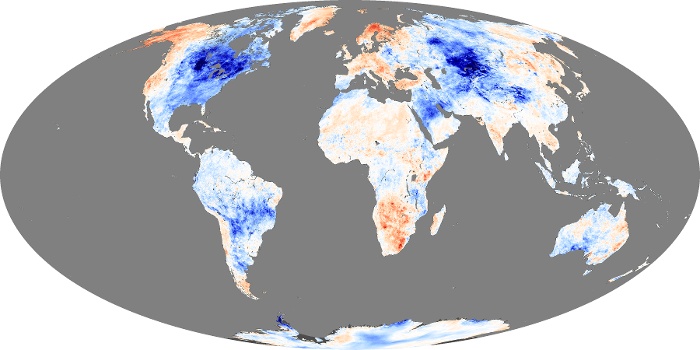
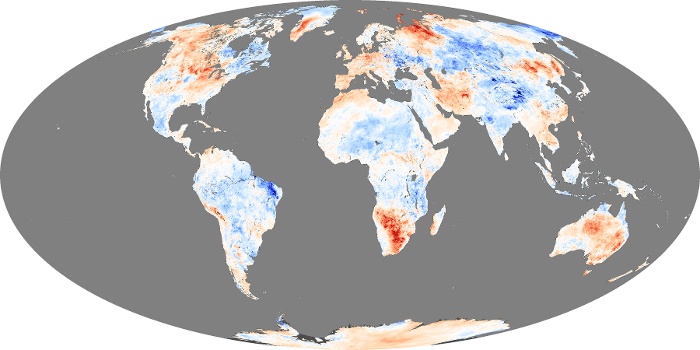
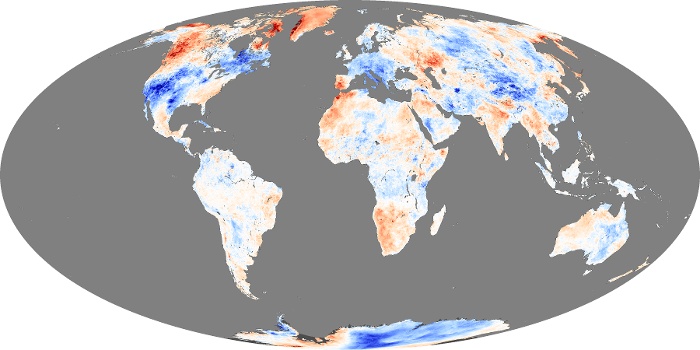
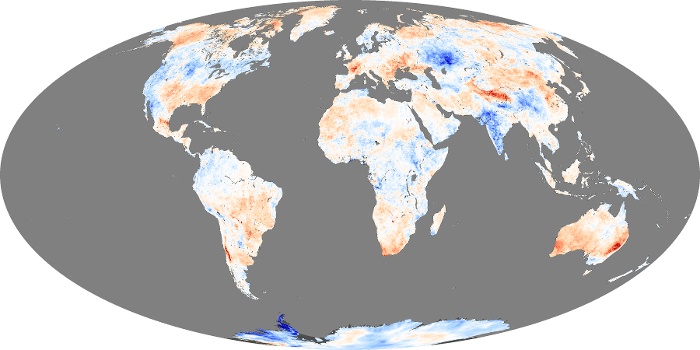
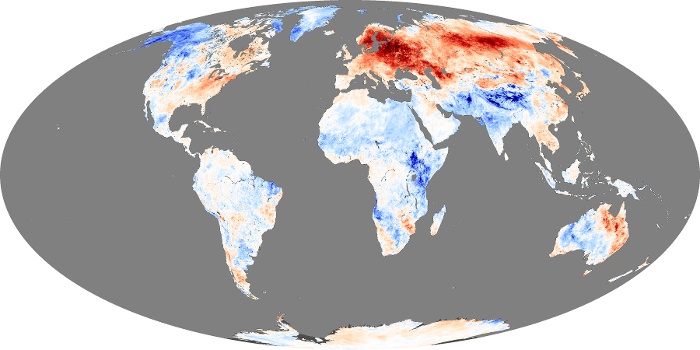
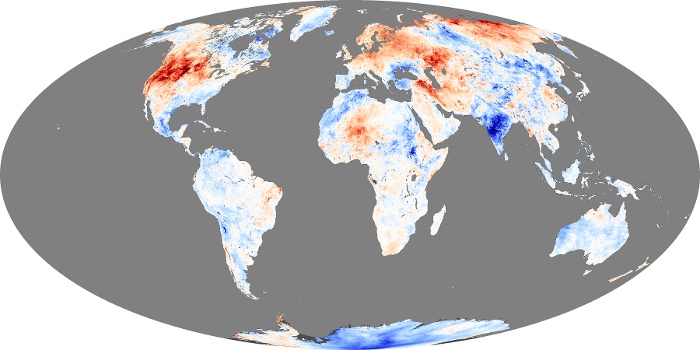
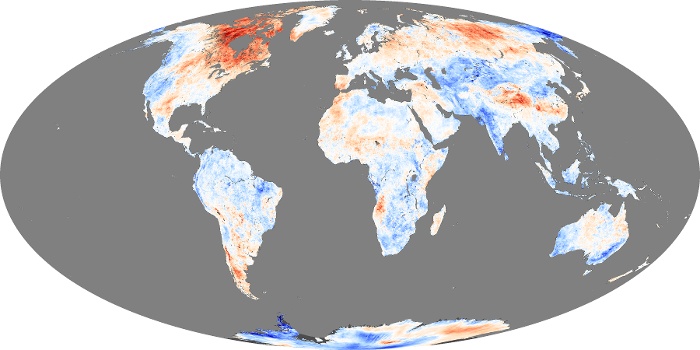
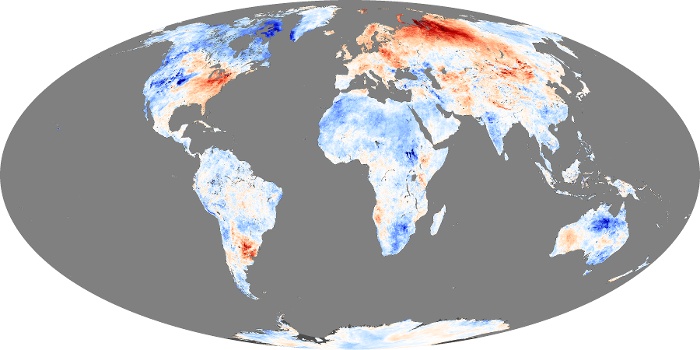
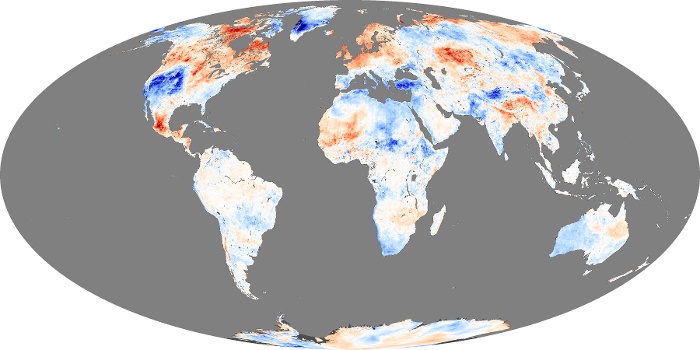
Land surface temperature is how hot the “surface” of the Earth would feel to the touch in a particular location. From a satellite’s point of view, the “surface” is whatever it sees when it looks through the atmosphere to the ground. It could be snow and ice, the grass on a lawn, the roof of a building, or the treetops in a forest. Thus, land surface temperature is not the same as the air temperature that is included in the daily weather report.

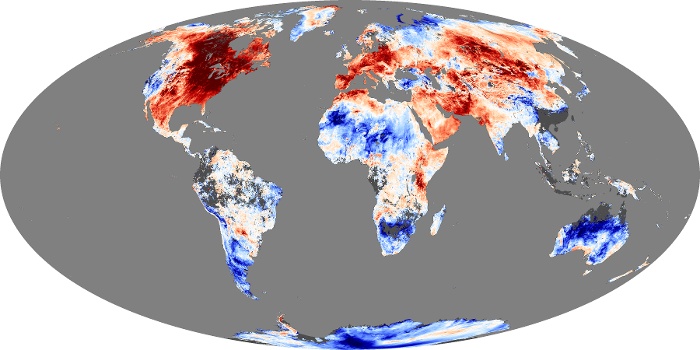
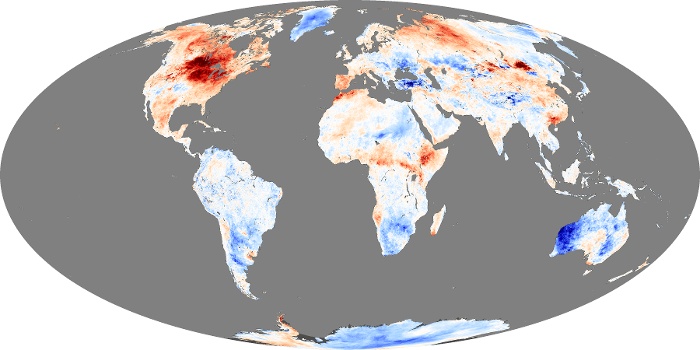
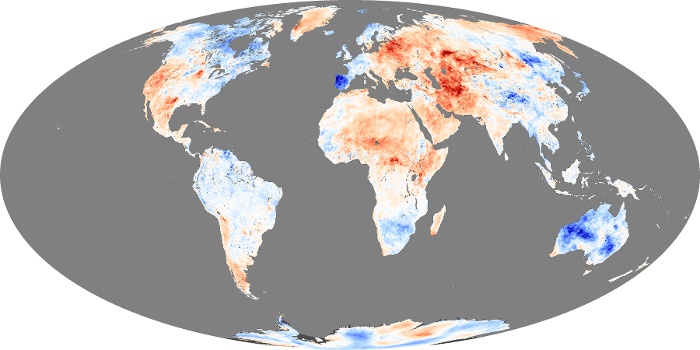
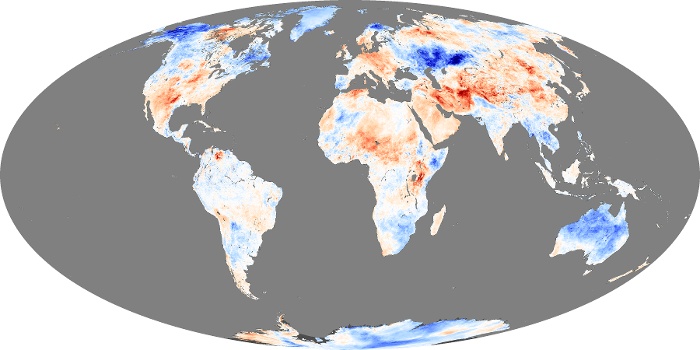
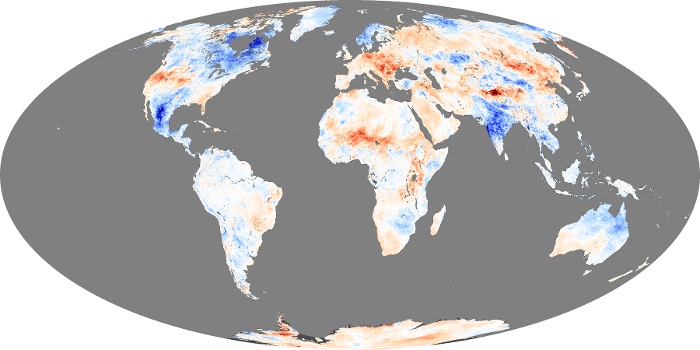
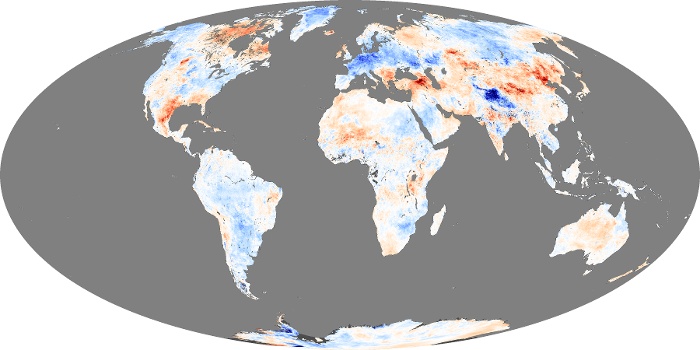
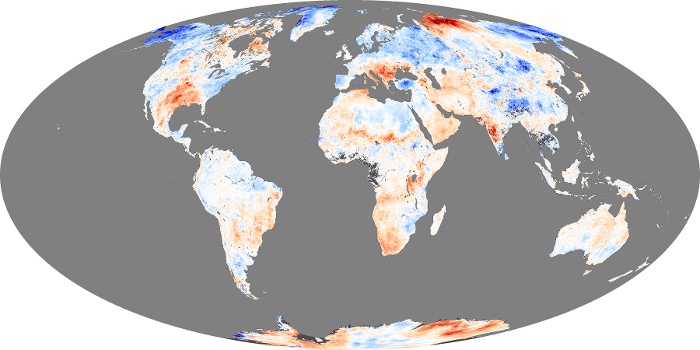
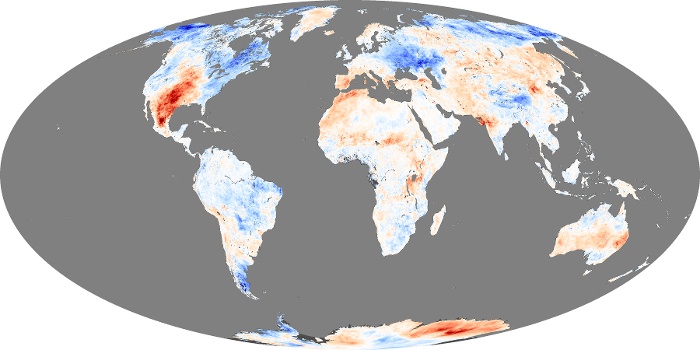
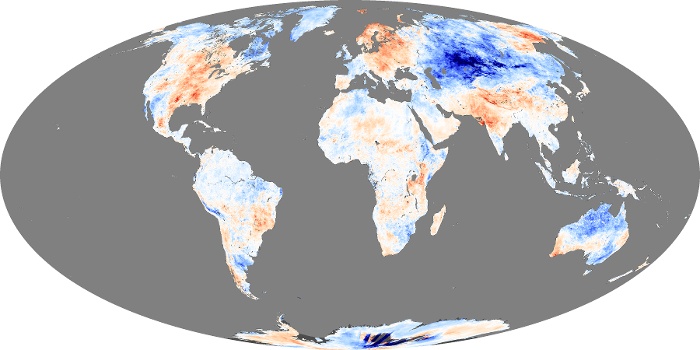
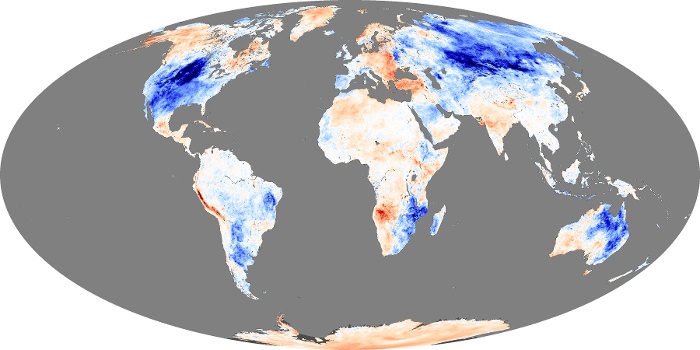
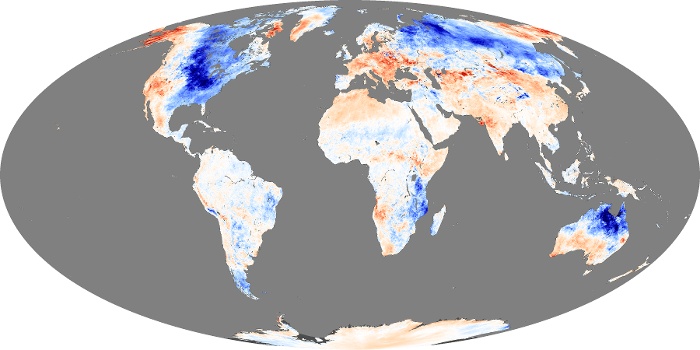
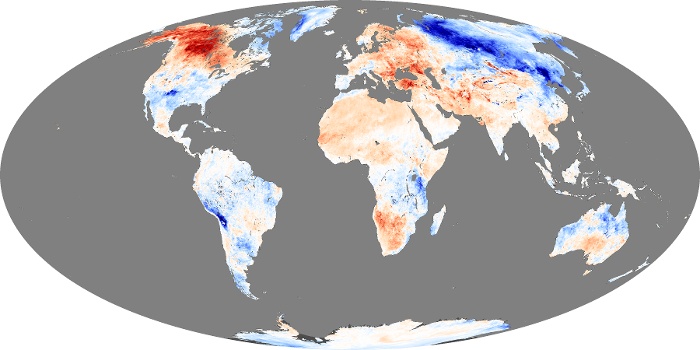
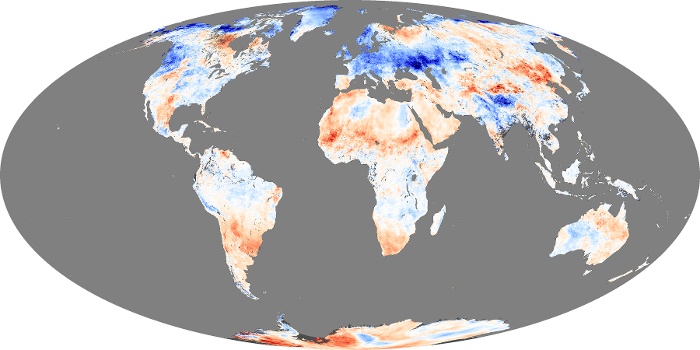
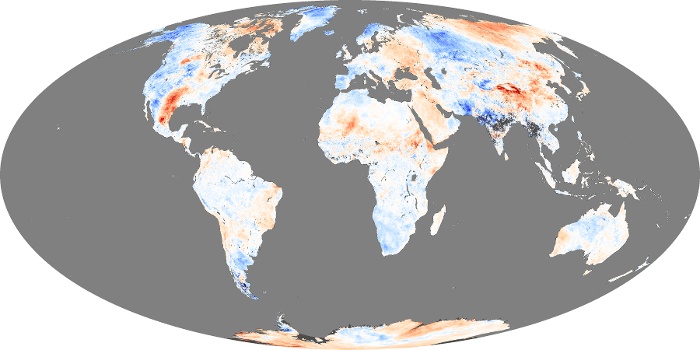
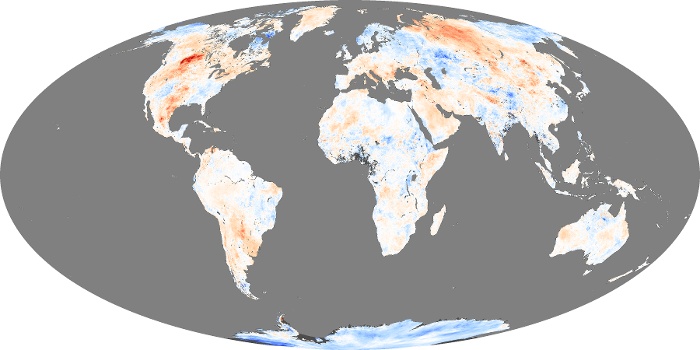
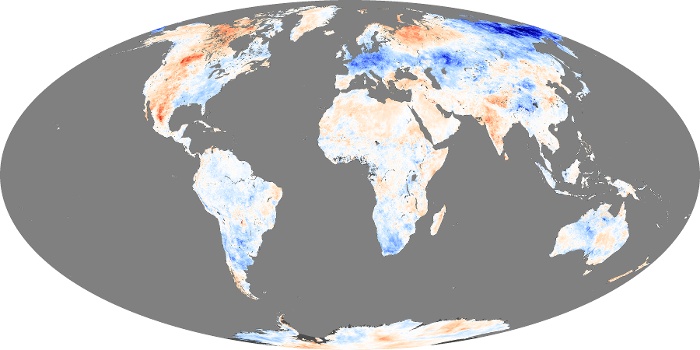
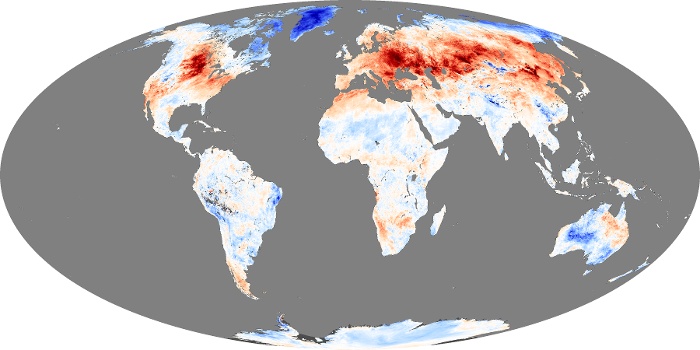
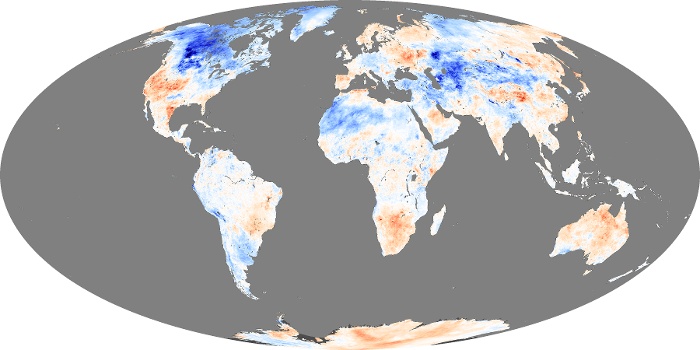
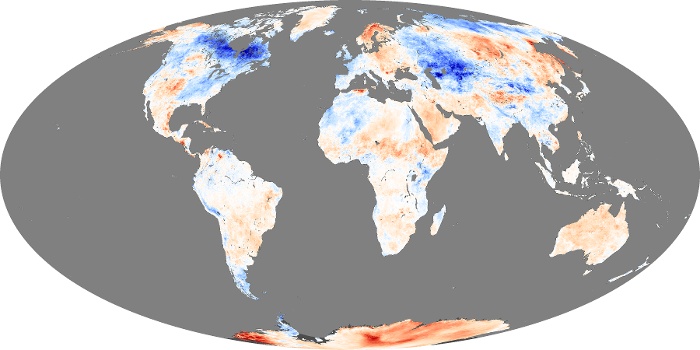
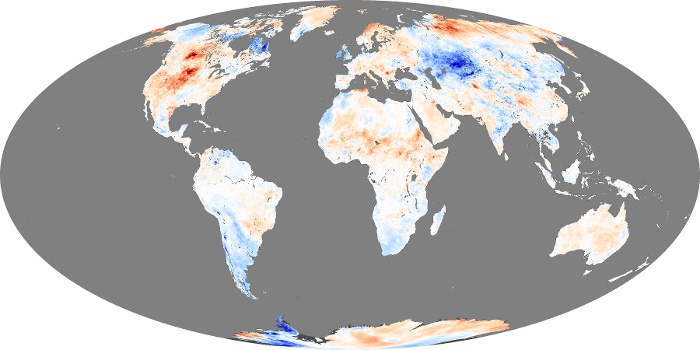
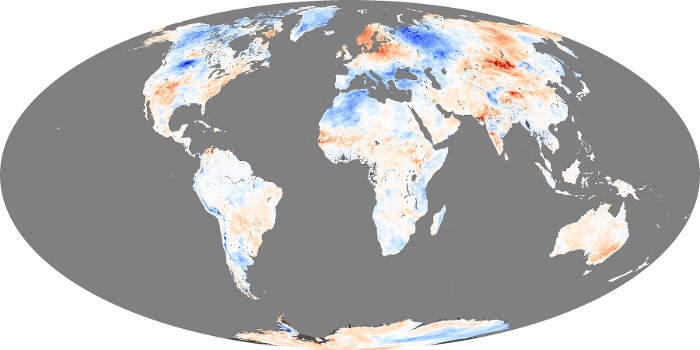
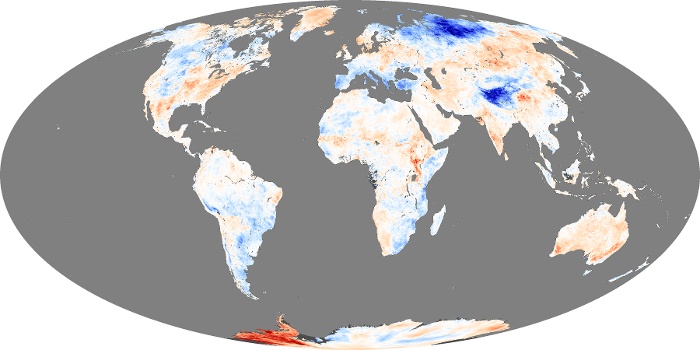
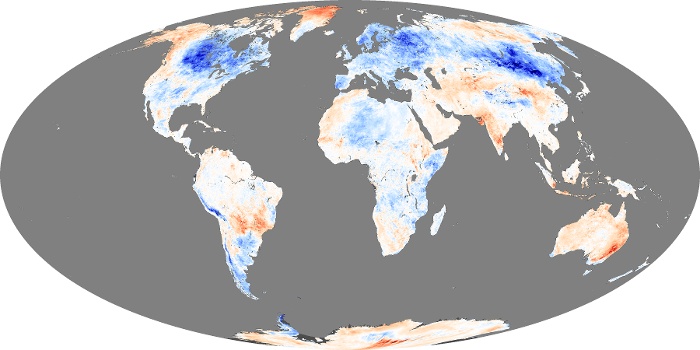
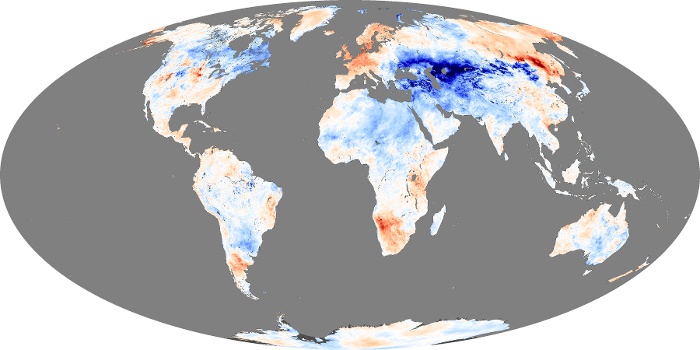
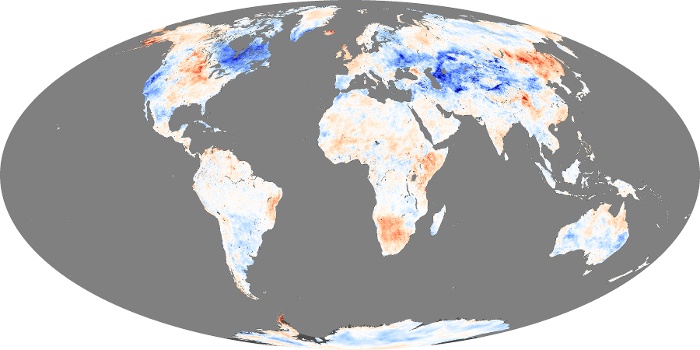
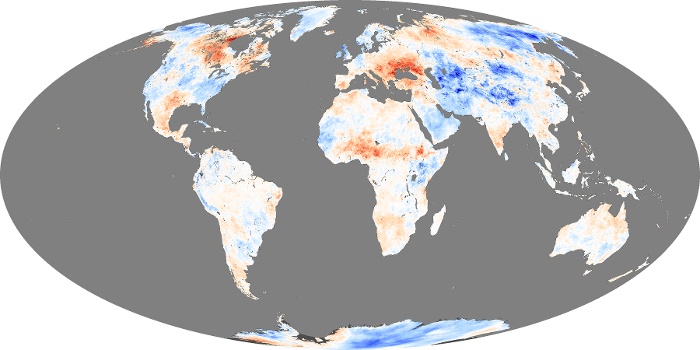
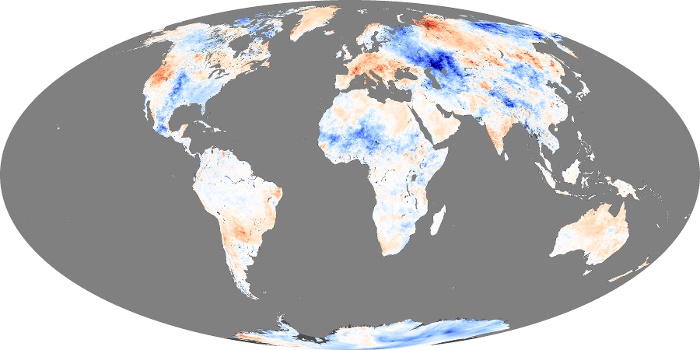
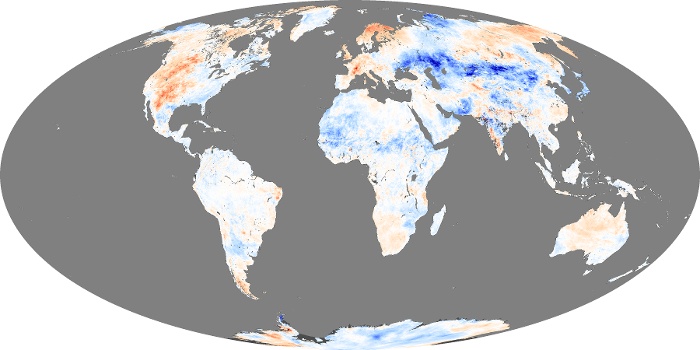
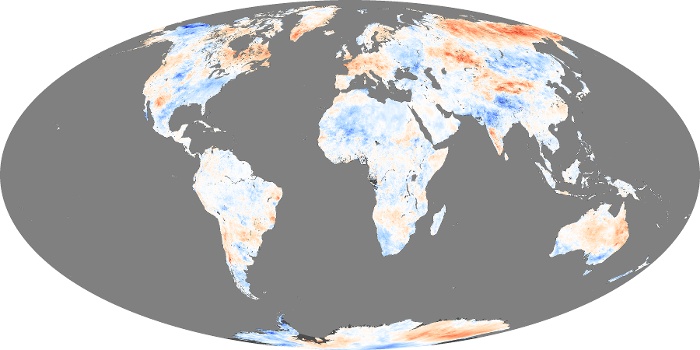
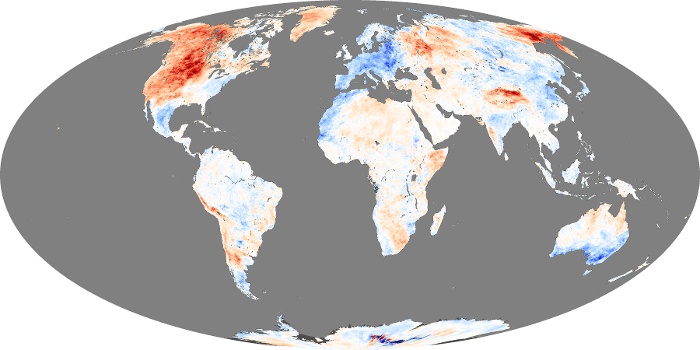
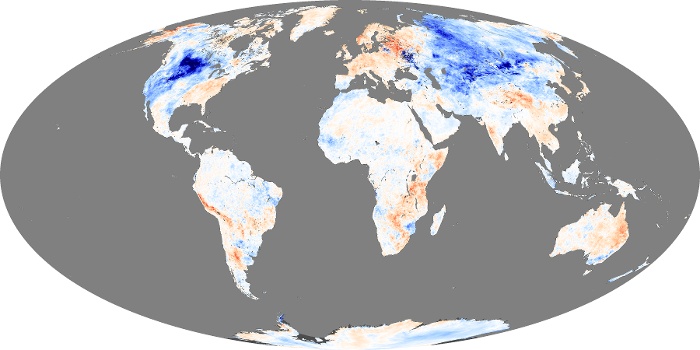
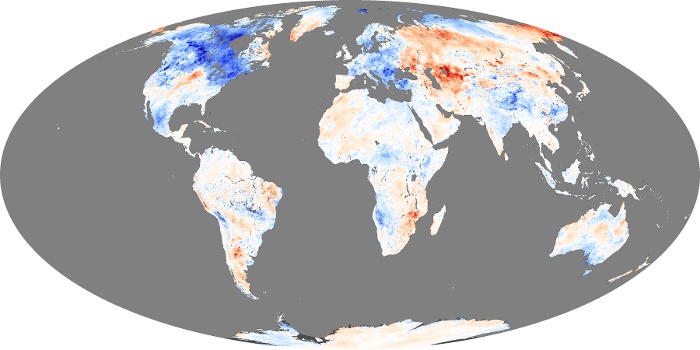
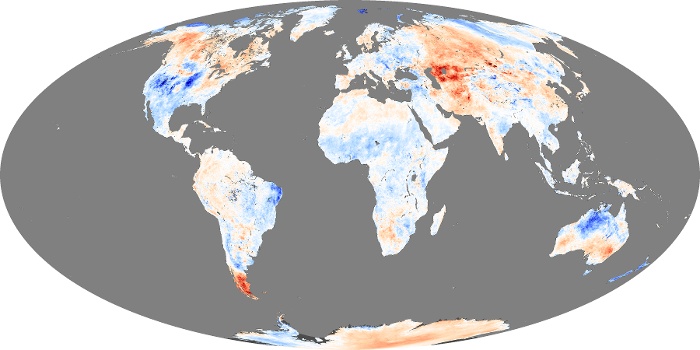
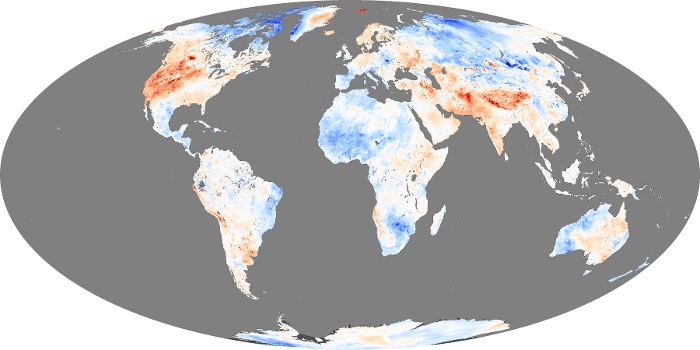
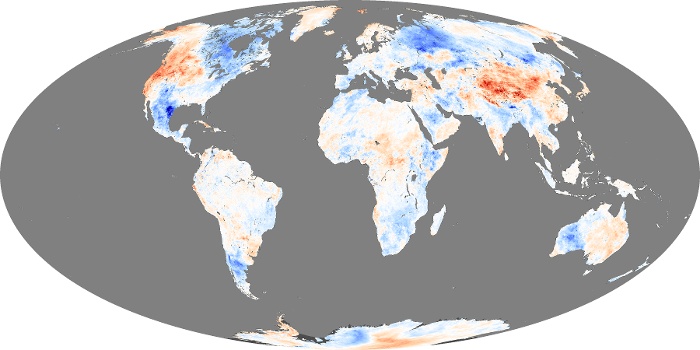
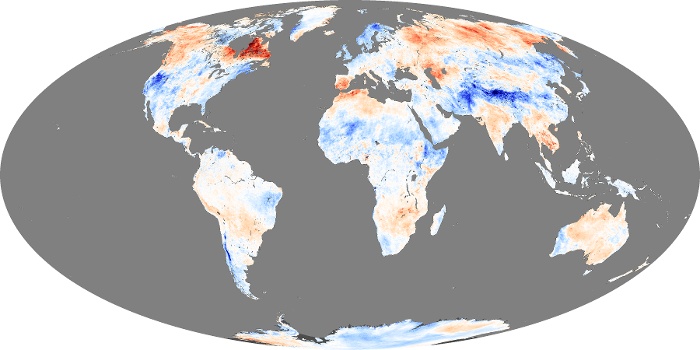
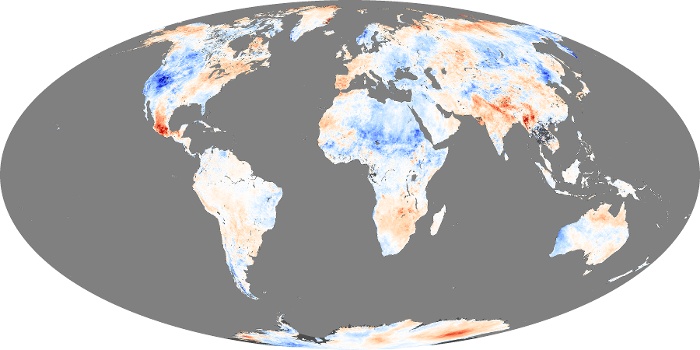
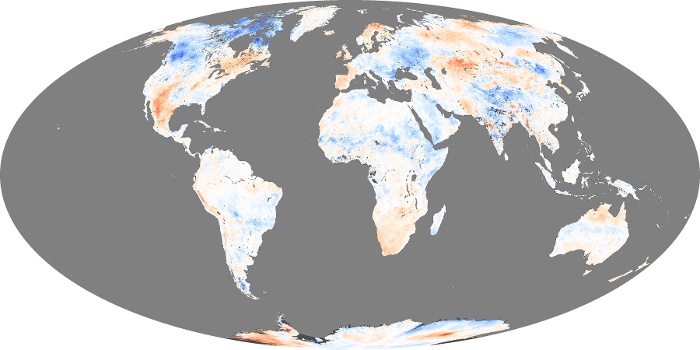
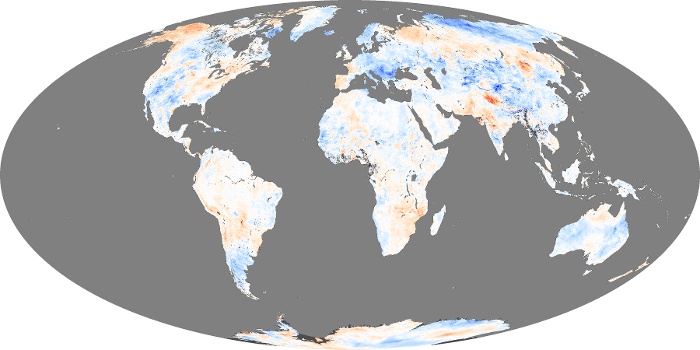
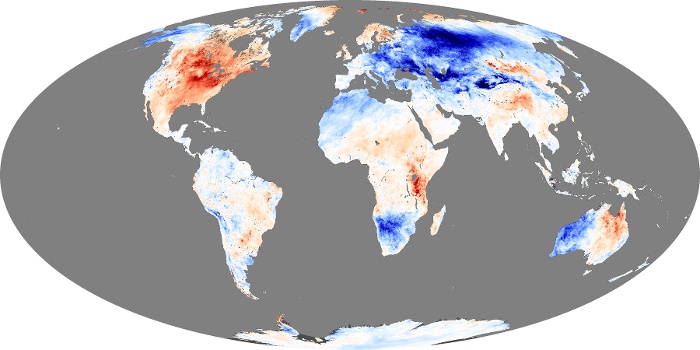
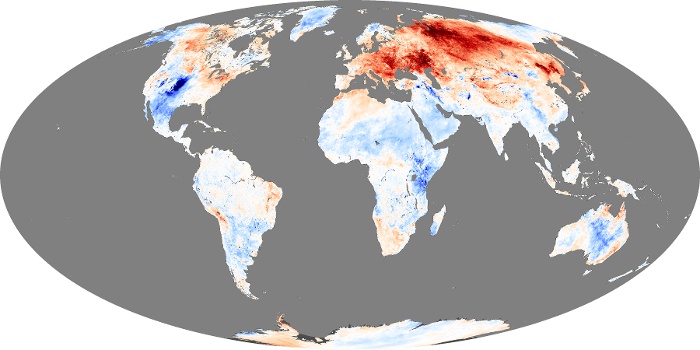
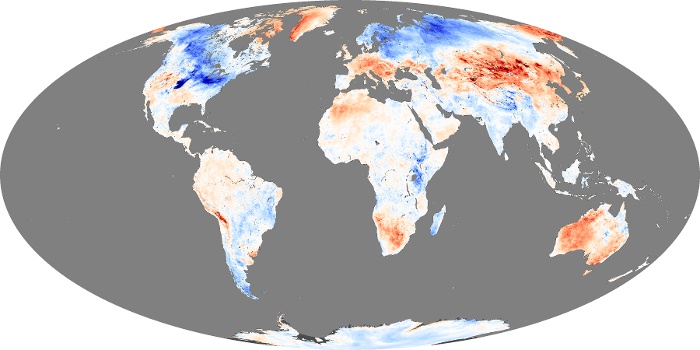
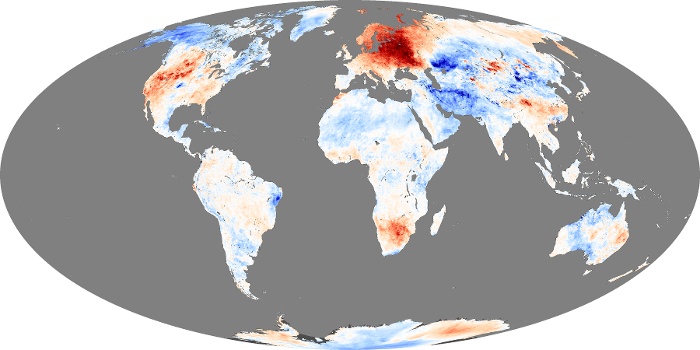
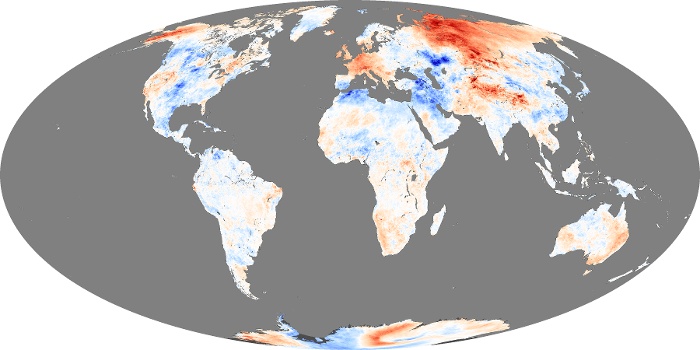
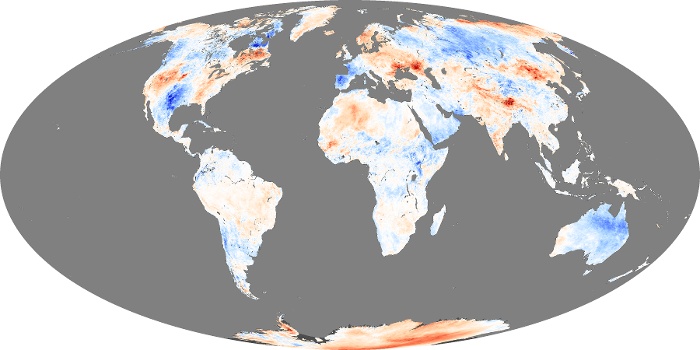
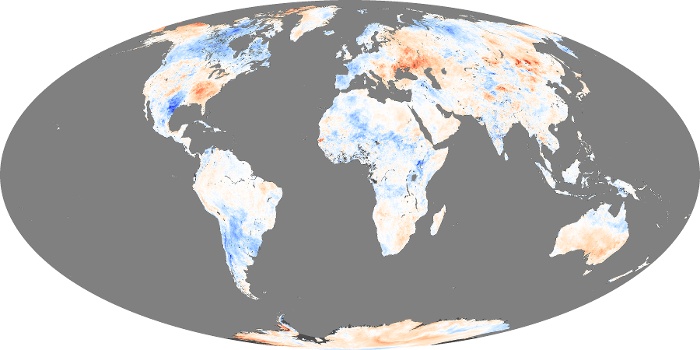
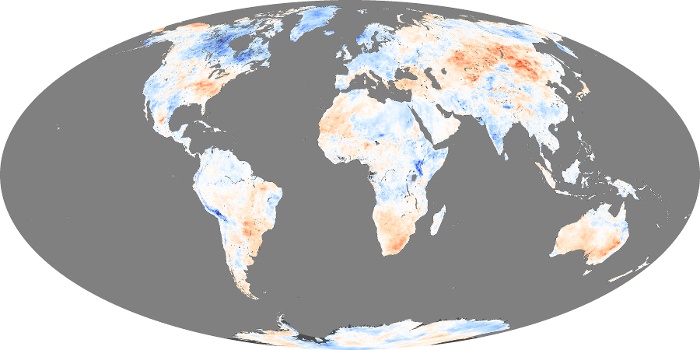
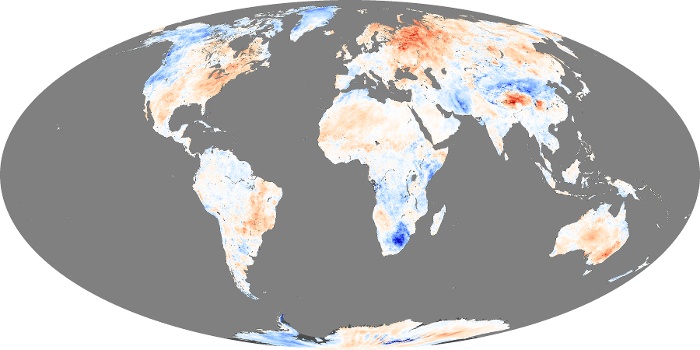
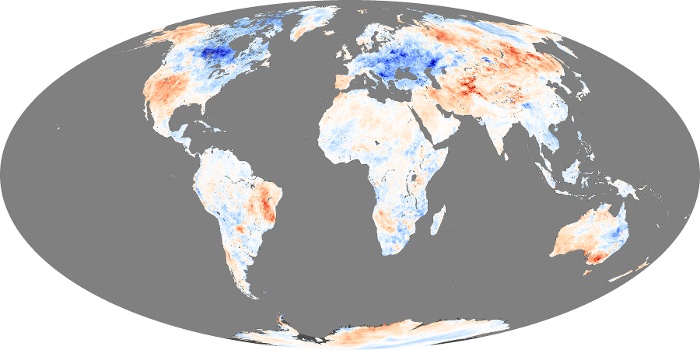
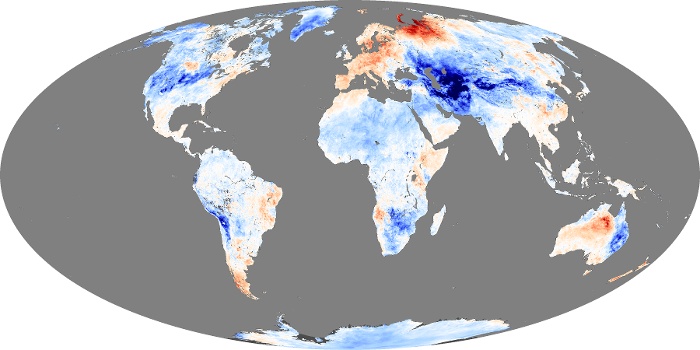
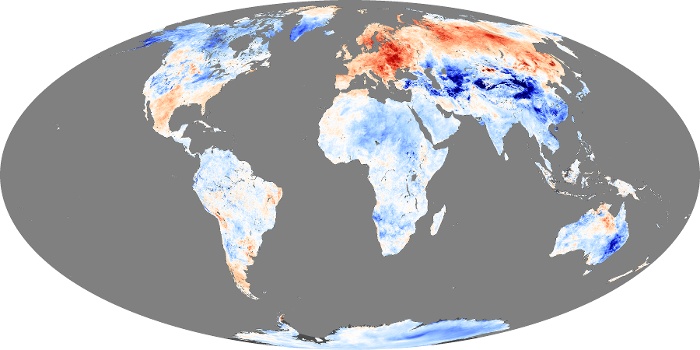
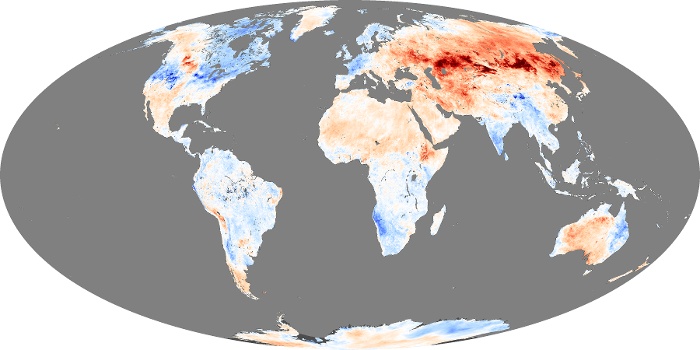
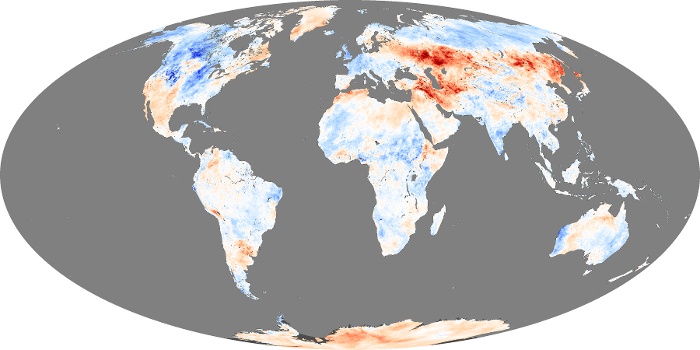
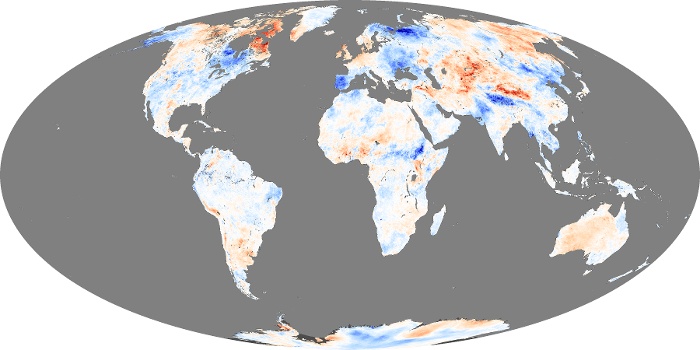
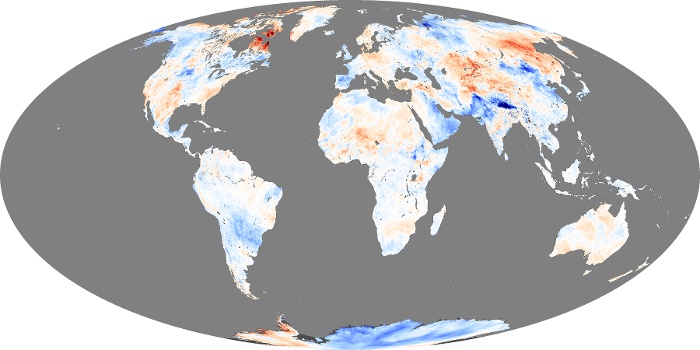
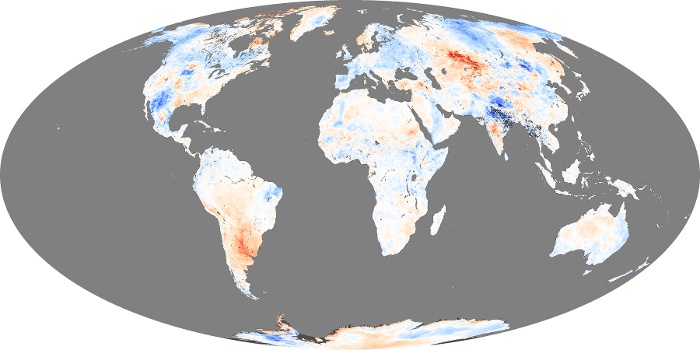
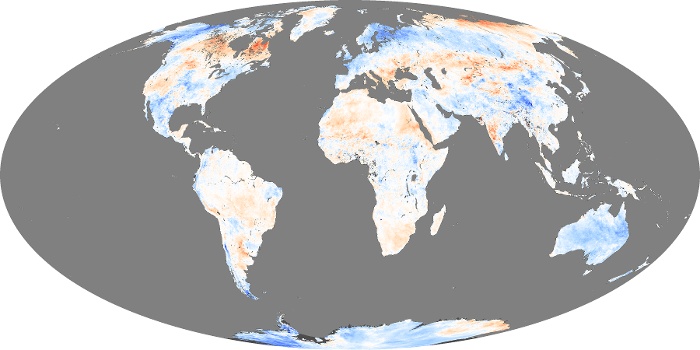
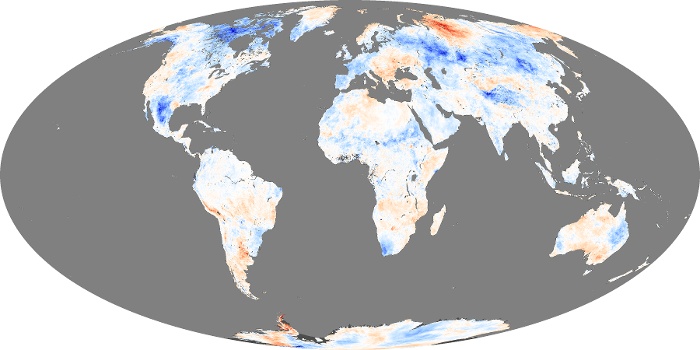
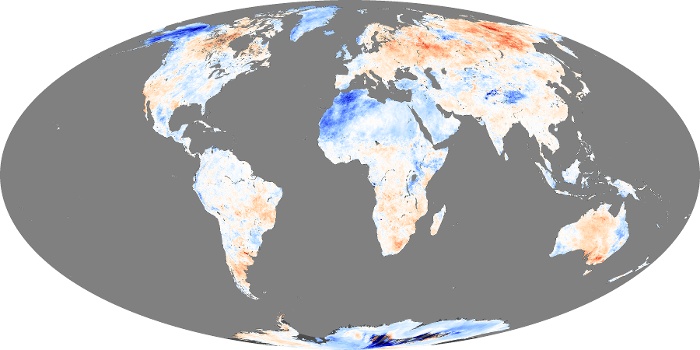
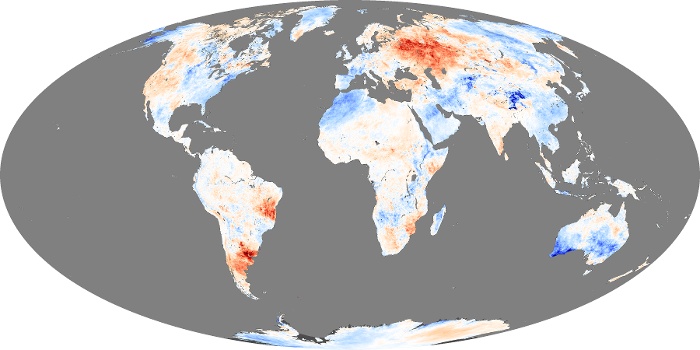
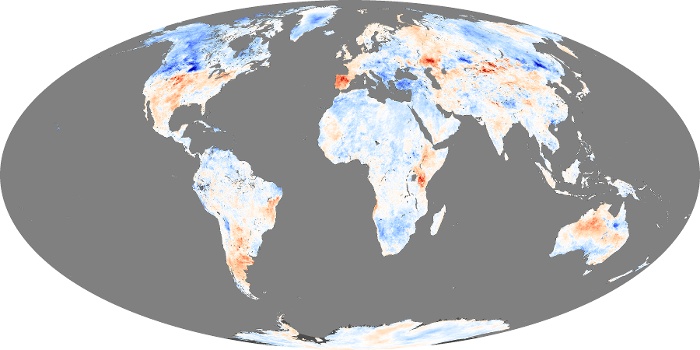
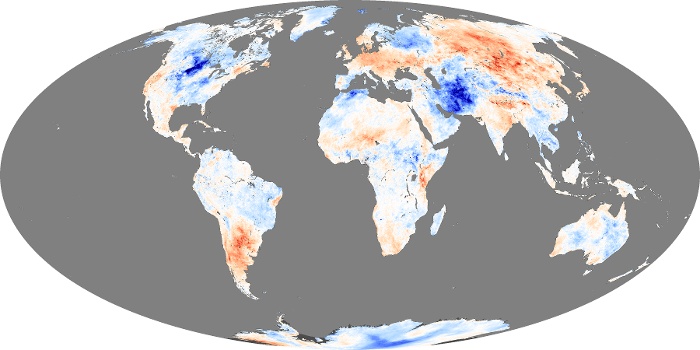
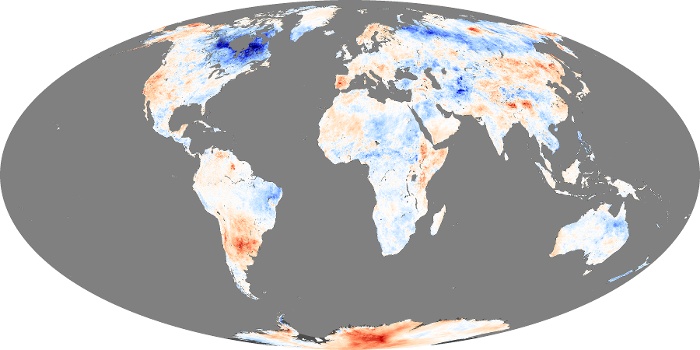
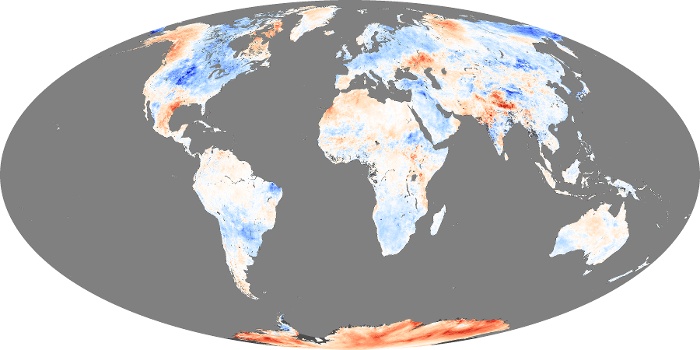
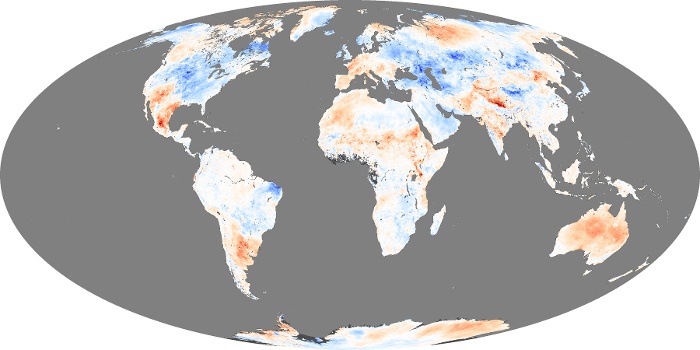
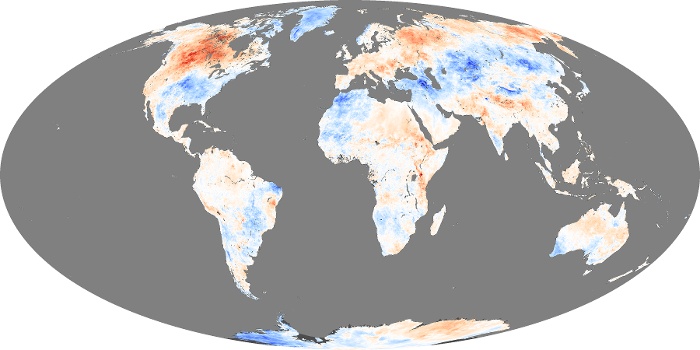
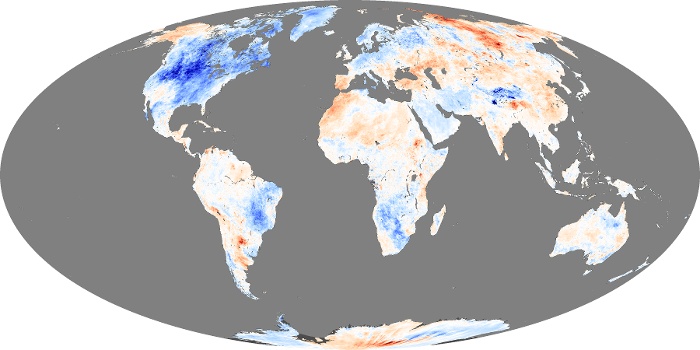
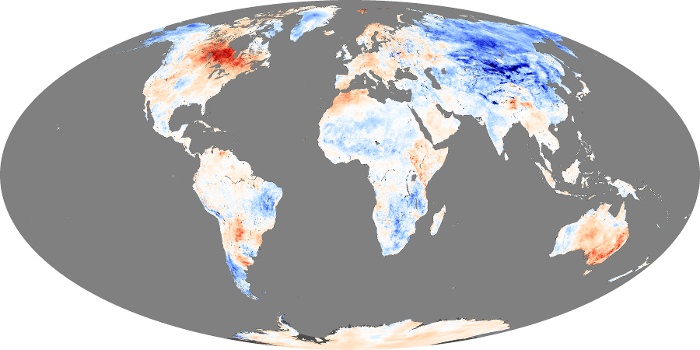
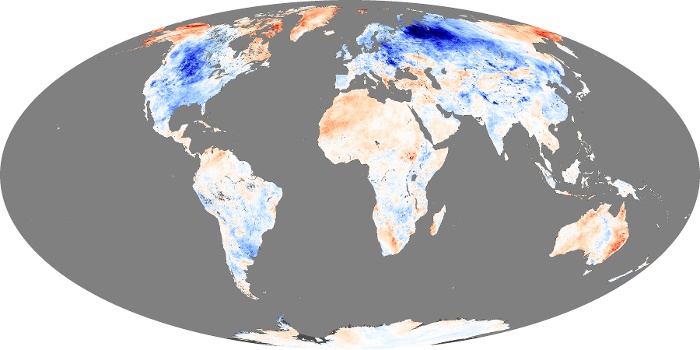
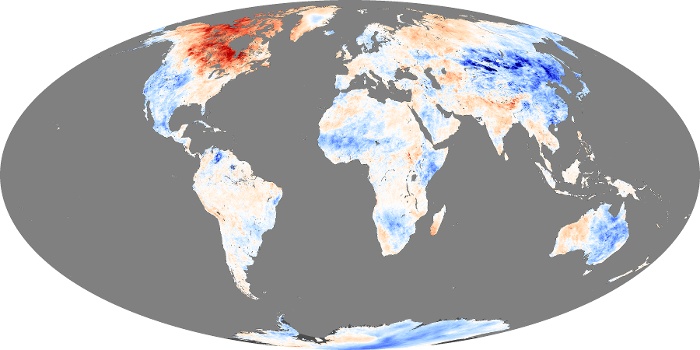
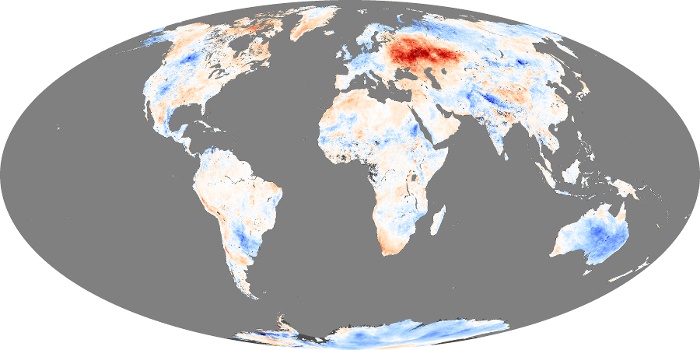
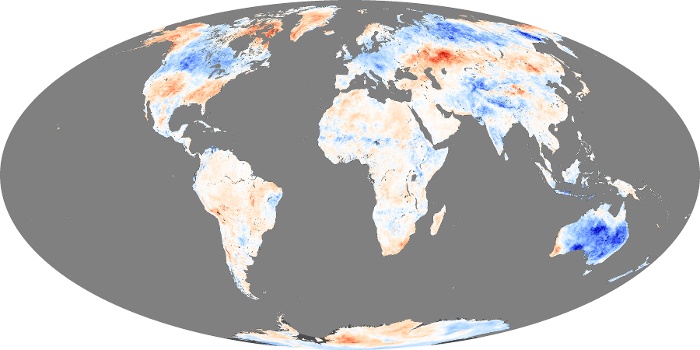
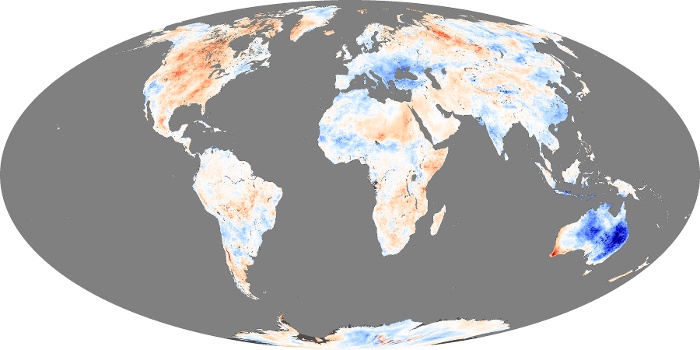
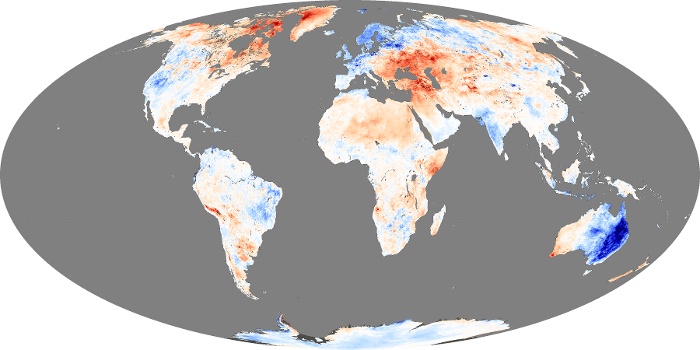
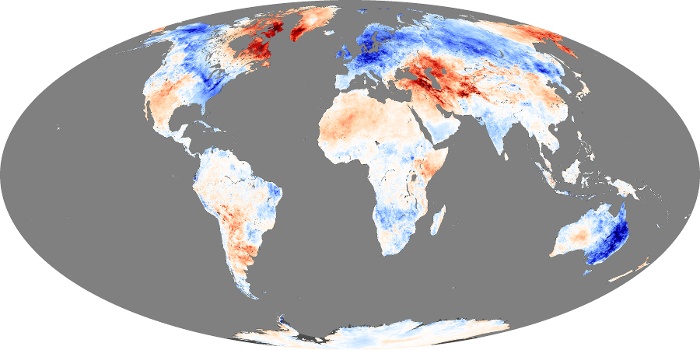
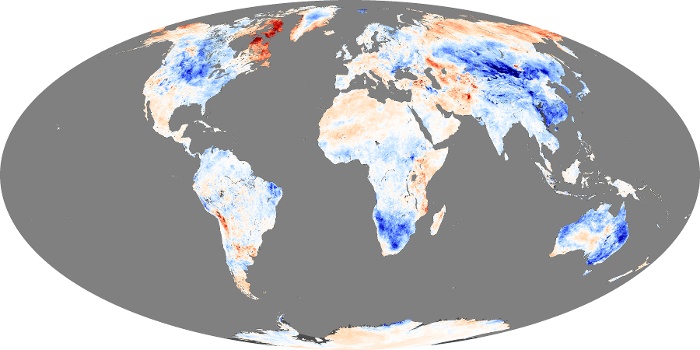
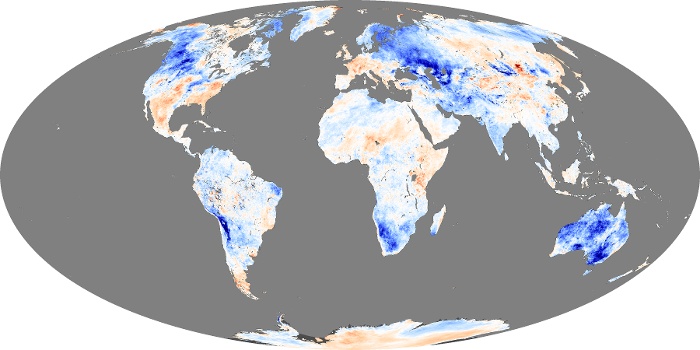
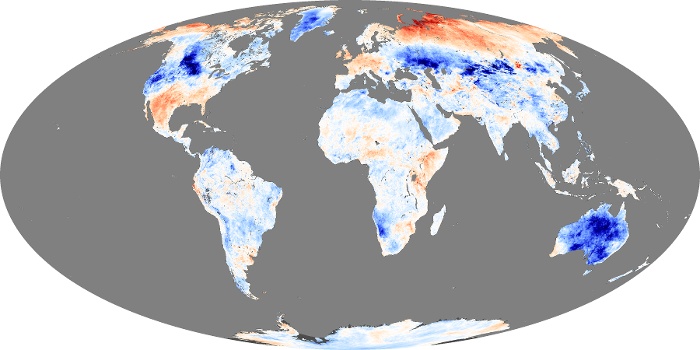
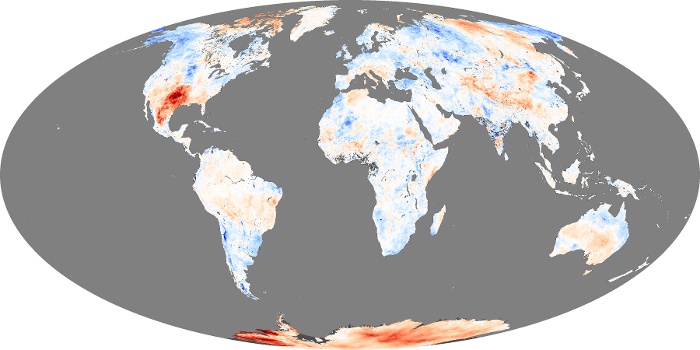
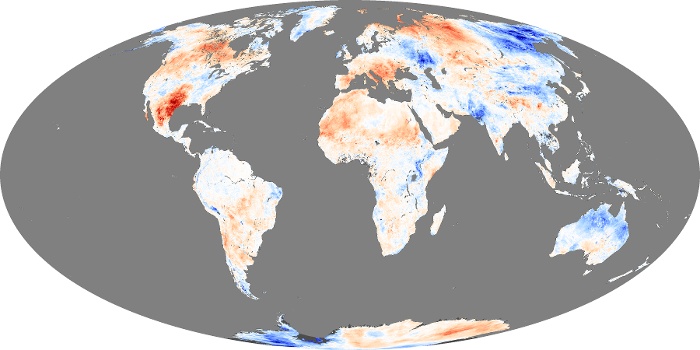
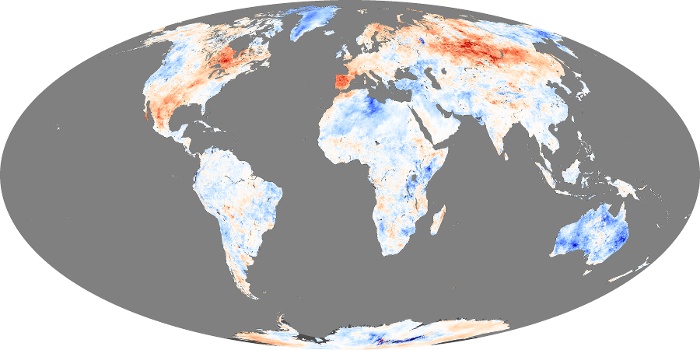
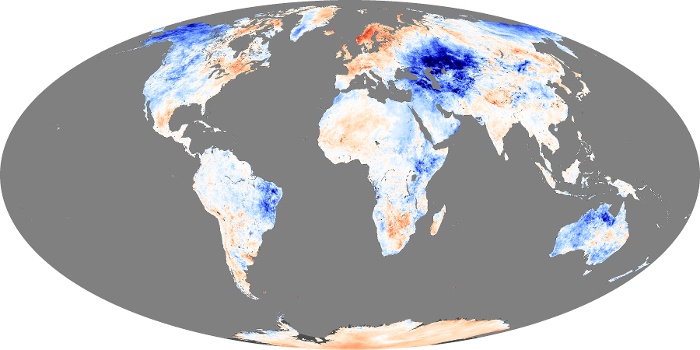
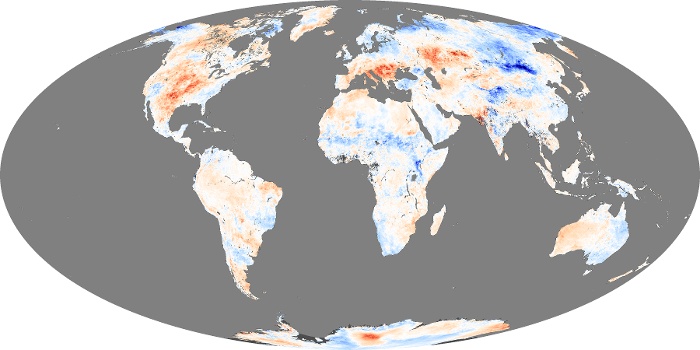
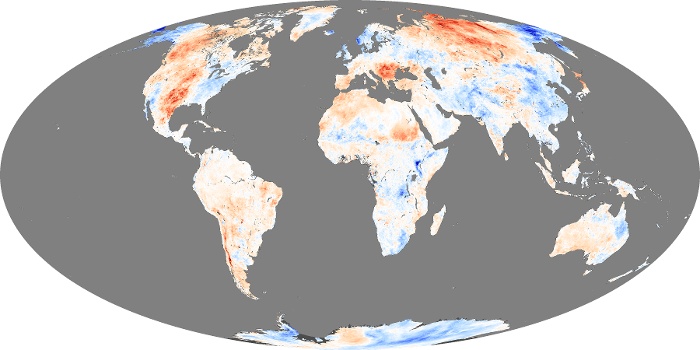
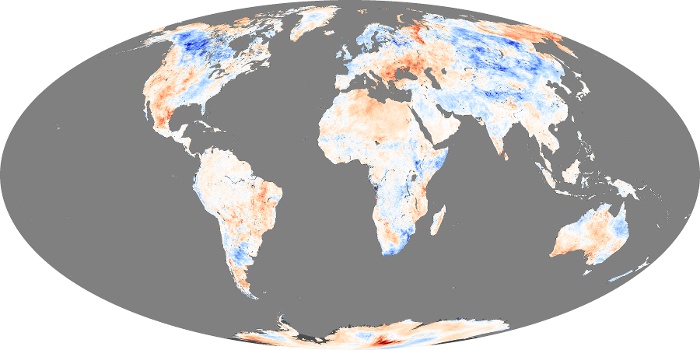
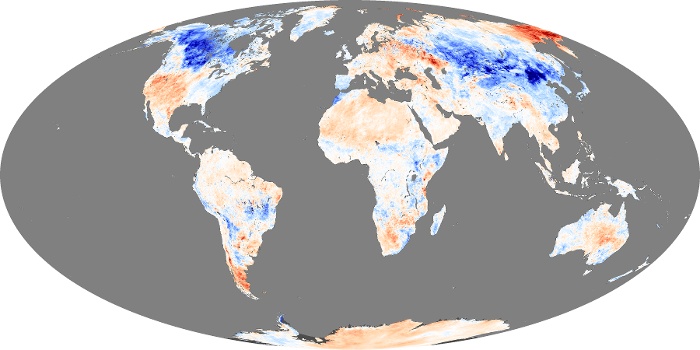
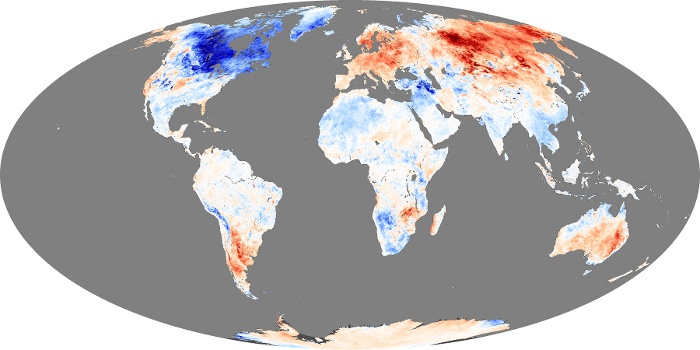
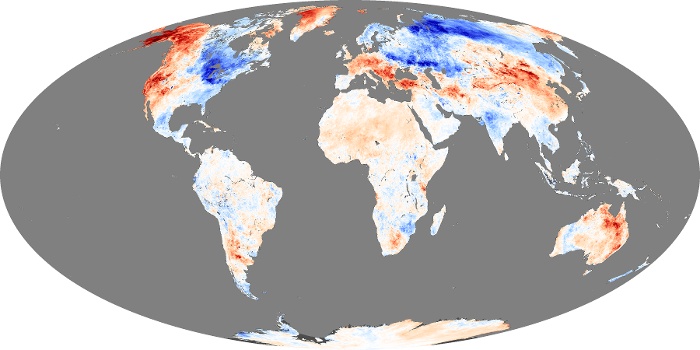
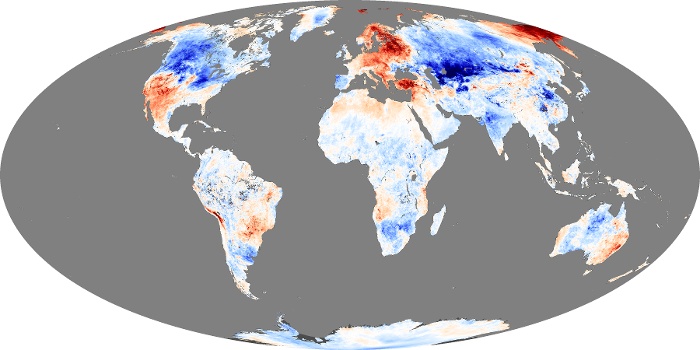
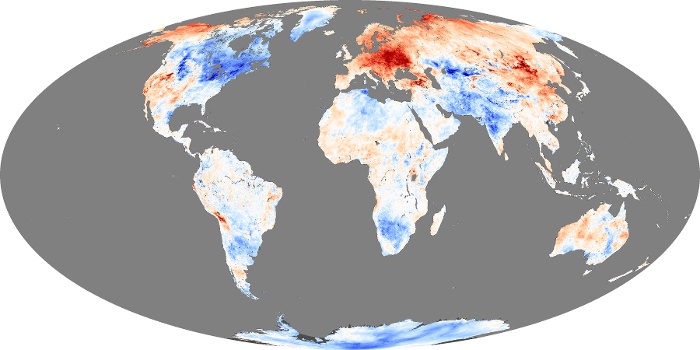
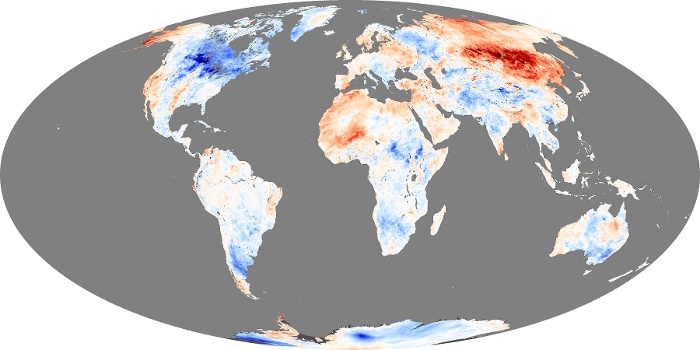
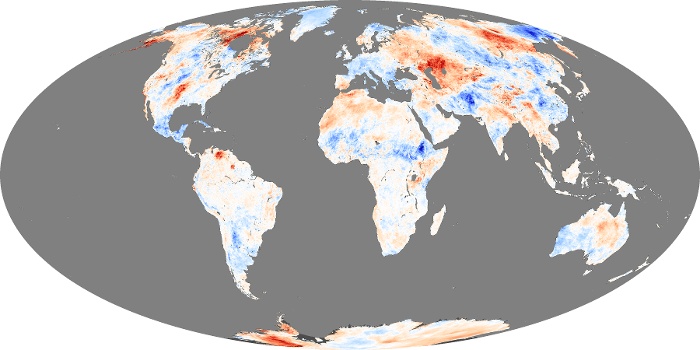
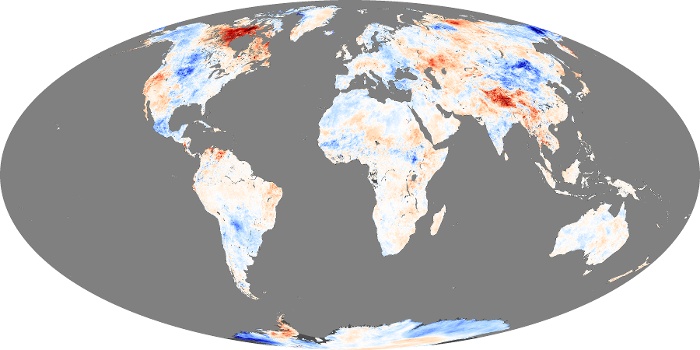
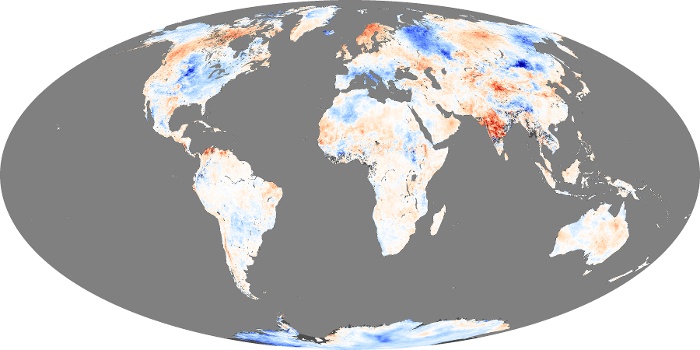
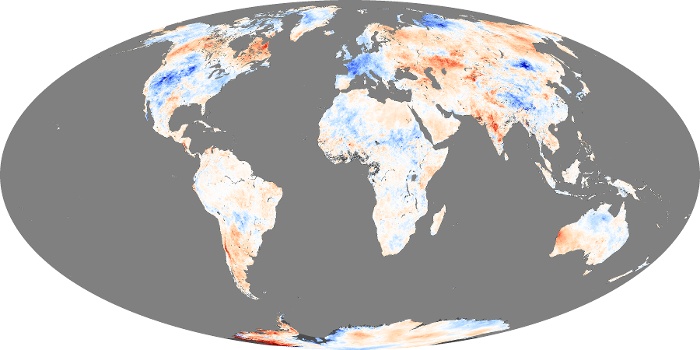
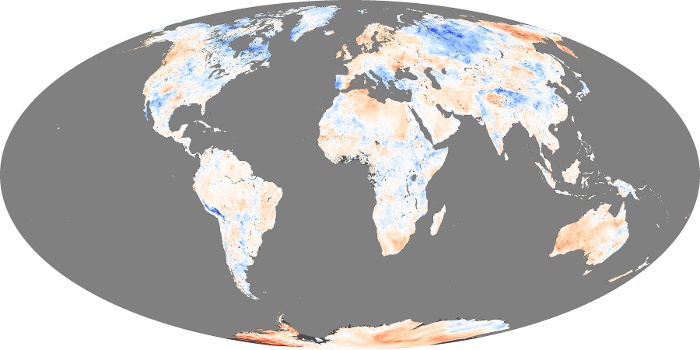
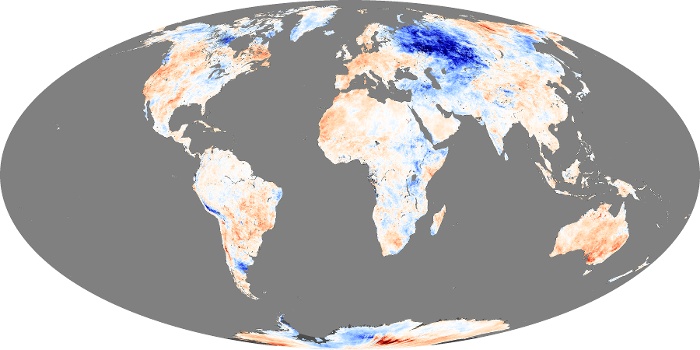
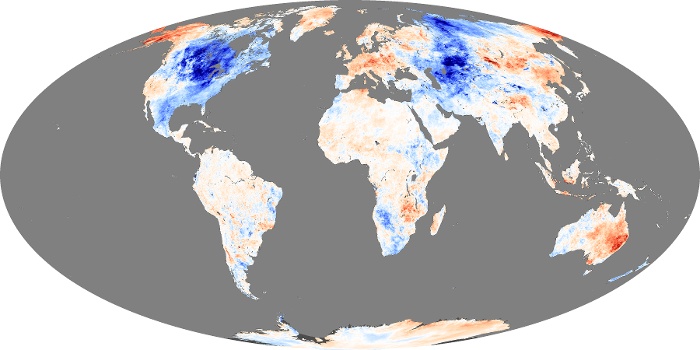
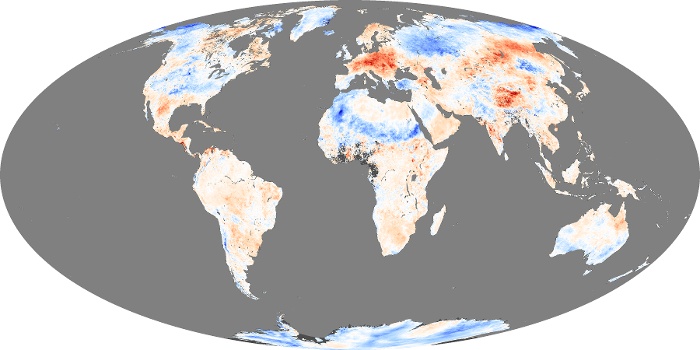
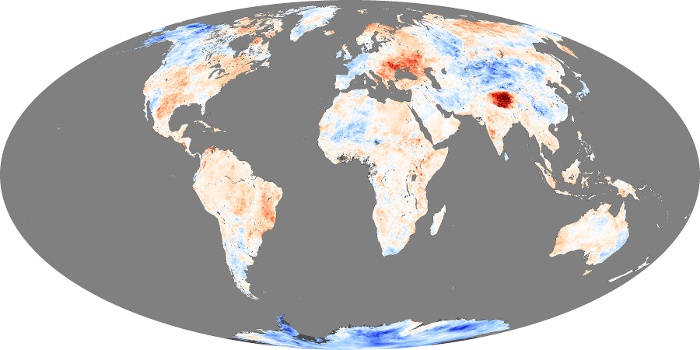
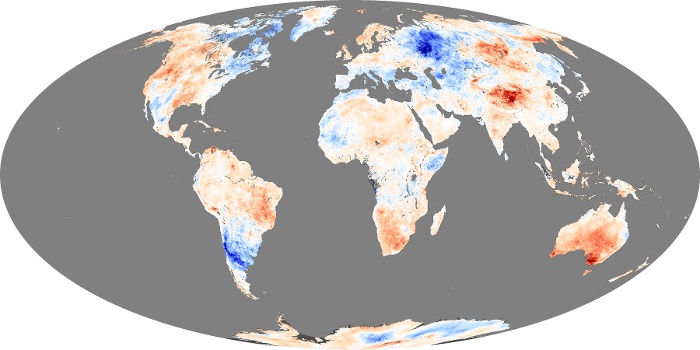
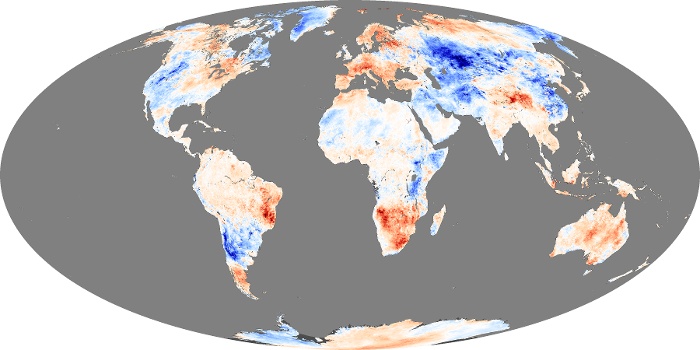
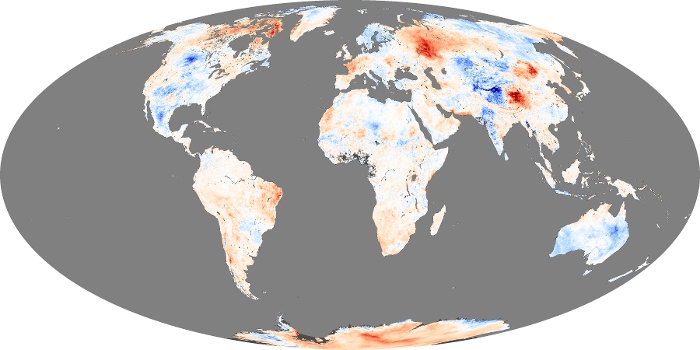
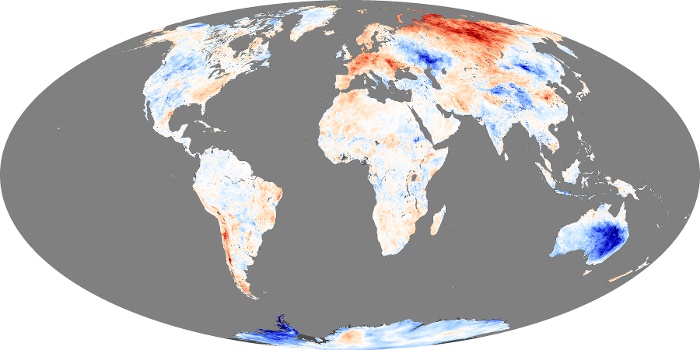
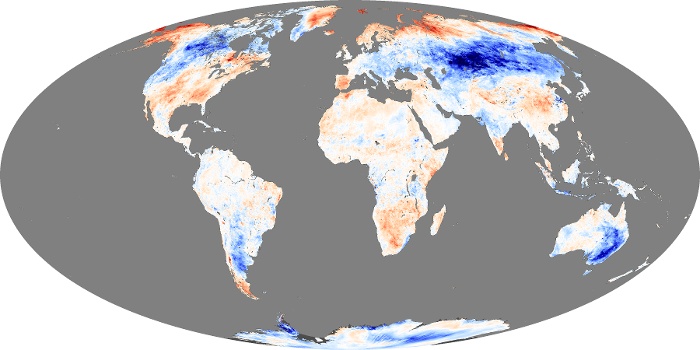
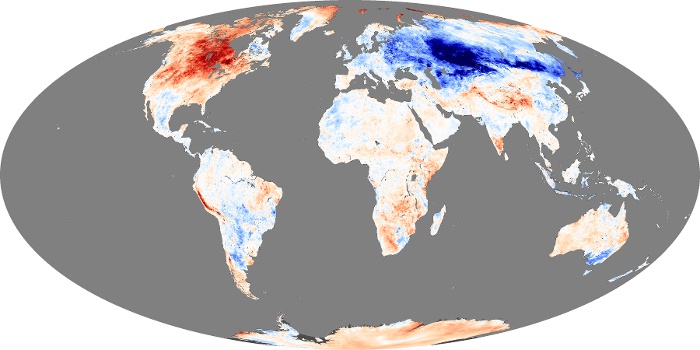
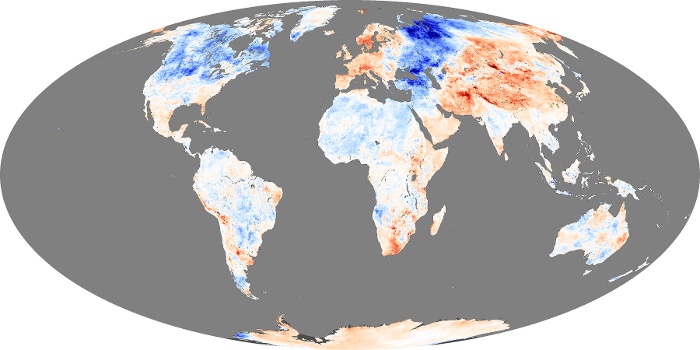
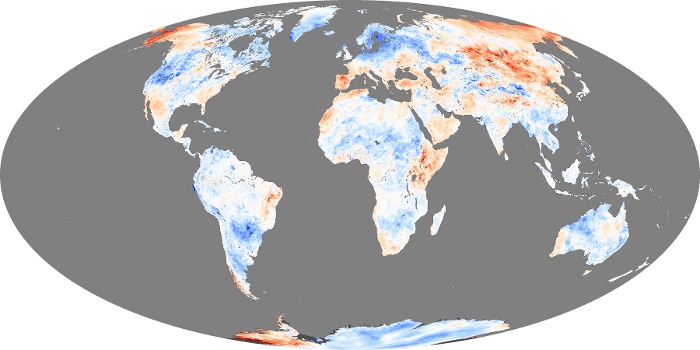
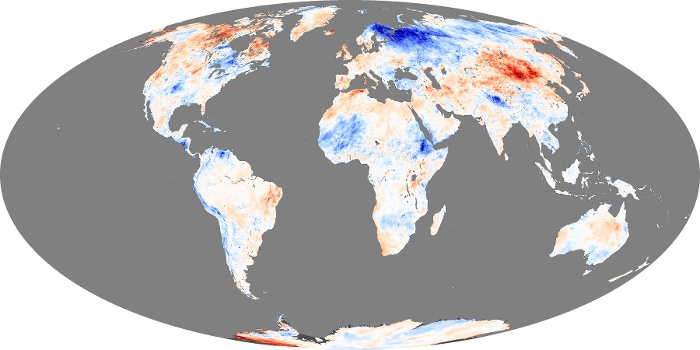
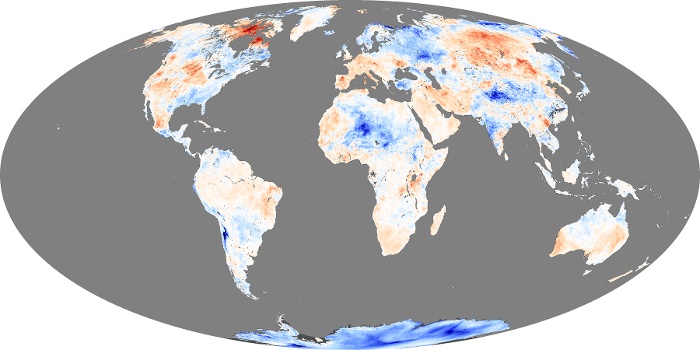
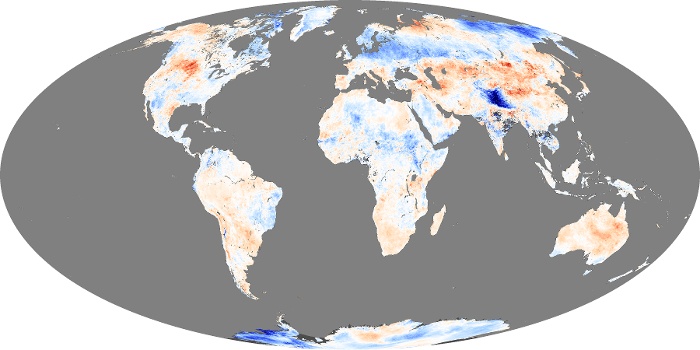
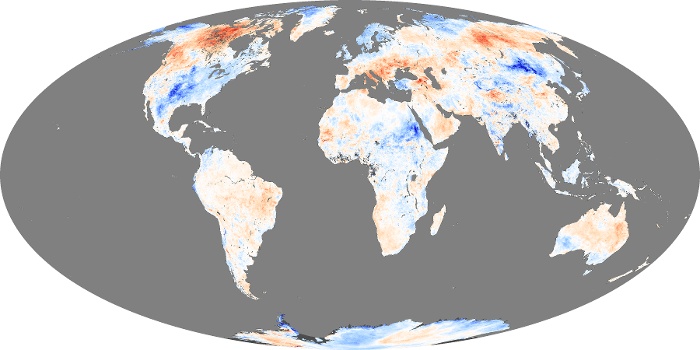
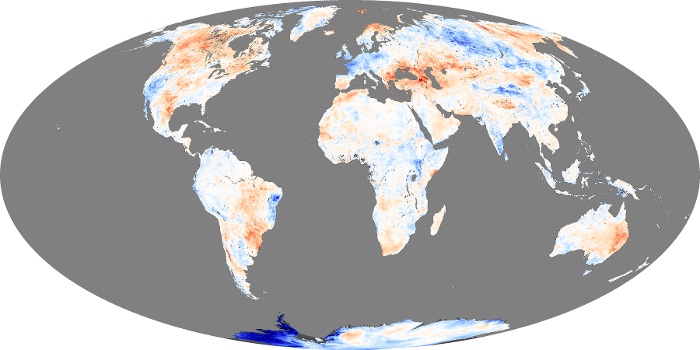
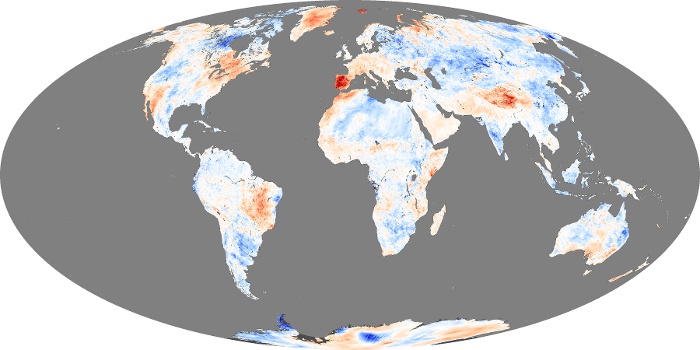
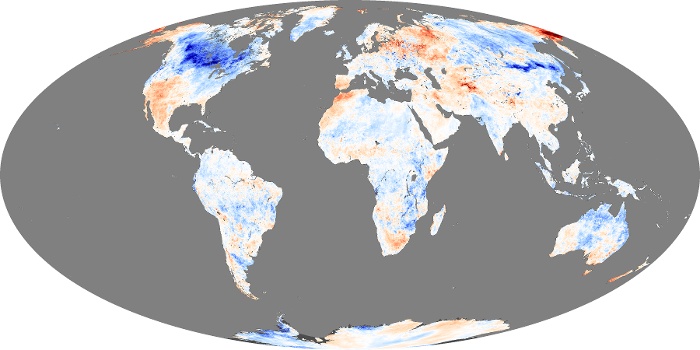
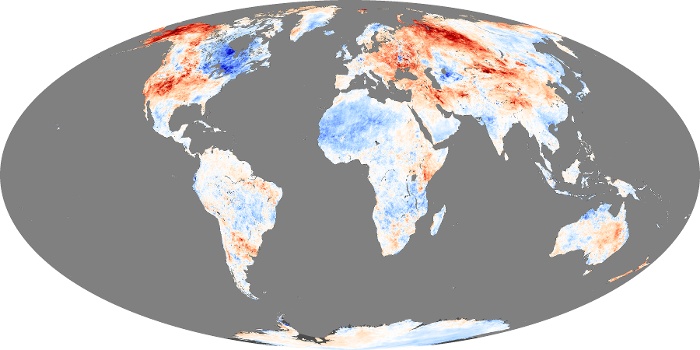
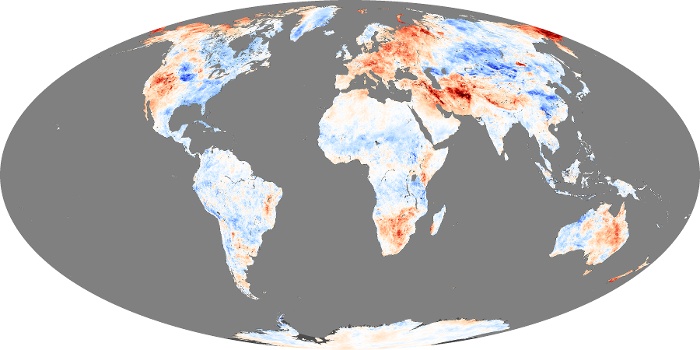
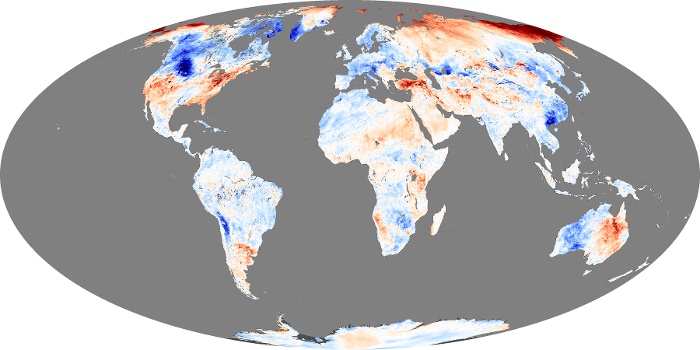
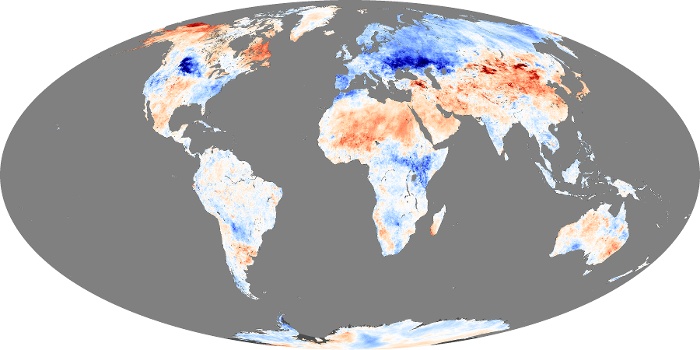
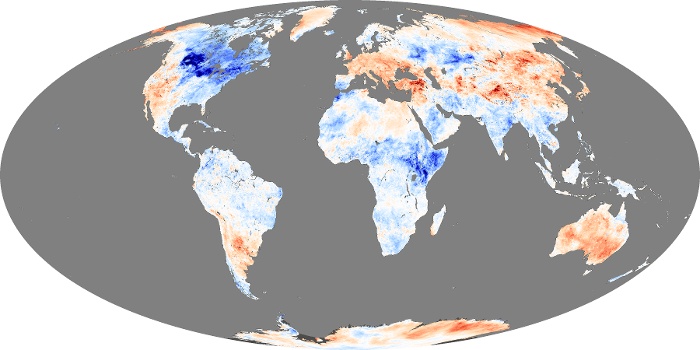
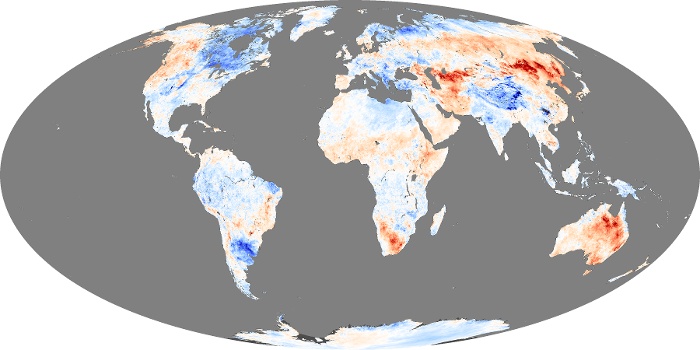
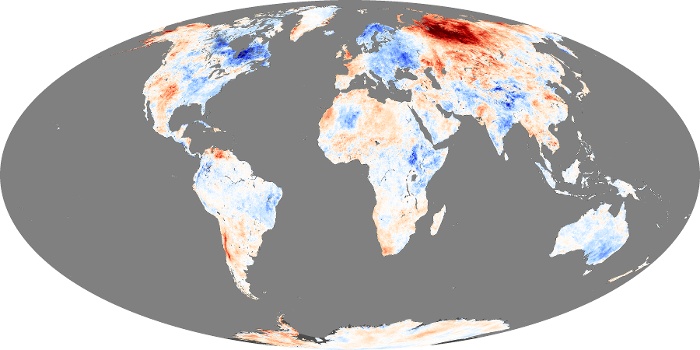
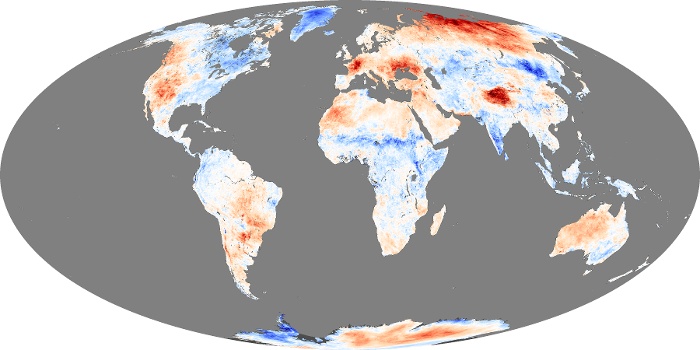
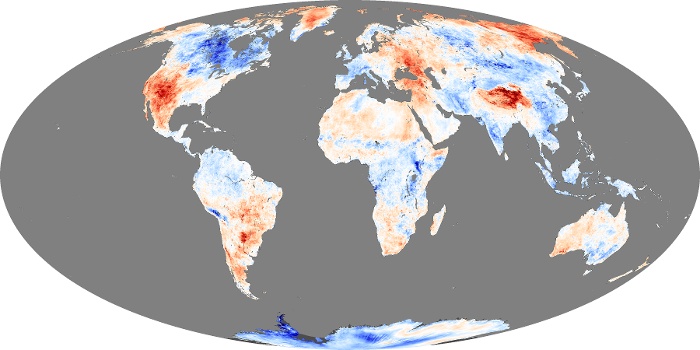
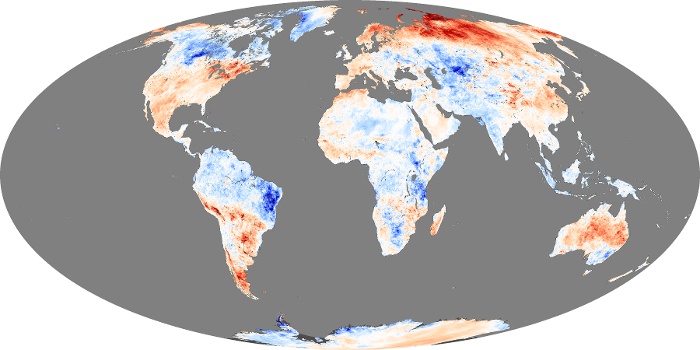
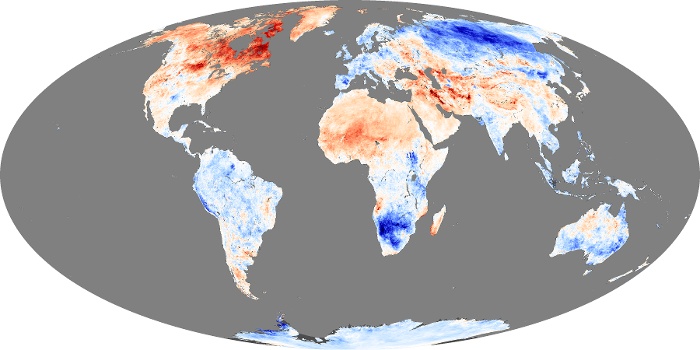
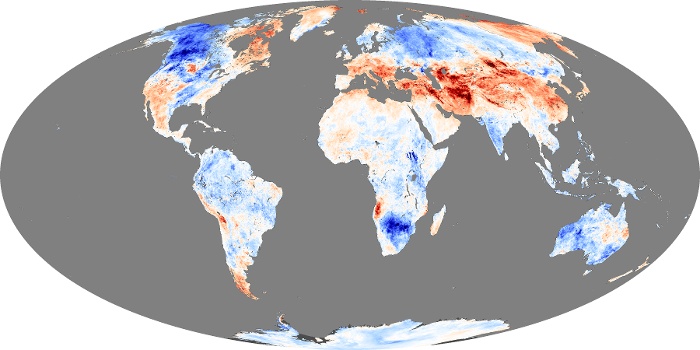
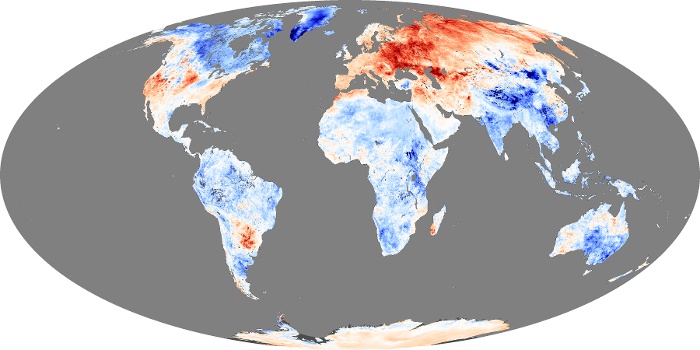
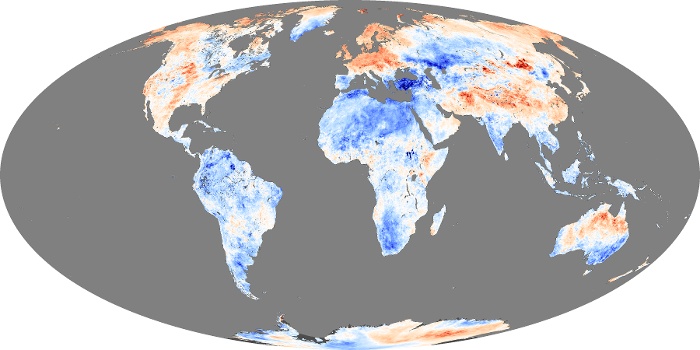
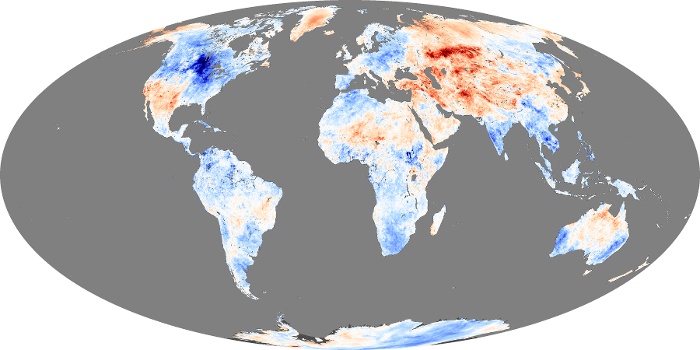
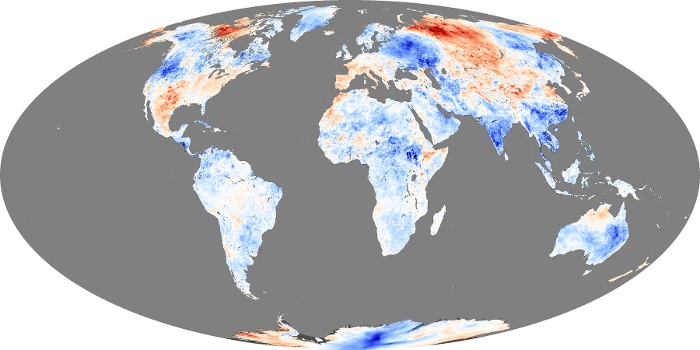
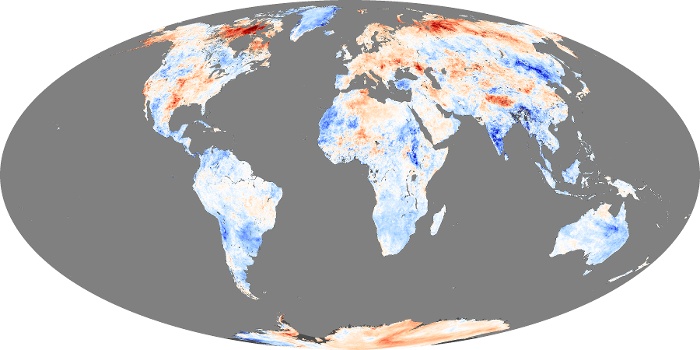
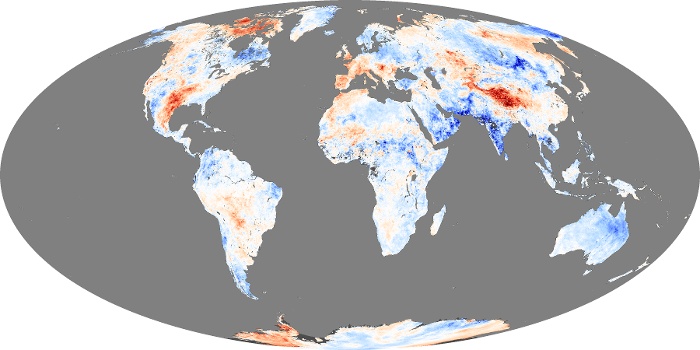
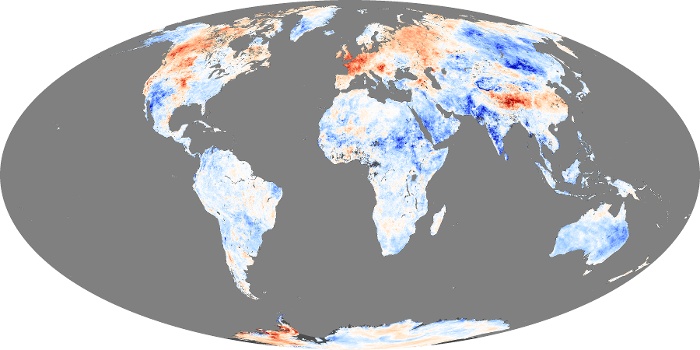
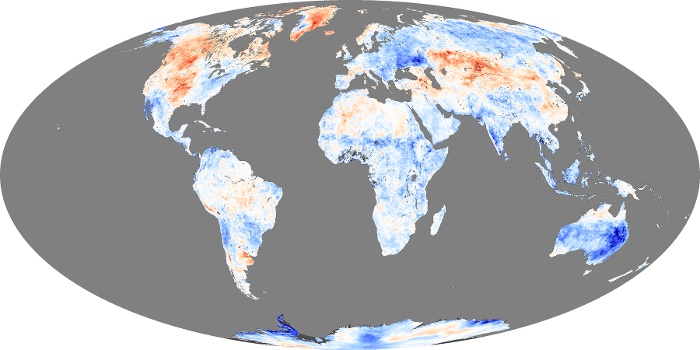
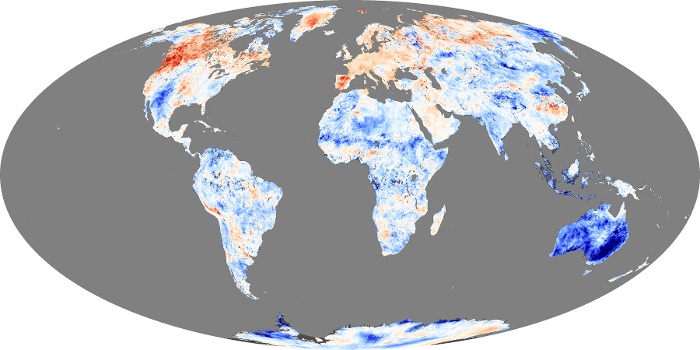
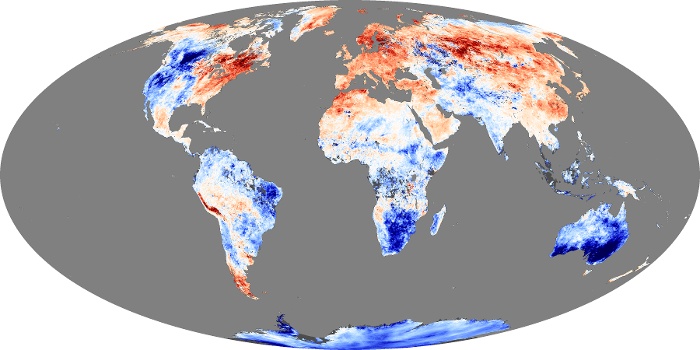
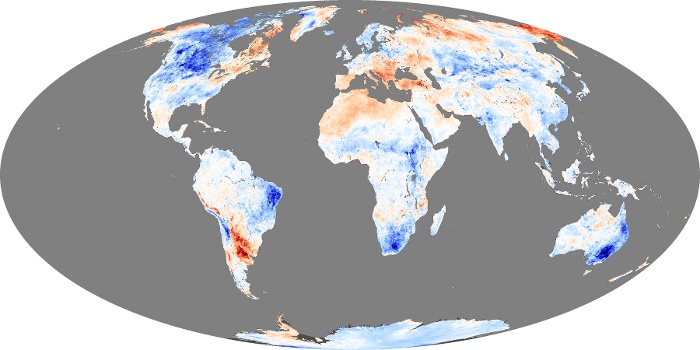
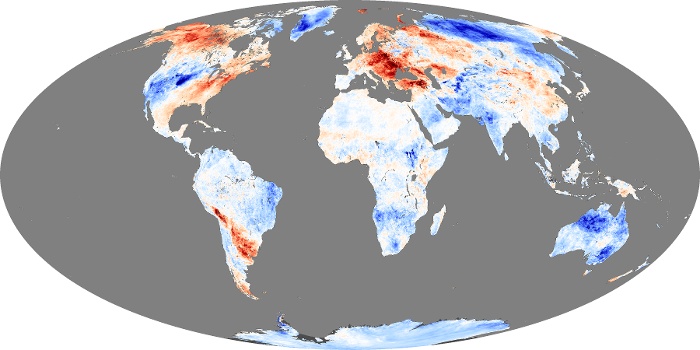
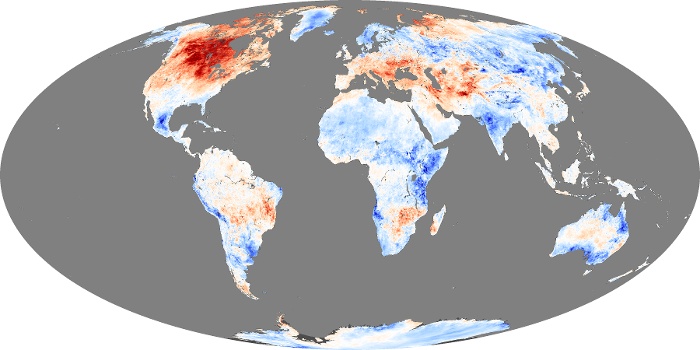
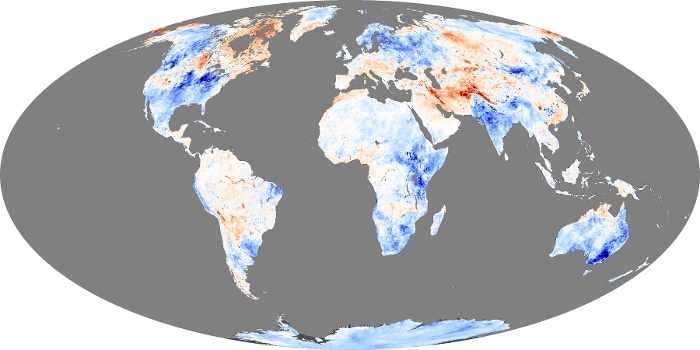
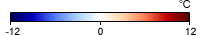
An anomaly is when the conditions depart from average conditions for a particular place at a given time of year. The maps show daytime land surface temperature anomalies for a given month compared to the average conditions during that period between 2000-2008. Places that were warmer than average are red, places that were near normal are white, and places that were cooler than average are blue. The observations were collected by the Moderate Resolution Imaging Spectroradiometer (MODIS) on NASA’s Terra satellite.

Some land surface temperature anomalies are simply random weather phenomena, not part of a specific pattern or trend. Others anomalies are more meaningful. Widespread cold anomalies may be an indication of a harsh winter with lots of snow on the ground. Small, patchy warm anomalies that appear in forests or other natural ecosystems may indicate deforestation or insect damage. Many urban areas also show up as hot spots in these maps because developed areas are often hotter in the daytime than surrounding natural ecosystems or farmland. Warm anomalies that persist over large parts of the globe for many years can be signs of global warming.

View, download, or analyze more of these data from NASA Earth Observations (NEO):
Land Surface Temperature Anomaly