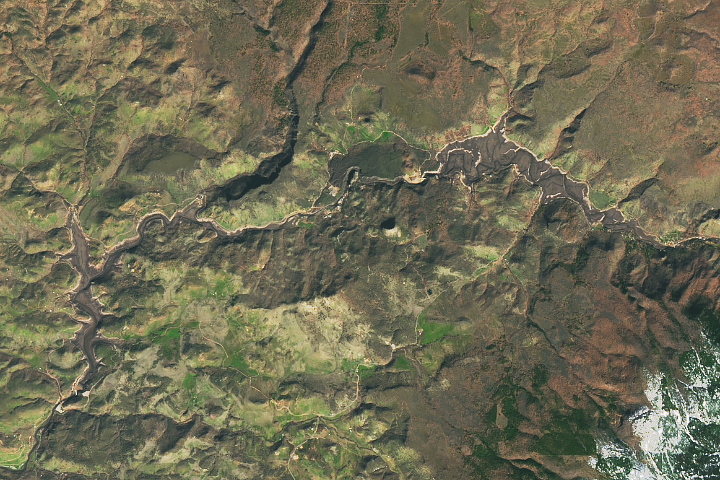
Human-made lakes along the western U.S. river were drained as part of the world’s largest dam removal project to date.
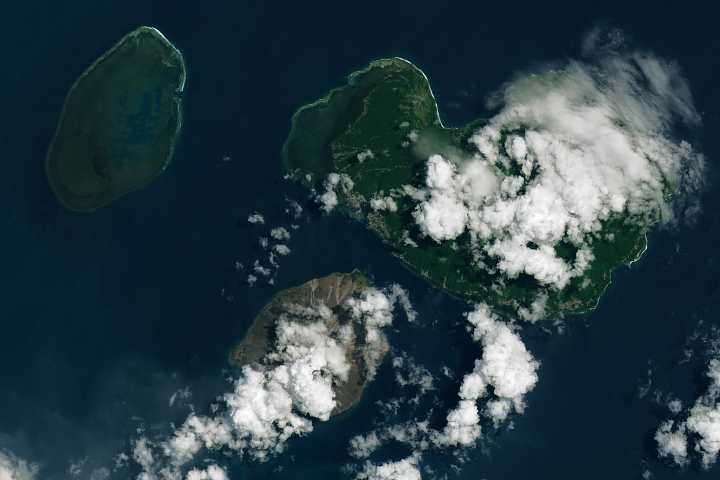
The powerful eruption lofted ash high into the atmosphere and spread tephra and other volcanic debris across the small island in Indonesia.
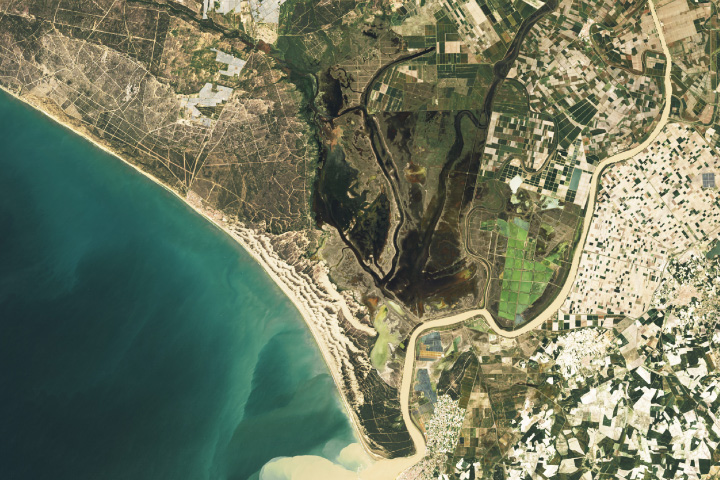
Amid prolonged drought, wet spring weather flooded marshes and greened vegetation in southern Spain.
Published Apr 25, 2024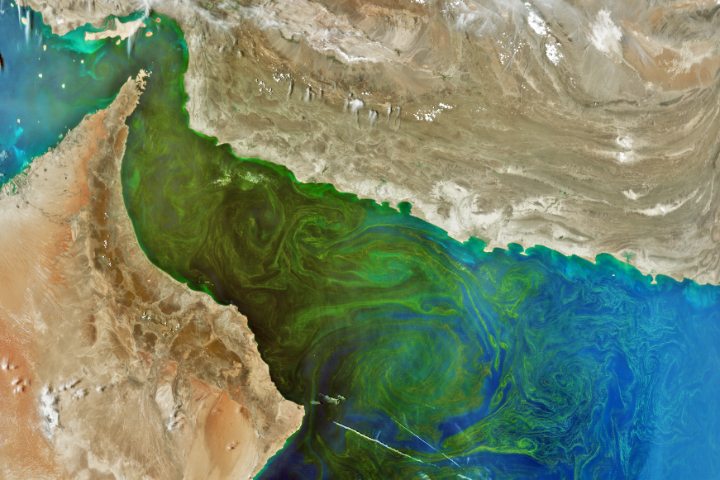
Your challenge is to tell us the location of the satellite image and why it is interesting.
Published Apr 23, 2024
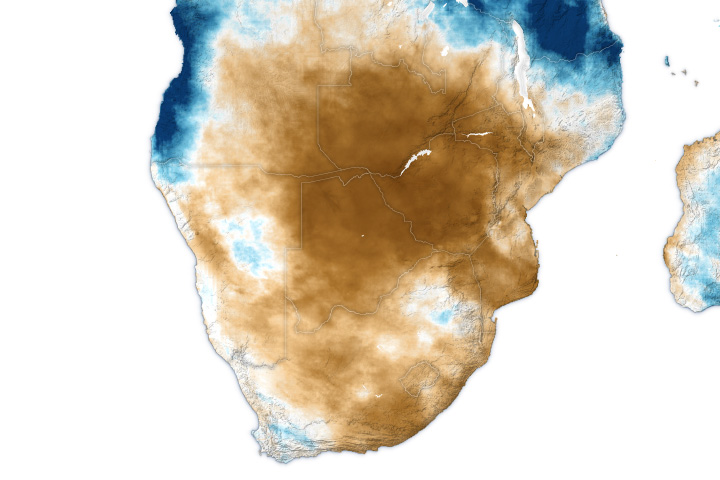
One of the driest growing seasons in decades has decimated crops and left millions hungry.
Published Apr 22, 2024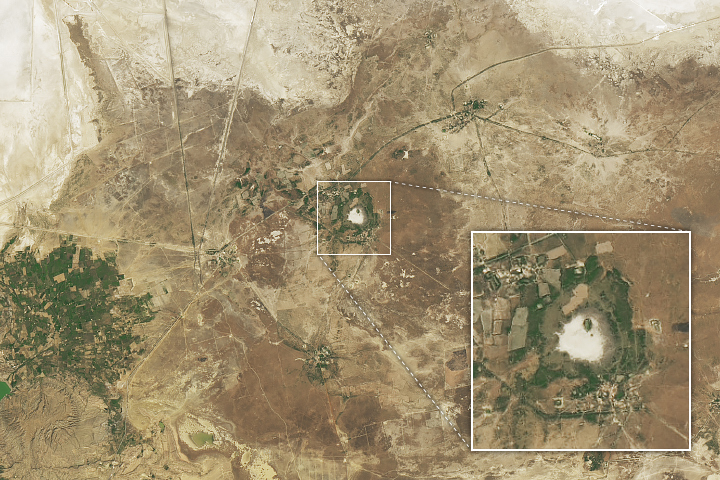
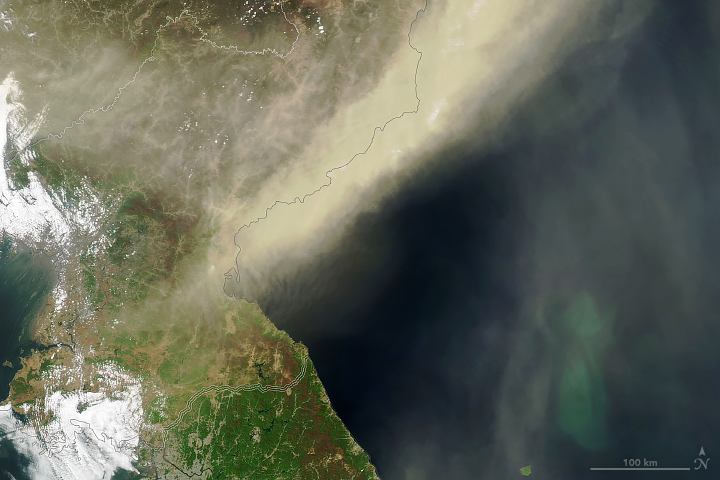
New analysis of a round depression in the salty plains of the Kutch Basin revealed telltale signs of a prehistoric meteorite impact.
Published Apr 22, 2024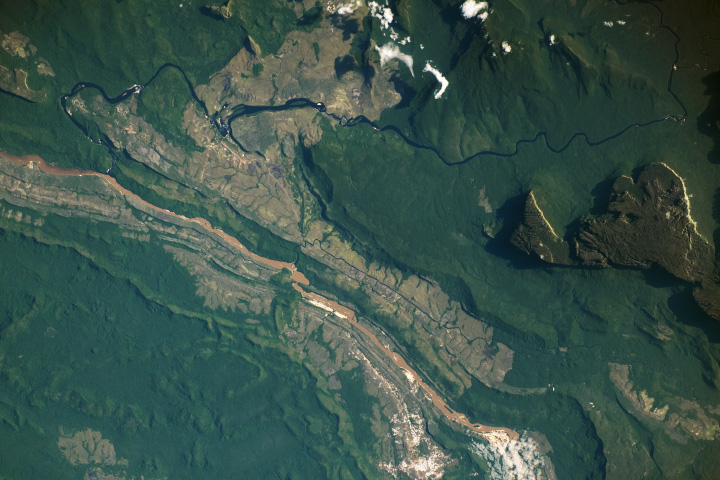
In the country’s southeast, towering table-top mountains known as tepuis host unique species of flora and fauna.
Published Apr 21, 2024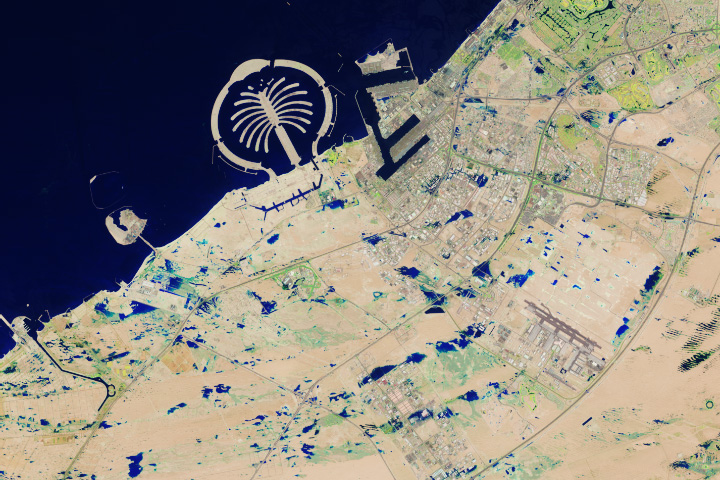
A powerful storm system battered major cities in the Arabian Peninsula.
Published Apr 19, 2024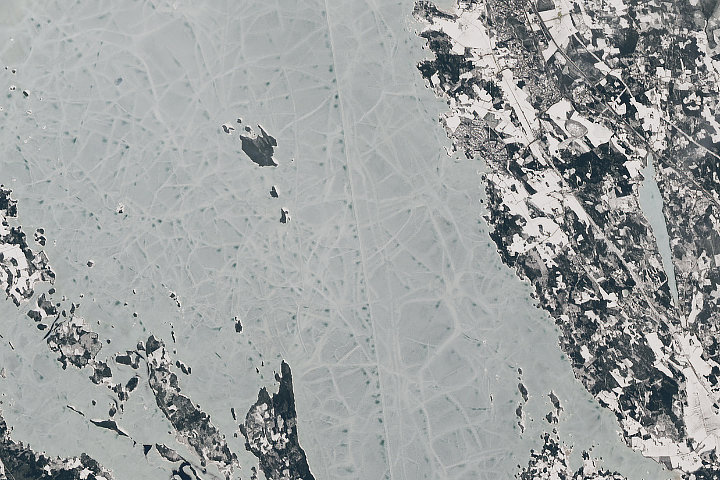
With the help of icebreaking vessels, Saimaa’s icy waters remain navigable for much of the year.
Published Apr 19, 2024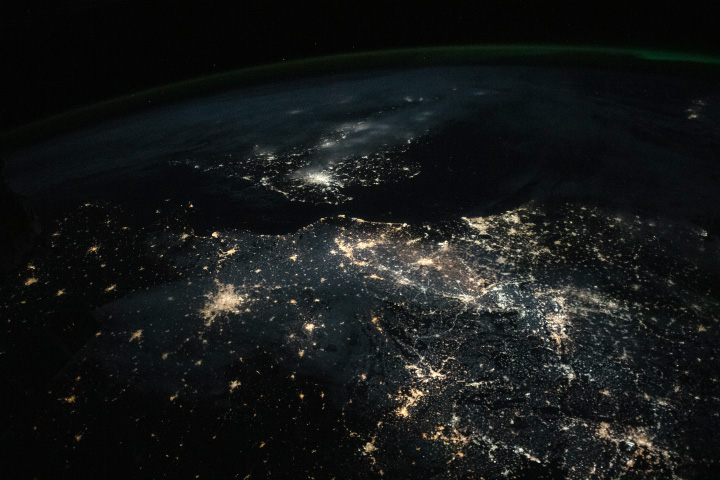
Major cities in northwestern Europe shine bright in this nighttime photo, taken by an astronaut aboard the International Space Station.
Published Apr 18, 2024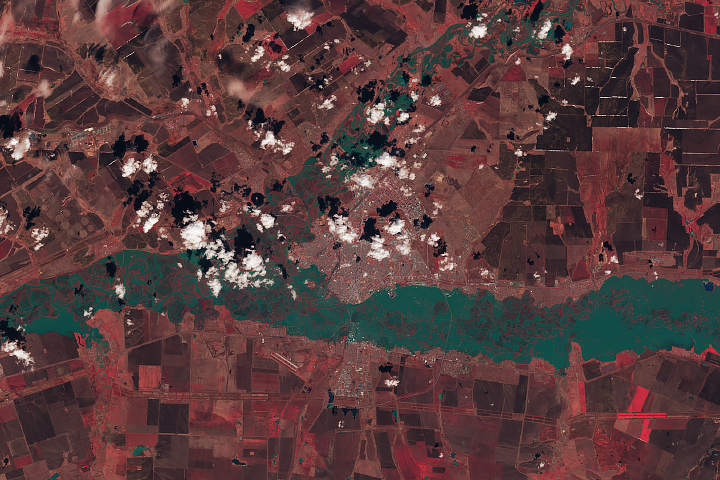
Rivers overtopped their banks and submerged thousands of homes in Russia and Kazakhstan.
Published Apr 16, 2024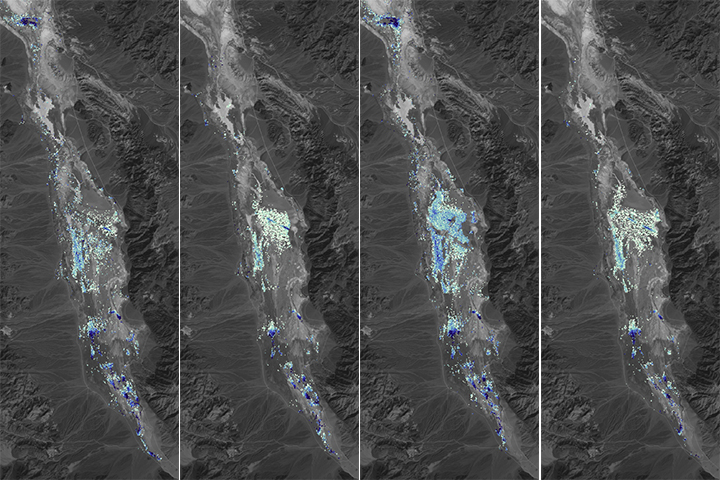
Researchers used satellite data to calculate the depth of water in this transient freshwater body.
Published Apr 16, 2024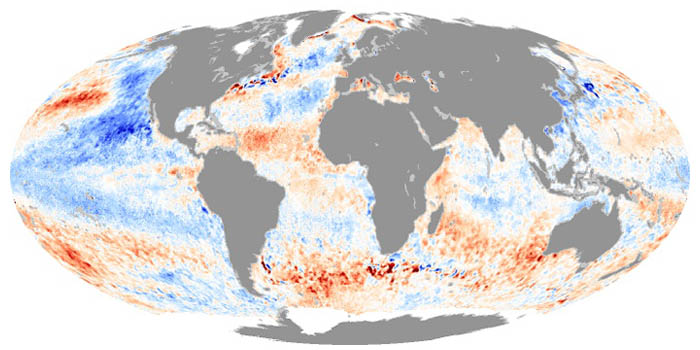
These maps depict how much hotter or cooler an ocean basin was compared to the long-term average. Temperature anomalies can indicate changes in ocean circulation or the arrival of patterns like El Niño and La Niña.
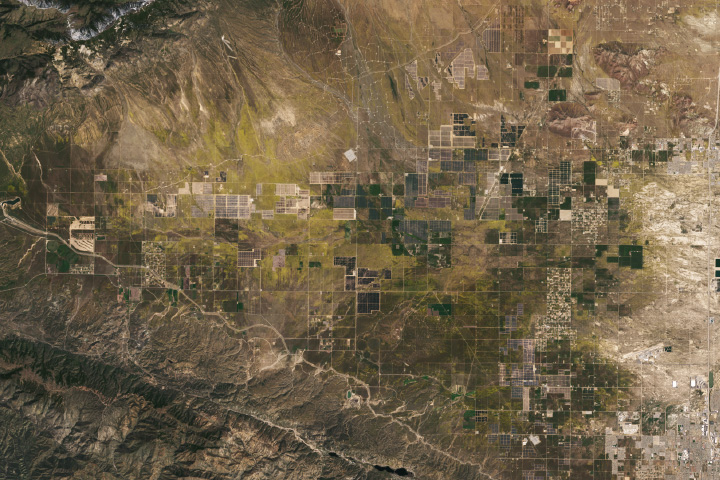
Poppies are sparse, but yellow wildflowers are blooming in Southern California.
Published Apr 15, 2024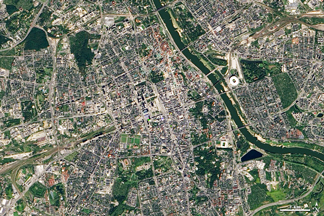
What do you do when presented with a new satellite image? Here's what the Earth Observatory team does to understand the view.
Published Nov 18, 2013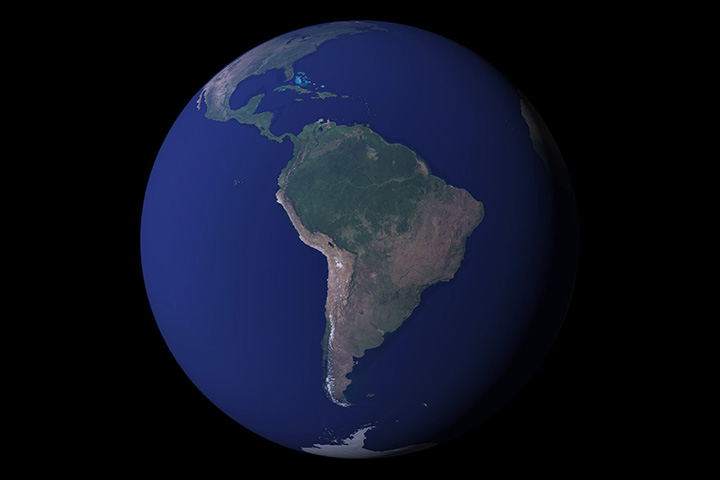
12 months of high-resolution global true color satellite imagery.
Published Oct 13, 2005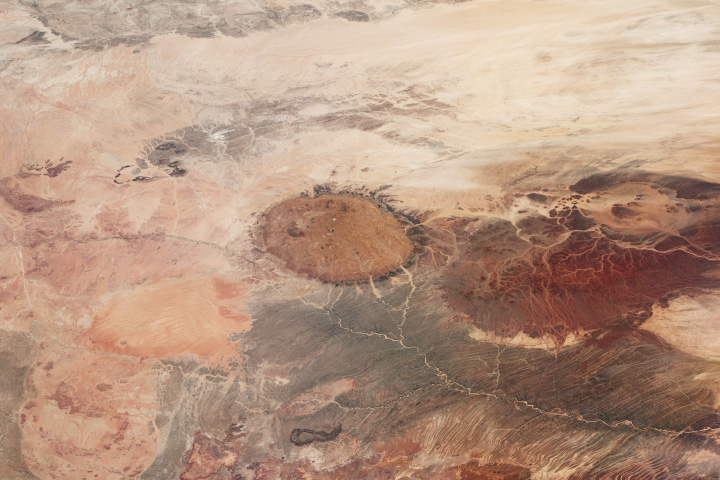
This reddish “burning mountain” of granite is the highest point in Namibia.
Published Apr 14, 2024Have you ever wondered what it would be like to live in a different part of the world? What would the weather be like? What kinds of animals would you see? Which plants live there? By investigating these questions, you are learning about biomes.
Published Aug 28, 2020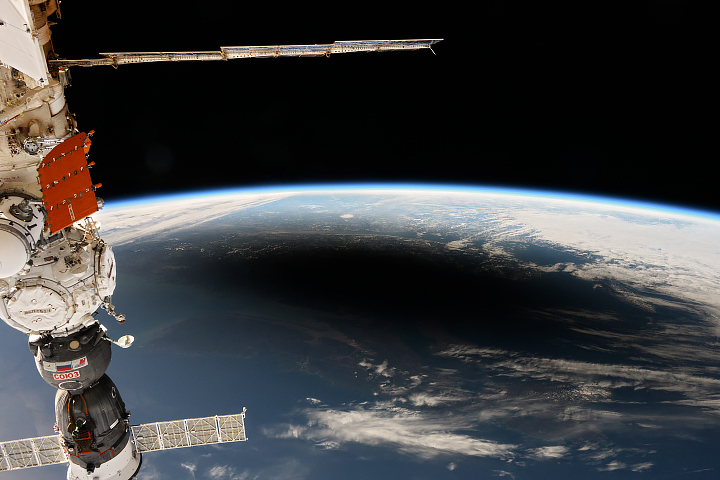
Astronauts and photographers captured unforgettable views of Earth and the Sun as the Moon’s shadow swept across North America.
Published Apr 12, 2024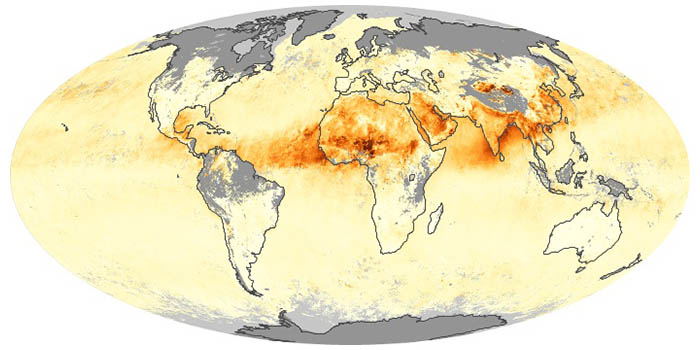
Airborne aerosols can cause or prevent cloud formation and harm human health. These maps depict aerosol concentrations in the air based on how the tiny particles reflect or absorb visible and infrared light.
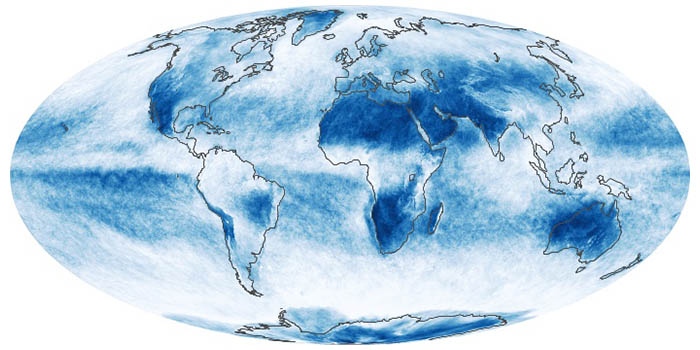
In addition to making rain and snow, clouds can have a warming or cooling influence depending on their altitude, type, and when they form. These maps show what fraction of an area was cloudy each month.
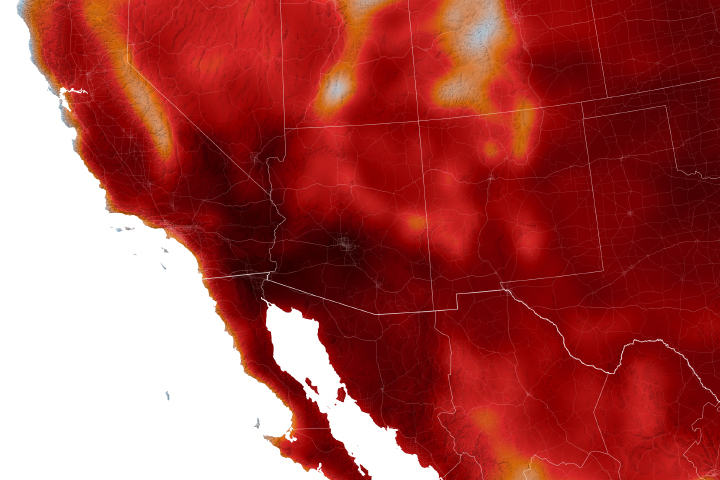
Warmer-than-average temperatures are showing up locally and globally, with consequences for people, landscapes, and ecosystems.
Published Aug 15, 2023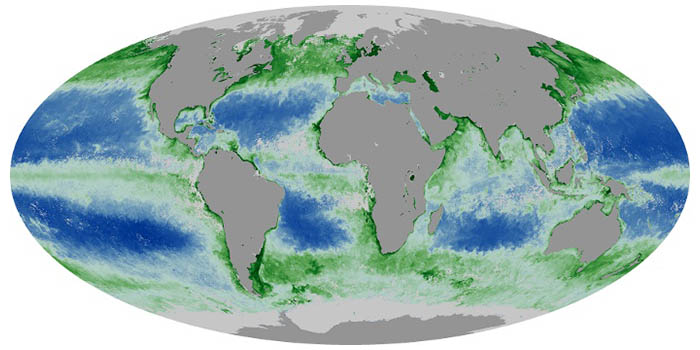
Chlorophyll is used by algae and other phytoplankton--the grass of the sea--to convert sunlight and carbon dioxide into sugars. These maps show chlorophyll concentrations in the ocean, revealing where phytoplankton are thriving.
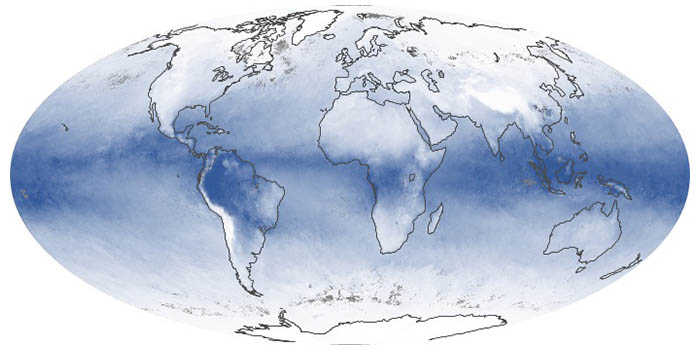
These maps show the average amount of water vapor in a column of atmosphere by month. Water vapor is the key precursor for rain and snow and one of the most important greenhouse gases in the atmosphere.
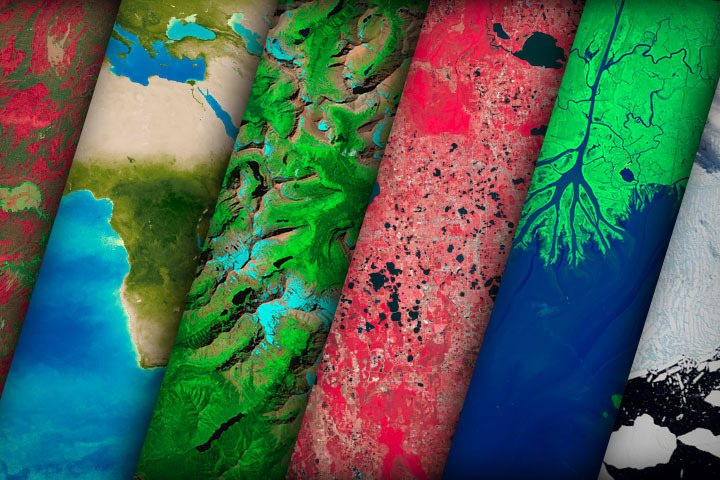
NASA satellites document how our world—forests, oceans, human landscapes, even the Sun—changes over months, seasons, and years.
Published Apr 29, 2009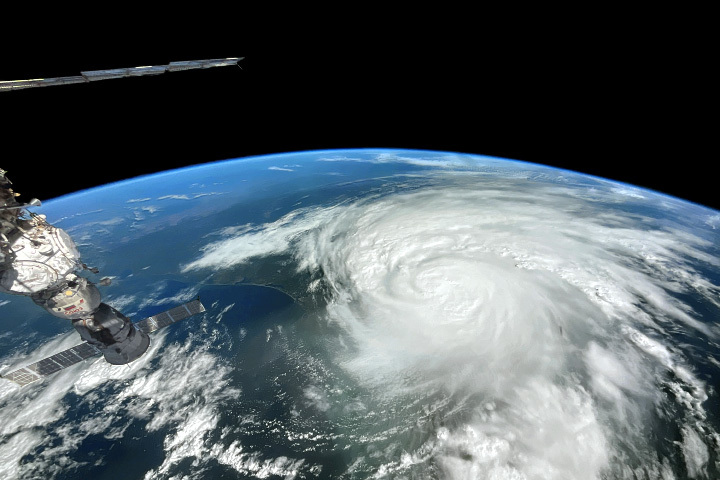
The 2023 season runs from June 1 to November 30, with peak activity generally occurring in September.
Published Jun 1, 2023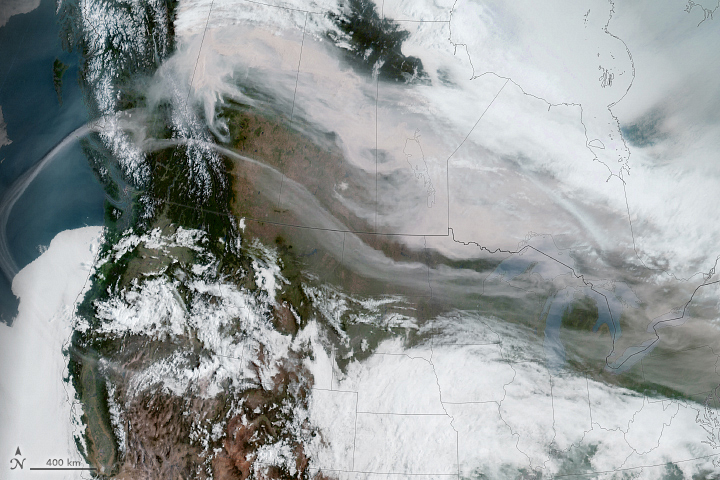
Wildland fires in 2023 brought hazy skies and poor air quality to several countries north of the equator.
Published May 22, 2023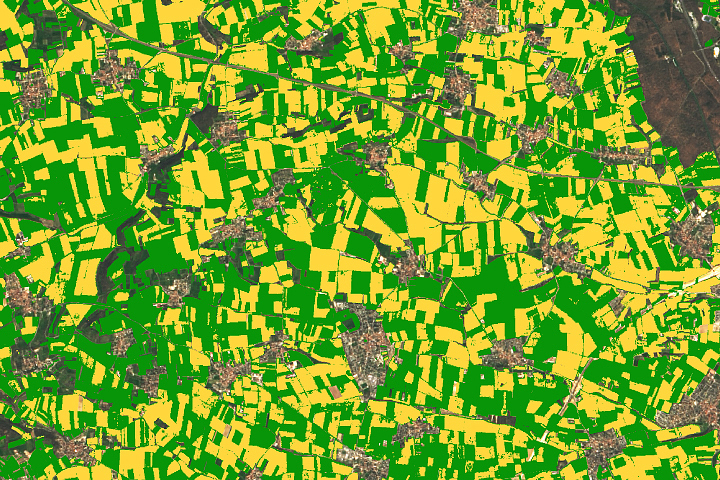
From soil conditions to crop productivity, satellite data help inform farmers, scientists, and decision-makers in the U.S. and around the world.
Published Feb 28, 2023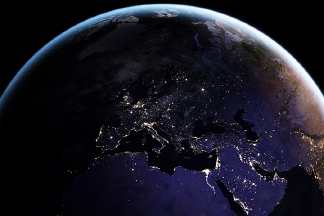
Satellite images of Earth at night have been a curiosity for the public and a tool of fundamental research for at least 25 years. They have provided a broad, beautiful picture, showing how humans have shaped the planet and lit up the darkness.
Published Apr 12, 2017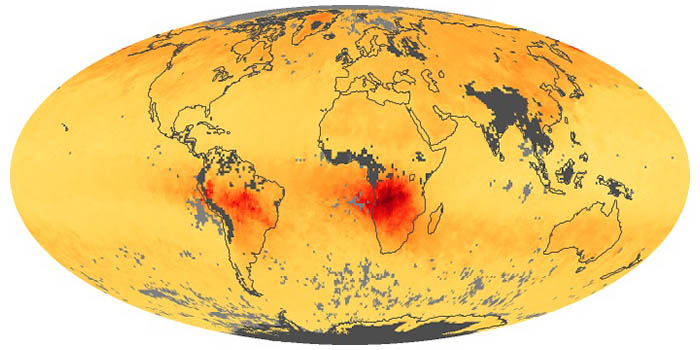
When fuels such as coal, wood, and oil burn incompletely, they produce carbon monoxide. The gas is spread by winds and circulation. These maps show monthly averages of CO in the lower atmosphere.
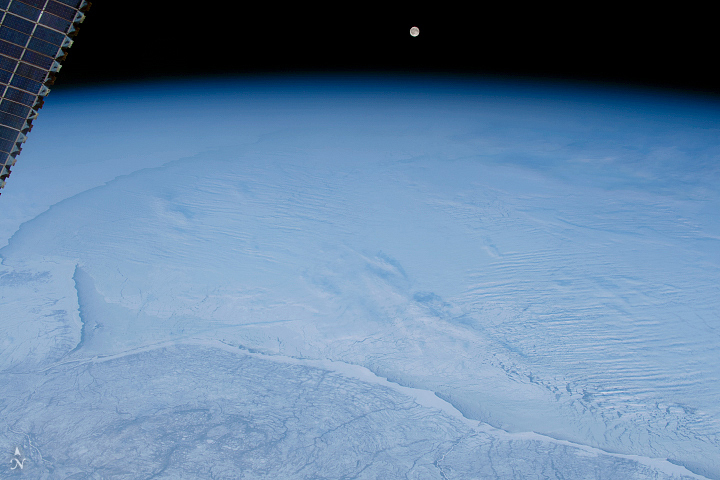
Over the years, astronauts aboard the orbiting laboratory have snapped spectacular photographs of Earth’s snow and ice in both hemispheres.
Published Dec 21, 2022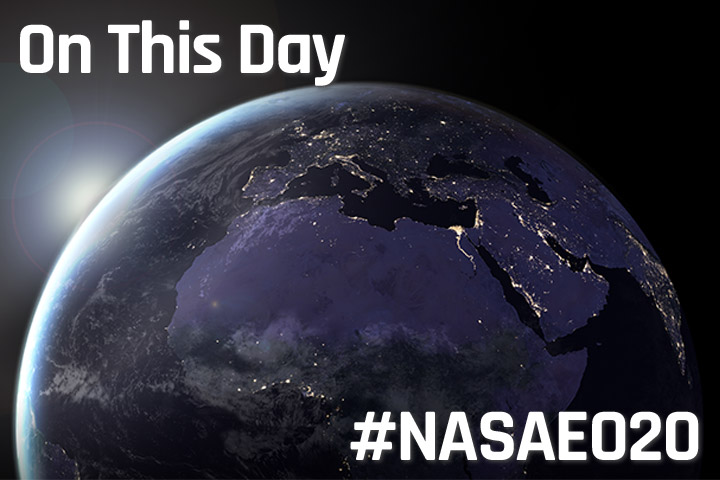
In honor of our site anniversary, we offer a selection of some of the most beautiful, newsworthy, interesting, and scientifically important images from 23 years online — one image for each day of the calendar year.
Published Apr 26, 2022