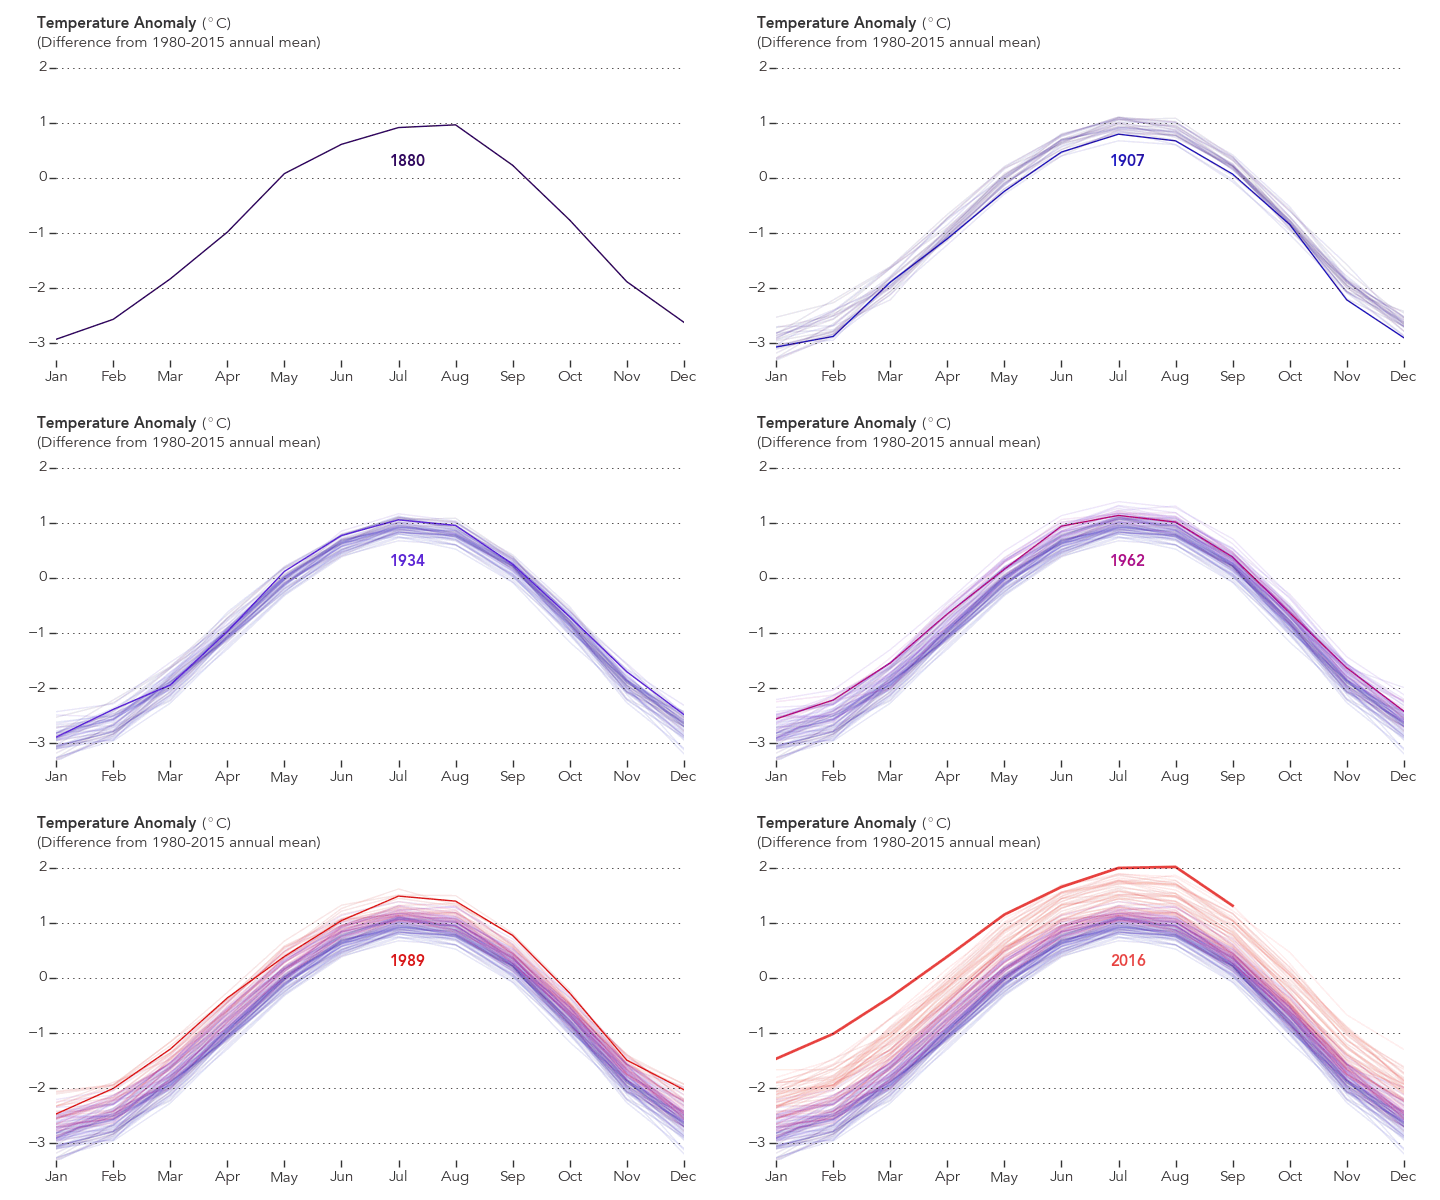
September 2016 was the warmest September in 136 years of modern record-keeping, according to a monthly analysis of global temperatures by scientists at NASA’s Goddard Institute for Space Studies (GISS) in New York.

NASA Earth Observatory chart by Joshua Stevens, based on data from the NASA Goddard Institute for Space Studies.
September 2016’s temperature was a razor-thin 0.004 degrees Celsius warmer than the previous warmest September in 2014. The margin is so narrow those two months are in a statistical tie. Last month was 0.91 degrees Celsius warmer than the mean September temperature from 1951-1980.
The record-warm September means 11 of the past 12 consecutive months dating back to October 2015 have set new monthly high-temperature records. Updates to the input data have meant that June 2016, previously reported to have been the warmest June on record, is, in GISS’s updated analysis, the third warmest June behind 2015 and 1998 after receiving additional temperature readings from Antarctica. The late reports lowered the June 2016 anomaly by 0.05 degrees Celsius to 0.75.
“Monthly rankings are sensitive to updates in the record, and our latest update to mid-winter readings from the South Pole has changed the ranking for June,” said GISS director Gavin Schmidt. “We continue to stress that while monthly rankings are newsworthy, they are not nearly as important as long-term trends.”
The monthly analysis by the GISS team is assembled from publicly available data acquired by about 6,300 meteorological stations around the world, ship- and buoy-based instruments measuring sea surface temperature, and Antarctic research stations. The modern global temperature record begins around 1880 because previous observations didn’t cover enough of the planet. Monthly analyses are updated when additional data become available, and the results are subject to change.
Related Links
+ For more information on NASA GISS’s monthly temperature analysis, visit: data.giss.nasa.gov/gistemp.
+ For more information about how the GISS analysis compares to other global analysis of global temperatures, visit:
http://earthobservatory.nasa.gov/blogs/earthmatters/2015/01/21/why-so-many-global-temperature-records/
+ To learn more about climate change and global warming, visit:
http://earthobservatory.nasa.gov/Features/GlobalWarming/


A couple of interesting coincidences also can be seen in this graphic. Note that the biggest variation in temperature starts at the same time satellite data becomes available (late 1970s) and simultaneous transition from global weather stations to that satellite data – means it is exclusively controlled by only a few governments. Doesn’t mean it isn’t representative or inaccurate (although there are numerous climate scientist criticisms of accuracy between different satellites and satellite systems and their intercalibrations), just noting the coincidence.
“The monthly analysis by the GISS team is assembled from publicly available data acquired by about 6,300 meteorological stations around the world, ship- and buoy-based instruments measuring sea surface temperature, and Antarctic research stations. ”
So, tell me ~ when did any of these ground based stations become statistically relevant?
The ground based measurements account for a few tens of thousands of readings, and the satellite measurements involve MILLIONS of readings at various altitudes ~
in the same time periods.
What is there about the ground based readings that makes them in any way superior to the satellite measurements?