

 |
by Michon Scott 25 February 2003 |
||
| Footprints of the Laetoli trackway in Tanzania show some of the earliest lasting human impact. Image Copyright © The J. Paul Getty Trust, 1995. All rights reserved. | |||
|
While teaching a class in Nairobi in summer 2002, conservationist Eric Sanderson heard a familiar story. The woman who organized the course told him that when she was little, her father would take her to a nearby place to watch elephants and giraffes. Now, the area is a suburban banking center.
“I talk to people from all over the world, and many of them tell the same story,” said Sanderson, associate director of the Landscape Ecology and Geographic Analysis Program at the Wildlife Conservation Society. “They say, ‘I grew up in this place and had nature all around me, but it’s changed now.’”
|
 |
||
|
The people Sanderson talks to are not imagining these changes. In North America, the black-tailed prairie dog occupies as little as 5 percent of its former habitat. In Madagascar, more than 20 lemur species are threatened with extinction, and at least 15 species are already extinct. And on the island of Mauritius in the Indian Ocean, fewer than 50 mature mandrinette hibiscus plants remain in the wild.
|
|||
|
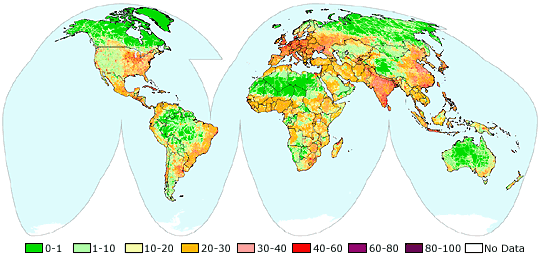
These organisms share a common threat: human impact, usually in the form of habitat destruction, eradication efforts, overharvesting, and the introduction of invasive species. Though conservationists have long been concerned about the impact of human activity, a lack of quantifiable data has historically hampered efforts to achieve conservation goals. “I’m convinced that we’re in a weird paradox,” said Marc Levy, co-project scientist at the Socioeconomic Data and Applications Center (SEDAC) at Columbia University. “The international community has finally started taking sustainable development seriously, but now ecosystem preservation is fading into the background. While we’ve had clear, quantitative targets set for poverty reduction, literacy, and health care, biodiversity benchmarks have been very vague.” Now, Sanderson, Levy, and collaborators have taken an important step in resolving that vagueness. They have produced two complementary global maps: The Human Footprint and The Last of the Wild. Until recently, compiling global maps of human influence simply wasn’t possible, but the 1990s brought substantial technological advances. Satellite data facilitated the production of global land use and land cover maps, and geographic information systems allowed researchers to integrate satellite and population data efficiently. Using these technologies, Sanderson and his collaborators chose four types of data to measure human influence: population density, land transformation, human access, and power infrastructure. Increased human population often leads to greater influence on the environment and sharper declines in species and ecosystems. According to the authors of the human footprint study, however, land transformation probably poses the single greatest threat to biodiversity, resulting in habitat loss and/or fragmentation for wild species. Beyond its effects on the nearby area, it can have global consequences, such as worldwide changes in soils and increased demand for fresh water for irrigation. The authors also found that the greater the human access through roads, rivers, and coastlines, the greater the likelihood of resource extraction, pollution, and the introduction of invasive species. Both human access and land transformation have been fueled by increased power infrastructure (access to fossil fuel and electrical power) over the last century. Throughout most of human history, impact on the environment was constrained by raw human and animal muscle power. But today, one person with a bulldozer can match the power of 300 horses. The researchers measured these four variables using nine data sets, assigning each locality a numerical value between 0 (minimum) and 10 (maximum). Next, they summed the scores for all the data sets. Brownsville, Texas, was the only area to reach the maximum score for human influence on the environment, though most of the world’s largest cities fell within the top 10 percent. Sanderson and his collaborators found that 83 percent of Earth’s land surface (98 percent where rice, wheat, or maize can be cultivated) is directly influenced by human activity. “But different ecosystems respond to human activity in different ways,” said Sanderson. To account for these differences, the scores needed refinement. Biologists have divided the terrestrial portions of the Earth into biomes, regions characterized by specific climatic conditions and by certain types of life, especially vegetation. For each biome, as defined by the World Wildlife Fund - U.S. Conservation Science Program, Sanderson and his collaborators mapped the original scores to a new scale of 0 to 100. (Because each biome has an independent scale, a score of 50 in a desert might indicate a very different level of human influence than the same score in a grassland environment.) The resulting human footprint is a quantitative measurement of humanity’s impact on the Earth’s land surfaces. |
Prairie dogs, lemurs, and mandrinette hibiscus plants are just a few of the species affected by human activity. (Image credits clockwise from top right: Wind Cave National Park, Smithsonian National Zoo: Great Apes and Other Primates: Lemurs, and IUCN Red List of Threatened Species Copyright © Wendy Strahm. A new browser window will open for each.) | ||
 |
|||
|
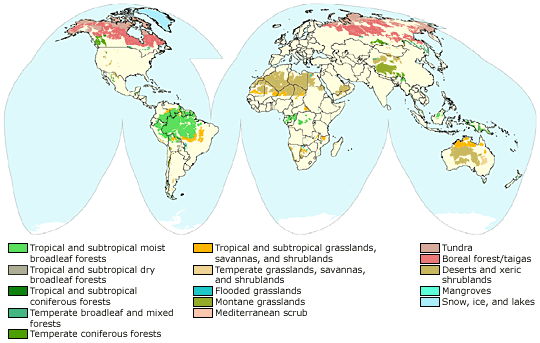
Completion of the human footprint map marks major progress in conservation efforts. Ruth DeFries, associate professor at the University of Maryland, College Park, said, “Each of the supporting data sets used to map the human footprint represents an enormous investment by scientists in that discipline. By bringing those data sets together, the human footprint gives an interesting overview of the regions on Earth where humans have the greatest and the least presence.” “The main virtue of the human footprint is that it’s open to improvement. Other researchers can duplicate our results, or substitute improved data,” said Levy. He pointed out another unusual feature. “These maps were created without government funding and have been made available by choice, and using SEDAC to distribute our data has been critical to the project.” Sanderson and his collaborators acknowledge, however, that the map is not a perfect picture. It includes only land surfaces — not oceans, lakes, or rivers — and it excludes Antarctica and many small Pacific islands. The map also uses a coarser scale than most conservation studies, and it contains inaccuracies at the local level. Moreover, focusing on different parameters can yield different conclusions. Two months after the human footprint was completed, Conservation International released a study concentrating on population density and plant cover without examining human land usage to the same extent as Sanderson and his collaborators. Whereas Sanderson’s team found human impact on most of the Earth’s land surfaces, the new study suggested that nearly half the land on Earth is still wild. “Different conservation organizations have different ways of looking at the world, and they measure different factors,” said Sanderson. “But we all share the same goals of conserving biological diversity and saving wild places and wildlife.” Finding Earth’s remaining wildlife, or the last of the wild, is the flip side of the human footprint. Sanderson and his collaborators found minimal human impact in the Arctic tundra, the boreal forests of Canada and Siberia, the deserts of Africa and central Australia, and the Amazon Basin. They also found reduced impact along many national boundaries. “An interesting phenomenon is that countries tend to develop more infrastructure in the middle of their territories than along the borders. Because there’s less competition between people and wildlife, those border areas become important for conservation,” Sanderson explained. Some countries, such as Mozambique and South Africa, have established transnational peace parks across their shared borders to preserve natural habitat. To find the best places to preserve wildlife, the researchers searched the human footprint for the top 10 percent of the wildest areas in each biome. From 568 locations, they selected the 10 largest contiguous areas. While some of those areas cover more than 100,000 square kilometers (38,610 square miles), other biomes have no undisturbed wild areas larger than 5 square kilometers (3.1 square miles). (The Wildlife Conservation Society has made the complete list available through its Web site.) |
The Human Footprint is a quantitative analysis of human influence across the globe. In this map, human impact is rated on a scale of 0 (minimum) to 100 (maximum) for each terrestrial biome. A score of 1 indicates the least human influence in the given biome. However, because each biome has its own independent scale, a score of 1 in a tropical rainforest might reflect a different level of human activity than in a broadleaf forest. (Image courtesy of Sanderson et al.) Click here for a high-resolution image (101 KB).
For more information, visit: The Human Footprint and the Last of the Wild in Bioscience The Human Footprint from the Wildlife Conservation Society Last of the Wild from the Center for International Earth Science Information Network (CIESIN) Socioeconomic Data and Applications Center (SEDAC) (A new browser window will open for each.) |
||
 |
|||
|
“It’s important to conserve these remaining wild places, and not solely because of moral or aesthetic values,” said Sanderson. “Preserving places that are already wild is the most practical thing to do. Fewer people, less infrastructure, less human land use, and less power lead to less human conflict.” A recent article in Science provides another compelling argument for preserving wild places. Andrew Balmford of the University of Cambridge and his co-authors cited the often-overlooked economic benefits of healthy ecosystems. They found that in addition to the harvest of wild organisms for food, fuel, fiber, and medicine, people also benefit from ecosystem services like nutrient cycling, soil formation, and flood protection. Although ecosystem services have not historically been priced, the authors estimated that an effective global conservation program would repay its cost a hundredfold. But is human presence necessarily bad? “People convert land cover for a host of reasons, some of which are very necessary and good for human welfare,” said DeFries. “We need to eat, so we have cropland. We need places to live, so we have urbanization. But we also need a way to assess the tradeoff between the obvious benefits and possible negative consequences. Then we’ll be able to make informed decisions to both satisfy human needs and maintain the ecosystem services that vegetation provides.” “No matter where you are, there’s something in nature that’s worth saving,” said Kent Redford, director of the Wildlife Conservation Society Institute. “If you live in a city, you can build a ‘green’ roof so that migratory butterflies have a place to stop. If you live in a suburban setting, you can develop street curbs that allow turtles and amphibians to cross without getting pulled into the drains. If you’re in a rural setting, you can try to control urban sprawl and the use of pesticides.” “I think most people feel sad about what’s happening to the natural world, and they want to make better choices,” said Sanderson. “But I also think a lot of people feel helpless about what to do. That’s why conservation organizations exist — to try to offer solutions.” According to Sanderson, it is especially important to conserve wildlife “across the gradient of human influence” not just in wild places, but also in cities. Luckily, he can point to some success stories. “Hawk migrations over New York City had almost come to an end between the 1920s and 1940s. Now that threats from DDT and recreational hunting have been reduced, the birds are returning, and thousands of people come to the city to see them,” he said. “It’s a magnificent sight. It’s amazing.” Balmford, Andrew, Aaron Bruner, Philip Cooper, Robert Costanza, Stephen Farber, Rhys E. Green, Martin Jenkins, Paul Jefferiss, Valma Jessamy, Joah Madden, Kat Munro, Norman Myers, Shahid Naeem, Jouni Paavola, Matthew Rayment, Sergio Rosendo, Joan Roughgarden, Kate Trumper, and R. Kerry Turner. 2002. Economic reasons for conserving wild nature. Science. 297(5583):950-953. (Registration or subscription may be required for access.) Sanderson E. W., M. Jaiteh, M. A. Levy, K. H. Redford, A. V. Wannebo, and G. Woolmer. 2002. The human footprint and the last of the wild. Bioscience. 52(10):891-904. (PDF file, 1.7 MB) |
The Last of the Wild shows the wildest areas in each biome. Sanderson and his collaborators contend that the geography of natural processes is roughly the inverse of the geography of human influence. (Image courtesy of Sanderson et al.) Click here for a high-resolution image (75 KB).
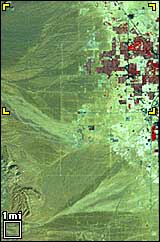 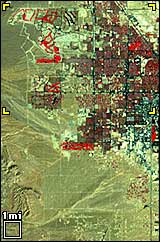 Landsat satellite images show rapid growth in the western portion of Las Vegas. The city’s population increased from 273,000 in 1972 (top) to 863,000 in 1992 (bottom). (Image courtesy of USGS: Earthshots. A new browser window will open.) |
||