
 | |||
 | |||
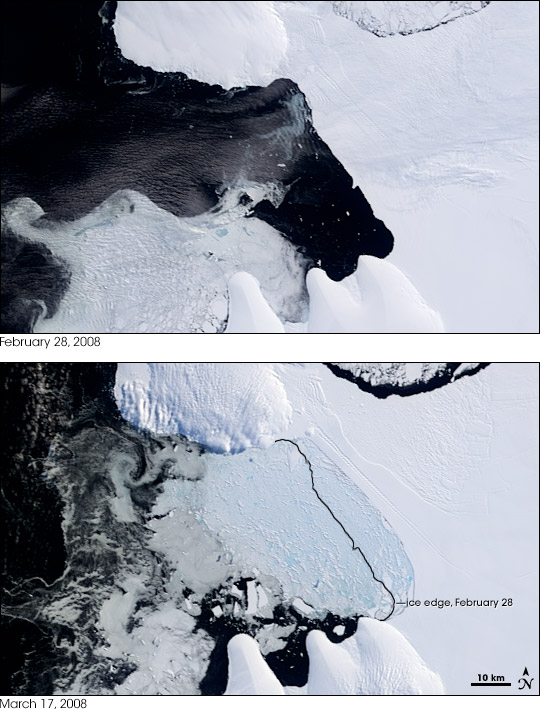
In late February 2008, the Wilkins Ice Shelf on the Antarctic Peninsula disintegrated, an indication of warming temperatures in the region. The Moderate Resolution Imaging Spectroradiometer (MODIS) sensors on NASA’s Terra and Aqua satellites provided some of the earliest evidence of the Wilkins Ice Shelf disintegration. Ted Scambos, lead scientist at the National Snow and Ice Data Center (NSIDC), noticed changes in the shelf in MODIS imagery in March 2008. Terra acquired these images on February 28 (top) and March 17 (bottom). The top image, acquired just before the breakup, shows the intact ice shelf. The bottom image, taken 18 days later, shows the remnants of the ice shelf becoming frozen in place by surrounding seawater. Whereas the intact ice shelf appears white, the disintegrated shelf appears in varying shades of pale blue indicating small pieces of water-saturated ice mixed with a newly forming veneer of sea ice. In the March 17 image, amid the pieces of shattered shelf, large blocks of ice cluster along the northern and (especially) southern edges of the shelf. Upstream from the broken shelf, crevasses appear on what remains of the shelf, suggesting that this portion of the shelf remains vulnerable to disintegration. According to Scambos, however, the ice shelf will not likely undergo further breakup until the next Antarctic summer. “The ice has begun to re-freeze, and it’s already been snowed on,” he stated. |
Early in the day on February 28, 2008, the Wilkins Ice Shelf remained intact. By March 17, 2008, the ice shelf had retreated significantly from its original extent. As the Antarctic summer drew to a close, sea ice began to freeze around the ice fragments. (NASA images by Jesse Allen and Robert Simmon, based on MODIS data.)
| ||
 | |||
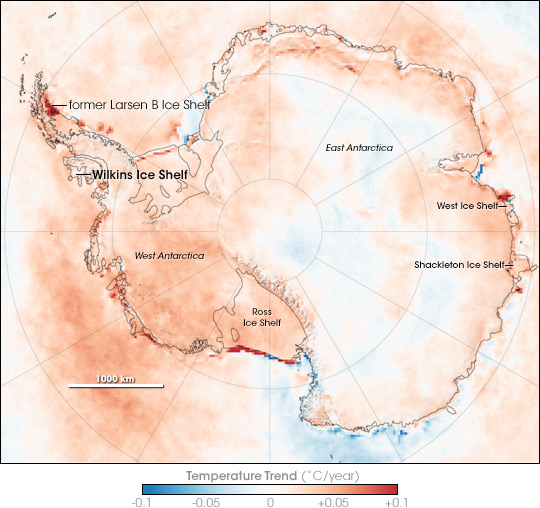
At roughly 70.5 degrees south and 72.5 degrees west, the Wilkins Ice Shelf occupies some 13,680 square kilometers (5,282 square miles), and has a maximum thickness of 200 to 250 meters (656 to 820 feet). Like other ice shelves, the Wilkins floats on the surface of the water, but is also glued to the shore. The shelf’s disintegration appeared to result directly from warming temperatures. In the five decades prior to the collapse, the Antarctic Peninsula experienced a temperature increase of 0.5 degrees Celsius (0.9 degrees Fahrenheit) per decade, making it one of the fastest warming places on Earth, according to the National Snow and Ice Data Center. This map of the temperature trend is based on thermal infrared (heat) observations from National Oceanic and Atmospheric Administration (NOAA) satellite sensors. This image shows trends in skin temperatures—roughly the top millimeter of the land, sea ice, or sea surface, rather than air temperatures—and it shows the long-term change in yearly surface temperature between 1981 and 2007. Warming areas appear in shades of red, and cooling areas appear in shades of blue. One of the most dramatically warmed areas appears at the former location of the Larsen B Ice Shelf, which shattered in 2002. Although some 300 kilometers (185 miles) farther south than the Larsen, the Wilkins Ice Shelf seems to have succumbed in the same fashion in early 2008. |
Between 1981 and 2007, most of Antarctica warmed. Portions of West Antarctica experienced an especially rapid rise in temperature. (NASA image by Robert Simmon, based on data from Joey Comiso, GSFC.) | ||
 | |||
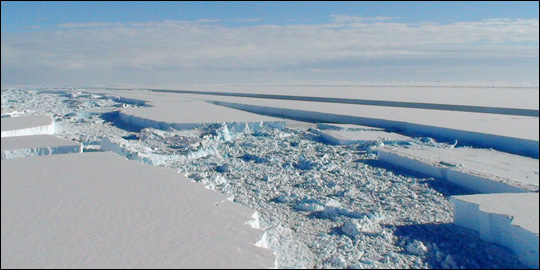
As the ice shelf crumbled, the British Antarctic Survey (BAS) conducted a flight over the shelf, capturing video footage and photographs, including this picture of the shelf. In its release, BAS stated, “A large part of the Wilkins Ice Shelf on the Antarctic Peninsula is now supported only by a thin strip of ice hanging between two islands. It is another identifiable impact of climate change on the Antarctic environment.” Consistent with MODIS imagery, this photograph shows large blocks of relatively intact ice intermingled with ice detritus floating on the ocean surface. The Wilkins Ice Shelf, like its predecessor the Larsen B, showed evidence of melt pond formation on the surface of the ice shelf prior to breakup. A series of sufficiently warm summers can change permeable snow into impermeable ice, similar to how snow collected in a sidewalk gutter can turn icy after a few warm days. This change in the ice shelf surface allows melt ponds to form during subsequent warm summers, and these ponds may find and fill preexisting surface cracks. Because water is denser than ice, the water may deepen the cracks and eventually slice completely through the shelf. |
Large blocks of ice, recently broken off the Wilkins Ice Shelf, float on the ocean in this aerial photograph. In between the large blocks of ice float much smaller pieces of ice with a rough surface. (Photograph © 2008 British Antarctic Survey.) | ||
 | |||
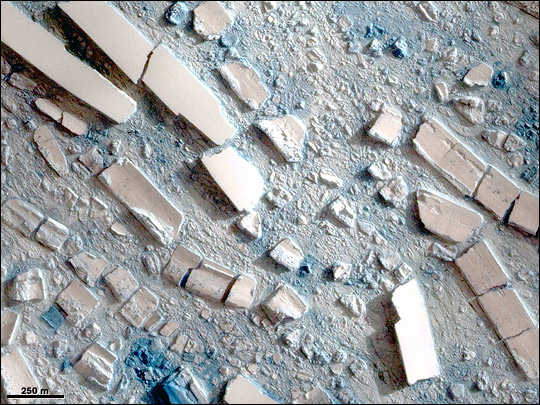
Upon observing the Wilkins Ice Shelf disintegration in MODIS imagery, NSIDC’s Scambos contacted Cheng-Chien Liu at Taiwan’s National Cheng Kung University (NCKU). Liu subsequently requested imagery from Taiwan’s Formosat-2 satellite. Formosat-2 collected high-resolution imagery of the disintegrated ice shelf, showing the aftermath of the collapse in remarkable detail. When melt ponds cut through ice shelves, some of the pieces they carve may be broad slabs, but other pieces may be tall and thin. (Photographs of tall and narrow slices that formed during the collapse of the Larsen B Ice Shelf accompany the feature story Fragment of Its Former Shelf.) The broad slabs are stable in the water, whereas the thin slices may topple over like dominoes. This Formosat-2 image captures a partial domino effect in action. An intact portion of ice shelf has a smooth surface, and some of the ice blocks in this image display such a surface, indicating that those ice blocks did not topple. Other ice blocks have rough surfaces, often with one smooth edge (the former surface). These ice blocks have tipped onto their sides. An ice shelf collapsing does not by itself raise sea level because the ice shelf was already floating on the ocean surface and displacing its own weight. However, the loss of an ice shelf can “release the brake” on the flow of glaciers that feed the shelf. Increased glacier flow can raise sea level by introducing the weight of the glacier onto the ocean surface, just like adding enough ice cubes can raise the level of your drink. In the wake of the Larsen B Ice Shelf Collapse in 2002, a research team led by Scambos found that the glaciers feeding the shelf accelerated up to six times their original flow speed. The Larsen Ice Shelf is “typical” in that it is primarily fed by a land-based glacier. The Wilkins Ice Shelf is somewhat unusual in that only the southern end of the shelf appears to be fed by land-based ice; the rest of the shelf may have formed from accumulation of sea ice that held fast to the coastline through many seasons, as well as snow cover. Glaciologists estimate that the part of the Wilkins Ice Shelf that formed from sea ice may be 300 to 400 years old, and the part that is fed by glacier flow is older, perhaps up to 1,500 years old. Because the Wilkins Ice Shelf is only marginally fed by glacier flow, however, its collapse was not expected to have the same impact on sea level rise as the collapse of the Larsen B potentially could. The collapse of the Wilkins Ice Shelf was announced in a joint press release from the National Snow and Ice Data Center (NSIDC), the British Antarctic Survey (BAS), and the Earth Dynamic System Research Center at National Cheng Kung University (NCKU) in Taiwan.
|
High-resolution satellite data show the Wilkins Ice Shelf collapse in detail, including blocks of ice that have tipped over and blocks of ice that have remained upright. (Formosat image © 2008 Dr. Cheng-Chien Liu, National Cheng-Kung University and Dr. An-Ming Wu, National Space Organization, Taiwan.) | ||