
 |
|||
|
In 1990, 35 percent of the world's population lived on 1 percent of the ice-free land, according to data from SEDAC, the Socioeconomic Data and Applications Center operated by the Center for International Earth Science Information Network at Columbia University. Concerned about the impact of growing population on the global environment, researchers and policymakers have begun focusing research efforts on the viability of regional and national economies and human proximity to natural hazards. As research results return, global population data are helping scientists, resource managers, and policymakers to forecast and prepare for the impact of the world's ever-growing population.
|
August 15, 2001
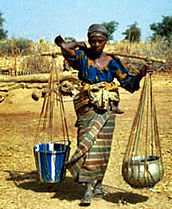
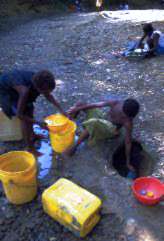
Population Series: Location, Location, Location Life on the Brink Measure by Measure  Water is scarce in the African Sahel. This Nigerian woman makes her daily trip home carrying two pots of water and a baby on her back. (Image courtesy of Peace Corps. A new browser window will open.)  Untreated water from suspect sources is a widespread problem in South America. (Image courtesy of National Institutes of Health. A new browser window will open.) Initially created by researchers at the National Center for Geographic Information and Analysis in Santa Barbara with partial support from SEDAC, the first version of the Gridded Population of the World (GPW) data set consisted of population estimates for circa 1994. Since the initial data compilation process, SEDAC and other institutions, such as UNEP-GRID (United Nations Environment Programme/Global Resource Information Database) and CIAT (Centro Internacional de Agricultura Tropical), have updated and enhanced the data set for particular regions by increasing the data resolution, both spatially and in terms of population numbers, improved the gridding technique and reduced population allocation errors. In version 2 of GPW, SEDAC brings together these interim efforts and some additional ones to create an enhanced global coverage using eight times the number of input data points than the first version. GPW version 2 estimates population at two points in time, 1990 and 1995. Further, data grids are now 2.5 by 2.5 minutes, whereas before grids were 5 by 5 minute. Finally, the national population estimates have been adjusted to match the United Nations national estimated population for each country — no such adjustments were in the first version — so that users can select an adjusted or unadjusted version of the database. For more information, visit the Socioeconomic Data and Applications Center. (A new browser window will open.) |
||
|
A growing global economy has resulted in blurring of national economic boundaries, generally increasing wealth, and improving access to health and technology for most of the world's developed countries. However, the rate of economic development for poor nations is much slower than that of developed nations. The World Bank estimates that almost half of the world's population, about 2.8 billion, live on less than $2 per day and that the average income of the world's richest nations is 37 times higher than that of the poorest 20 nations. This amounts to a doubling in economic disparity over the past 40 years.
Researchers at Harvard's Center for International Development (CID) studied the relationship of climate to, and the effect of disease and agricultural productivity on the economic success of a city or region. "Each year the World Bank publishes maps detailing national gross domestic product, and each year the maps show most of the countries in the tropics to be poor, even after years of economic and institutional reforms," said Andrew Mellinger, a research associate at the CID. "We were puzzled by the fact that the methods adopted by aid agencies did not seem to affect change in developing tropical countries." To better understand this problem, Mellinger and colleagues Jeffrey Sachs and John Gallup used geographic information system mapping techniques to identify geographic and economic patterns in poor regions. Using detailed global population density data from SEDAC to create a map delineating countries based on their Gross National Product (GNP — the total value of all goods and services produced by a country during one year), they compared and contrasted wealthy and impoverished nations. Using the Gridded Population of the World's five-minute by five-minute gridded sections, Mellinger estimated GNP density for each section by multiplying population density by per capita GNP, and grouped countries with similar economies together. "We needed detailed information such as population distribution at a subnational level — SEDAC's database became the keystone of this research," said Mellinger. By further sorting regions based on climate zones and coastal proximity, Sachs, Mellinger, and Gallup found that only three tropical economies — Hong Kong, Singapore, and part of Taiwan — were classified as high-income by the World Bank. However, every country within regions zoned as temperate had either middle- or high-income economies. (Interestingly, all of these temperate climate middle-income economies, including China, Russia and Eastern Europe, represented former or current socialist regimes.) In countries that straddle both temperate and tropical climates (like Brazil or Australia), the economic schism becomes even clearer — overwhelmingly, wealth concentrates in the temperate zones of these countries.
Sachs, Mellinger, and Gallup found that three significant geographic factors played roles in determining economic vitality: coastal proximity, the prevalence of infectious diseases, and agricultural productivity. Research indicates that proximity to a coast facilitates getting products to outside markets while lowering trade costs. But tropical diseases have longer-term effects than simply reducing worker productivity. The study suggests that since birth rates typically increase to compensate for increased juvenile deaths, women may be delaying entry to the marketplace to accommodate maturation of younger children. With less income available to the family, education for surviving children becomes a luxury rather than an expectation, which may ultimately reinforce generational patterns of poverty, said Mellinger. Lastly, tropical soils are more fragile than temperate soils and typically subject to alternating dry and rainy seasons. "Because tropical agricultural yields are typically low, urban populations, dependent upon food from rural areas, are lower than might otherwise be expected," said Mellinger. "With a smaller urban population, non-agricultural inventions and technology advances come to market more slowly than occurs in the highly urban populations of wealthier nations." "Our research indicates that policy makers and aid organizations might have more success fighting poverty by improving overall health and creating non-agricultural economic opportunities for developing nations," said Mellinger. "Malaysia provides an excellent example of how this has succeeded. There, public health issues have been proactively addressed, which is reducing the impact of disease on the population. Additionally, fewer resources are spent producing crop commodities in favor of developing service and manufacturing industries." "Unfortunately, Malaysia's coastal and ecological advantage isn't shared by much of sub-Saharan Africa, where geographical conditions are more intractable. Combating poverty there will require serious redoubling of global aid efforts to address the unique conditions facing those populations," Mellinger said. Sachs, Jeffrey D., Andrew D. Mellinger, and John L. Gallup. 2001. The Geography of Poverty and Wealth. Scientific American. March 2001. Available online through the Center for International Development. Accessed July 16, 2001. World Data Report 2000/2001: Attacking Poverty. April 2001. Accessed July 16, 2001. |
|||