
 |
|||
Air quality scientist Jim Szykman begins his story with a tone that suggests “You’re not going to believe this, but…” He describes how in late summer of 2002, an area of high atmospheric pressure settled in over the industrial Midwest south of Lake Michigan. The soot, smoke, and gases from regional power plants that consistently have some of the country’s highest emission rates began to pile up in the hot, humid, stagnant air. The Environmental Protection Agency’s air quality index values began to exceed 100—a level considered unhealthy for people with lung or heart conditions. By itself that kind of aerosol pollution event isn’t unusual for that area in the summer. In a normal week one of the regular weather fronts that move from west to east across the United States would have passed through, breaking up the high-pressure system and sweeping the dirty air eastward toward the Atlantic Ocean. As it turned out, however, September 8-14 was not a normal week. |

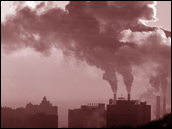
Power plants, factories, and automobiles create air pollution that can spread far from its source. The U.S. Environmental Protection Agency (EPA) monitors air quality at ground stations across the country, most of which are located in urban areas. To predict where and when a local pollution problem will became a regional one, air quality forecasters need observations over a wider area than ground stations can provide. EPA and NASA scientists are combining satellite measurements of air pollution with data collected on the ground to improve forecasts of air quality. (Image copyright Hemera) |
||
 |
|||
A weather front did arrive from the northwest. But where it might normally have just tracked its way across the Mid-Atlantic and eastern United States, the front instead found its normal exit blocked by Hurricane Gustav, churning off the coast of North Carolina. “The dirty air got squeezed between the oncoming weather front and Gustav to the east,” says Szykman, “and flowed southward down the course of the Mississippi River toward the Gulf of Mexico.” Just as the pollution-filled air was trying to clear the Gulf Coast and make its way out to sea, it hit yet another roadblock: Tropical Storm Hanna plowing northward through the Gulf. In the face of Hanna, the Midwest air mass hung over Texas like a confused funhouse visitor searching for an exit. Pollution concentrations remained at unhealthy levels for several days. |
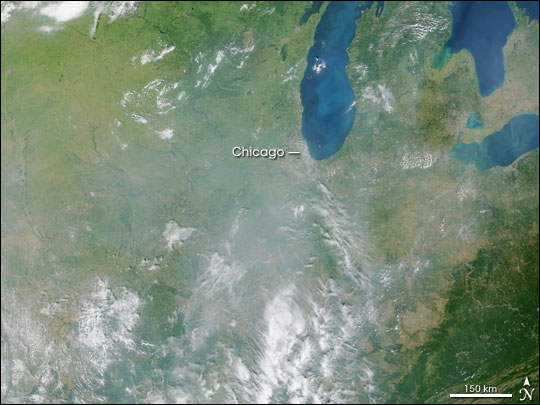
Humid, hot, stagnant air combined with industrial emissions in the upper Midwest to create a thick blanket of haze over the area in September 2002. Various weather sytems pushed the pollution around the eastern half of the country for a week, triggering widespread air quality alerts in places as far away as Texas and South Carolina. This image from the Moderate Resolution Imaging Spectroradiometer (MODIS) shows the polluted air like a gray veil over the region southwest of Chicago on September 9, 2002. (NASA Image by Jesse Allen based on data provided by the MODIS science team) |
||
 |
|||
While Hanna blocked the southward evacuation route, Gustav began to head for the northern Atlantic, loosening its grip on the Southeast. Some of the dirty air snaked across the Deep South and out to the Atlantic, but all of the pollution didn’t get a chance to escape before Hanna came ashore like a snowplow, pushing what was left back toward the north. After a week on the road, the well-traveled and only partially diluted wave of polluted Midwest air was pretty much back where it started! Aside from its being an interesting example of how complex our weather is, what’s so important about this story? To Szykman, who works for the Environmental Protection Agency (EPA), what’s important is that most local air quality forecasters in the locations where the pollution ended up didn’t even know it was coming. That’s a situation Szykman is determined to change. He thinks he can give local air quality forecasters better advance warning of significant regional pollution events by fusing the EPA’s local, ground-based air quality measurements with NASA’s satellite perspective of pollution. By combining this information with weather forecasts from the National Oceanic and Atmospheric Administration’s (NOAA) National Weather Service, Szykman and his colleagues will give forecasters a new view of how pollution moves over a region, like meteorologists track weather systems moving across the country. |
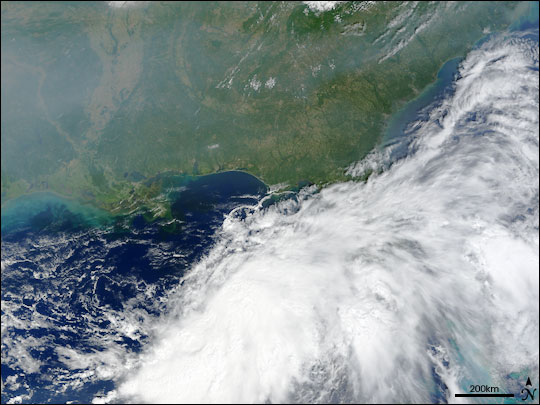
Two days later, a weather front arrived from the West. With Hurricane Gustav off North Carolina blocking the eastward flow of air to the Atlantic, the air pollution spread southward to Texas. There, Tropical Storm Hanna prevented it from moving out over the Gulf of Mexico. As Hanna came ashore and Gustav moved northward, some of the polluted air escaped to the Atlantic across the Deep South. This image from September 11, 2002, shows the haze stretching from Louisiana (left) to South Carolina (top right). (NASA Image by Jesse Allen based on data provided by the MODIS science team) |
||