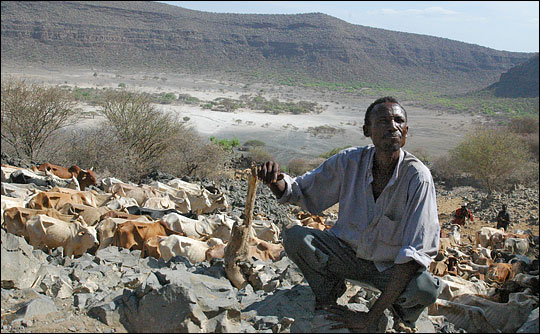
Botswana, 1984. Cattle roam over grasslands at the edge of the Kalahari Desert. Destined to become Botswana’s signature commodity, the cattle will feed the southern African nation and contribute to its rapidly expanding exports. A full 77 percent of the country’s 576,000 square kilometers is already used for grazing, but even this isn’t enough to support the cattle. The grasslands are prone to drought, and the government is forced to import food for them. British biogeographer Stephen Prince is among the scientists that the United Nations Food and Agriculture Organization has asked to assess the health of the rangelands. How is drought impacting the land? Is overgrazing occurring? Prince is given 50 data points—snapshots of vegetation conditions—scattered across the country. |
|||
 | |||
“It was the same as putting 50 pin pricks in a map,” Prince recalls. Conditions could vary widely; healthy vegetation could be growing meters away from barren land. “You couldn’t measure vegetation change over the entire country with 50 data points.” While still trying to figure out how he was going to piece together these snapshots of plant growth to assess the health of a huge ecosystem, Prince stopped by the house of a colleague, John Townshend. What he saw not only showed him how such problems would be solved in the future, but launched him on a new career. Townshend had just returned from NASA Goddard Space Flight Center in Greenbelt, Maryland, where remote-sensing ecologist Compton Tucker had developed a new scale, or index, of global vegetation based on satellite data. Made from data collected by the Advanced Very High Resolution Radiometer sensors flying on a series of NOAA meteorological satellites, the index could show how much photosynthesis was happening in every 8-by-8-kilometer patch of ground. Displayed as a map, the index revealed the productivity of the grazing land over a broad area over successive 15-day periods. Townshend showed Prince a print-out of the vegetation index of Africa. “It blew me away that we could see a complete continent at frequent time intervals,” Prince says. “It was a career-changing moment.” Realizing the vegetation index’s potential, Prince moved to Goddard Space Flight Center to join Tucker and others in studying the world’s vegetation from space. Today, he is a Professor in the Geography Department at the University of Maryland, College Park. |
Local herdsmen and emaciated cattle cope with the harsh conditions brought by a severe drought in western Ethiopia. When seasonal rains fail to arrive throughout the arid regions of Africa, crops fail, cattle cannot find forage, and the inhabitants face starvation. In addition, overgrazing and unsustainable farming can permanently degrade fertile land. In the final decades of the twentieth century disastrous droughts in Africa became increasingly common. As millions in Africa suffered, scientists began to search for a cause: were famines in Sub-Saharan Africa caused by changes in rainfall, or by permanent desertification? (Photograph copyright Andrew Heavens.) | ||
 |
|||
When he first saw the vegetation index, Prince realized that it could reveal the condition of Botswana’s range lands in a single glance, and it was frustrating to know that it would be some time before the newly developed product would be ready for anything but experimental use. For Botswana, he had to make do with the data he had been given, but he knew the satellite maps would change how he answered those kinds of question in the future. Perhaps more importantly, the vegetation index would be able to answer even larger questions about Africa’s vegetation. In his travels, Prince had seen the effect of devastating drought in Africa’s Sahel, a broad strip of semi-arid, sparse savanna immediately south of the Sahara Desert. A list of Sahelian countries is a yearbook of famine: Sudan, Chad, Niger, Mali, Mauritania, Ethiopia, Burkina Fasso, and Senegal. A string of dry years leading up to the early 1980s shriveled vegetation throughout the Sahel, causing some people to fear that the Sahara Desert was steadily marching southward, gradually eating up arable land in the Sahel. Ground studies had produced dramatic pictures of formerly productive lands reduced to apparent desert. Many people extrapolated from these local examples of desertification to propose that the whole Sahel was becoming a desert, but no one had surveyed the entire Sahel. It was far too large a task. |
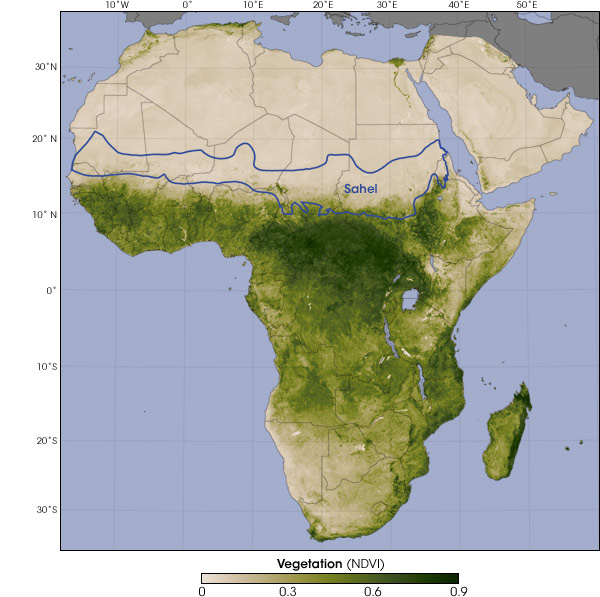
The Sahel stretches across Africa, roughly 15 degrees north of the Equator. Satellite measurements of vegetation reveal it as a transition zone between the sands of the Sahara and the jungles of the Congo in the heart of Africa. This map shows vegetation in the final two weeks of June 2005, near the end of the dry season in the Sahel. Dark green indicates dense vegetation, while light green and beige indicate sparse vegetation and barren land. (Map by Robert Simmon, based on GIMMS vegetation data and World Wildlife Fund ecoregions data.) | ||
“When I saw the vegetation index data, I realized that it was exactly the scale we wanted for studying desertification,” says Prince. “There is no other way of seeing big enough areas at high enough frequency.” The index’s large scale meant that it would emphasize only widespread desertification. “You don’t get fooled by small patches of degraded land,” Prince explains. He hoped that over time the vegetation index would reveal whether or not the Sahara was expanding into the Sahel. But before the vegetation index could be used to map out desertification in the Sahel, Prince, Tucker, and others studying the phenomenon needed two things: a clear definition of what qualifies as desertification and a long record of vegetation conditions in the Sahel. |
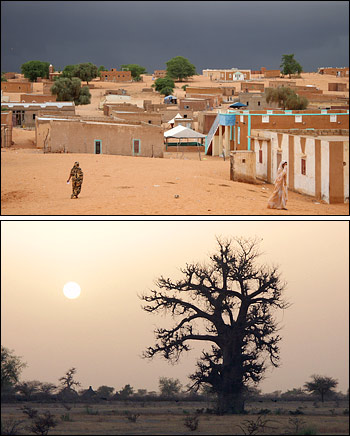
Dark skies threaten to bring a downpour to a village in southern Mauritania (upper). Rain falls in the Sahel only in the wet season, from July to October. The seasonal rain supports an ecosystem of grasses, dense brush, and sparse tree cover. Baobab trees (lower), survive extended droughts by storing water in their bulbous trunks. (Photographs copyright Ferdinand Reus and David Haberlah.) | ||
alert message
