Contrary to popular opinion, when it comes to greenhouse gas emissions, the United States cannot accurately be labeled as all give and no take. In fact, of the 5 billion tons of carbon dioxide our consumer driven country coughs up a year, roughly 15 to 30 percent is reabsorbed back into the land. Scientists refer to such a draw down of carbon as a carbon sink. Though researchers have known of this North American carbon sink for the better part of the 20th century, they do not understand precisely what is causing the sink or why the amount of carbon absorbed seems to increase over the years. |
| ||
| |||
The most popular theories revolve around an observed greening of North America. Plant life appears to have thrived over the last 100 years, and increased vegetation growth has simply absorbed more CO2 from the air, increasing the carbon sink and partially offsetting greenhouse gas warming. In the presence of water and sunlight, plants take in CO2 during photosynthesis to create fuel, glucose, and other sugars for building plant structures. Viable causes for why plants have done so well include a revival of forests
from agricultural and urban clear-cutting in the 1800s, greater concentrations
of atmospheric CO2 from fossil fuel burning, and warmer global temperatures in
the 1900s. But a new study points to another factor vital to plant growth that
may be at the root of the matter—more water. |
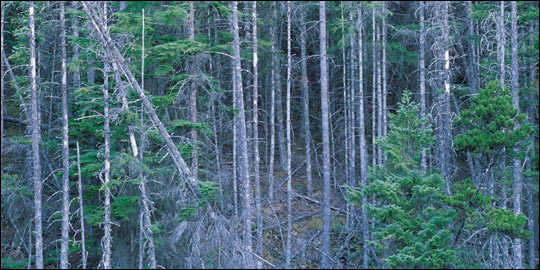
Forests and other vegetation in the U.S. consume about a quarter of the carbon dioxide gas the country produces each year. Over the past few decades the size of this “carbon sink” has been growing. NASA researchers now believe increased rain and snowfall are encouraging plant growth, which in turn is sequestering carbon dioxide. (Photograph copyright Adobe Systems, Inc.) | ||
 |
According to the NASA-funded study that used 100 years of temperature and
precipitation-related data, computer model results showed that on average from
1950 to 1993, an 8 percent increase in precipitation combined with higher
humidity has led to a 14 percent increase in plant growth in the United States.
The data over that period also show increases in cloud cover, minimum surface
temperatures, soil moisture, and stream flows, which are all signs of a changing
water cycle. |
In fits and starts, the extent of forest cover in the United States has begun to recover from a low at the end of the 19th Century. Combined with the expansion of tree-covered suburbs (instead of open farms), the regrowth of forest was thought to account for the increase in carbon draw-down in the U.S. (Graph by Robert Simmon, based on data from W. Brad Smith, John S. Vissage, David R. Darr, and Raymond M. Sheffield, Forest Resources of the United States, 1997, U.S. Forest Service) | |
 |
“This work illustrates that the enhanced water balance in the U.S. appears to be at least as strong a mechanism in the enhanced carbon sink as any of the other mechanisms, and until this point, it appears to have been overlooked,” adds Steve Running, a co-author of the paper, who is also a researcher at the University of Montana’s School of Forestry. While the connection between water availability and plant growth may appear
obvious, there are complex interactions at play here that make a positive uptake
of carbon possible. “Most people only think of the idea that more water
means more growth, but really plants benefit from more water in a number of
ways,” says Running. The increased rate of the carbon sink results from a
synchronous interplay between plant physiology and both the timing and magnitude
of changes that impact the water cycle. |
Over the past 100 years, vegetation productivity (green line) has followed changes in precipitation (blue line) much more closely than changes in temperature (red line). Vegetation productivity is a measure of how much carbon plants are consuming as they grow. (Graph adapted from Nemani, Ramakrishna; White, Michael; Thornton, Peter; Nishida, Kenlo; Reddy, Swarna; Jenkins, Jennifer; and Running, Steven, 2002: Recent trends in hydrologic balance have enhanced the terrestrial carbon sink in the United States, Geophysical Researc Letters, Vol. 29, No. 10.) | |
The study finds that between 1950 and 1993, the minimum temperatures in the
spring have become warmer and the autumns have become wetter, which may have
combined to lengthen the growing season, giving plants a longer time frame for
photosynthesis. But without the right coincidence of both temperature and water
availability, the growing season would likely not have lengthened. Between 1910
and 1940, for example, there was a warming trend in the winter, a season when
plants do not grow. The same principle is true for rainfall. “If you get
rain in winter, it doesn’t make a big difference for the plants, but in the
autumn, it does,” adds Nemani. |
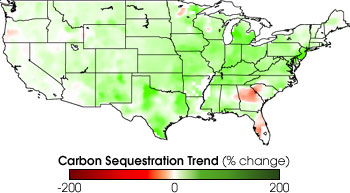
Over most of the continental United States carbon sequestration increased from 1940 to 1993. Plants absorb carbon dioxide from the air as they grow, and store it in their leaves, stems, and trunks. Even after the plants die, carbon can be stored in the soil. (Map from Nemani et al.) | ||
 |
In addition, a longer growing season must also be combined with more humidity and rain for vegetation to uptake more carbon. Without water, a long hot summer can lead to droughts. “A longer growing season independent of high water availability isn't necessarily good for terrestrial carbon storage,” says Michael White, an assistant professor at Utah State University’s Department of Aquatic, Watershed, and Earth Resources and another co-author of the study. White adds that higher temperatures cause organic matter in the soil to release more carbon dioxide, while low moisture limits photosynthesis in plants. Previous research has claimed that the observed increases in plant growth
result from a greater abundance of atmospheric CO2. Though plants clearly
require CO2 to grow, water and higher humidity make plants more efficient at
drawing in carbon. In dry conditions, plants close special cells in their
leaves, called stoma, to reduce the amount of water lost to the air through
evaporation. Higher CO2 availability also promotes closure of these cells since
the plants can have a smaller opening, save water, and take in the same amount
of nutrients. But when the air is wetter, these pores can open without a net
water loss, increasing CO2 uptake while reducing the amount of water needed to
grow. “If you increase the rainfall you can sequester more carbon from the
atmosphere,” Nemani says. Additionally, wetter soils promote decomposition
of dead plant materials, releasing natural fertilizers that help plants grow. |
Temperatures (red line) in the U.S. from 1950 to 1993 have increased in the spring and dropped in the fall. At the same time precipitation (blue line) in the fall increased. This has likely increased the growing season, allowing plants to grow more vigorously (green line) and absorb more carbon dioxide each year. (Graph adapted from Nemani et al.) | |
For these reasons, the authors found that enhanced rainfall and humidity
prove to be the main controlling factors in increasing plant growth and carbon
uptake. While a number of studies focus on temperature changes as the cause of
increased U.S. plant growth, this study finds that average U.S. temperatures
over the last 100 years have stayed about the same, with a warming trend in the
west, countered by cooling in the east. The researchers believe that other
possible non-climate related factors, such as forest re-growth due to a decline
of farms and a rebound of vegetation from earlier clear-cutting, could play a
role in creating more plant life. But still, the study attributes two-thirds of
the recent additional plant growth to higher humidity and more rainfall. |
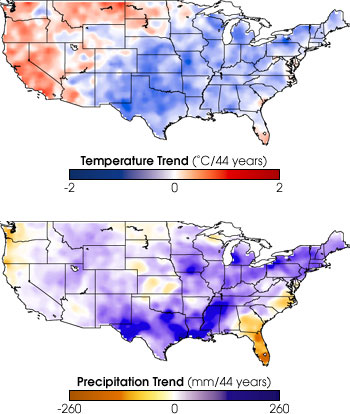
Temperature and precipitation changes from 1950 to 1993 were not uniform across the United States. The West warmed while the central and eastern states cooled. At the same time the Northeast and Rocky Mountains became wetter, while the Northwest and Florida dried out. (Map from Nemani et al.) | ||
Though the results appear optimistic at face value, there are many interdependent variables at play here that impact the water and carbon cycles. Such carbon sinks, however, are unlikely to lower CO2 concentrations enough to cure global warming. Nemani also warns that changes in the hydrologic cycle will not occur uniformly around the world. Some places will receive more rainfall and other places will receive less, as is the case with current droughts in the Pacific Northwest and in much of Africa. “There will be winners and there will be losers,” Nemani says.
|
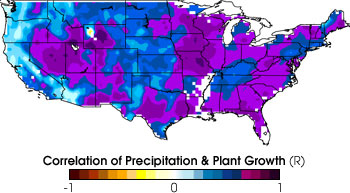
To confirm that precipitation was responsible for the increase in plant growth, the researchers compared change in vegetation to change in precipitation. This map shows the corellation between the two—there is a positive correlation if there is less plant growth in dry areas, or more plant growth in wet areas. For most of the U.S. the precipitation and vegetation productivity were closely linked. (Map from Nemani et al.) | ||
alert message