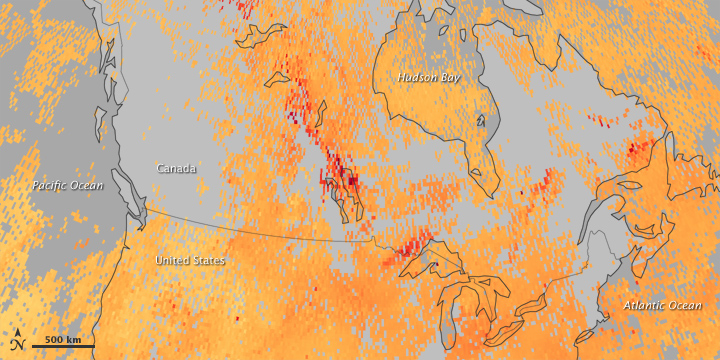


Fires in the Northwest Territories filled Canadian skies with smoke in late June 2010. This map shows concentrations of carbon monoxide—one component of smoke—from June 23–28 across Canada and the northern United States. Places where concentrations of carbon monoxide were highest are red. Places where no measurements were made (usually due to clouds) are gray.
Fire activity was concentrated west of Hudson Bay, and smoke wafted southeast toward the Great Lakes. Additional pockets of high carbon monoxide concentrations southeast of Hudson Bay may have been transported to the area from the Northwest Territories, but they may also be from local fires.
Smoke from fires can contribute to poor air quality far from the fire itself. It can mingle with urban pollution and boost air quality to unhealthy levels in cities. Carbon monoxide is a good tracer for moving smoke plumes, even across large distances.
Satellite observations, such as these data from Canada’s Measurements of Pollution in the Troposphere (MOPITT) sensor on NASA’s Terra satellite, can be fused with ground observations of pollution in models to figure out how forest fire smoke may affect air quality at places downwind of fires.
NASA Earth Observatory image created by Jesse Allen, using data provided by the National Center for Atmospheric Research (NCAR) and the University of Toronto MOPITT Teams. Caption by Rebecca Lindsey.