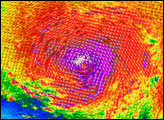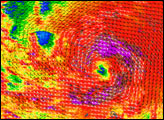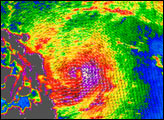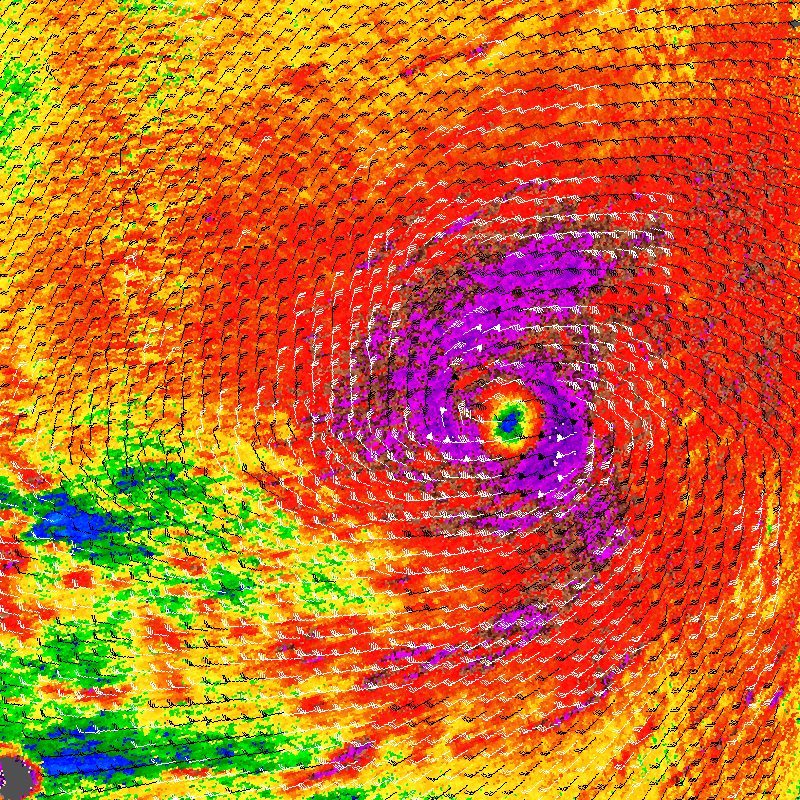
This colorful image reveals the wind structure within the quickly developing Typhoon Krosa. NASA’s QuikSCAT satellite captured the data used to make this image. Wind speeds are depicted in a rainbow of colors, with the highest speeds in purple and the slowest speeds in blue. The barbs show wind direction, and white barbs depict areas of heavy rain.
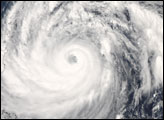
Though Krosa was a weak storm when QuikSCAT observed it at 9:48 UTC on October 2, 2007, its strengthening winds still have the classic bull’s eye shape observed in a strong storm. Sustained winds in the center of the storm ranged between 110 kilometers per hour (70 miles per hour or 60 knots) and 120 km/hr (75 mph or 65 knots), said the Joint Typhoon Warning Center. These wind speeds put the storm on the border between a tropical storm and a Category 1 typhoon. In this image, the strongest winds are depicted in purple and surround concentric rings of calm air where an eye has clearly formed. The strong wind fields aren’t perfectly symmetric, and that is a sign that the storm was still forming.
Krosa initially formed over the western Pacific Ocean on October 1. The Joint Typhoon Warning Center predicted that the storm would grow into a powerful typhoon as it moved towards the China coast.
Measurements of the actual wind strength of cyclones are often higher than those measured by QuikSCAT. QuikSCAT employs a scatterometer, which sends pulses of microwave energy through the atmosphere to the ocean surface, and measures the energy that bounces back from the wind-roughened surface. The energy of the microwave pulses changes depending on wind speed and direction, giving scientists a way to monitor wind around the world. This technique does not work over land, but allows measurements in storms over oceans.
Tropical cyclones, however, are difficult to measure. To relate the radar energy that returns to the sensor to actual wind speed, scientists compare measurements taken from buoys and other ground stations to data the satellite acquired at the same time and place. Because the high wind speeds generated by cyclones are rare, scientists do not have corresponding ground information to know how to translate data from the satellite for wind speeds above 50 knots (about 93 km/hr or 58 mph). Also, the unusually heavy rain found in a cyclone distorts the microwave pulses in a number of ways, making a conversion to accurate wind speed difficult. Instead, the scatterometer provides a nice picture of the relative wind speeds within the storm and shows wind direction.
NASA image courtesy of David Long, Brigham Young University, on the QuikSCAT Science Team, and the Jet Propulsion Laboratory.