Viewed from space, one of the most striking features of our home planet is the water, in both liquid and frozen forms, that covers approximately 75% of the Earth’s surface. Geologic evidence suggests that large amounts of water have likely flowed on Earth for the past 3.8 billion years—most of its existence. Believed to have initially arrived on the surface through the emissions of ancient volcanoes, water is a vital substance that sets the Earth apart from the rest of the planets in our solar system. In particular, water appears to be a necessary ingredient for the development and nourishment of life.
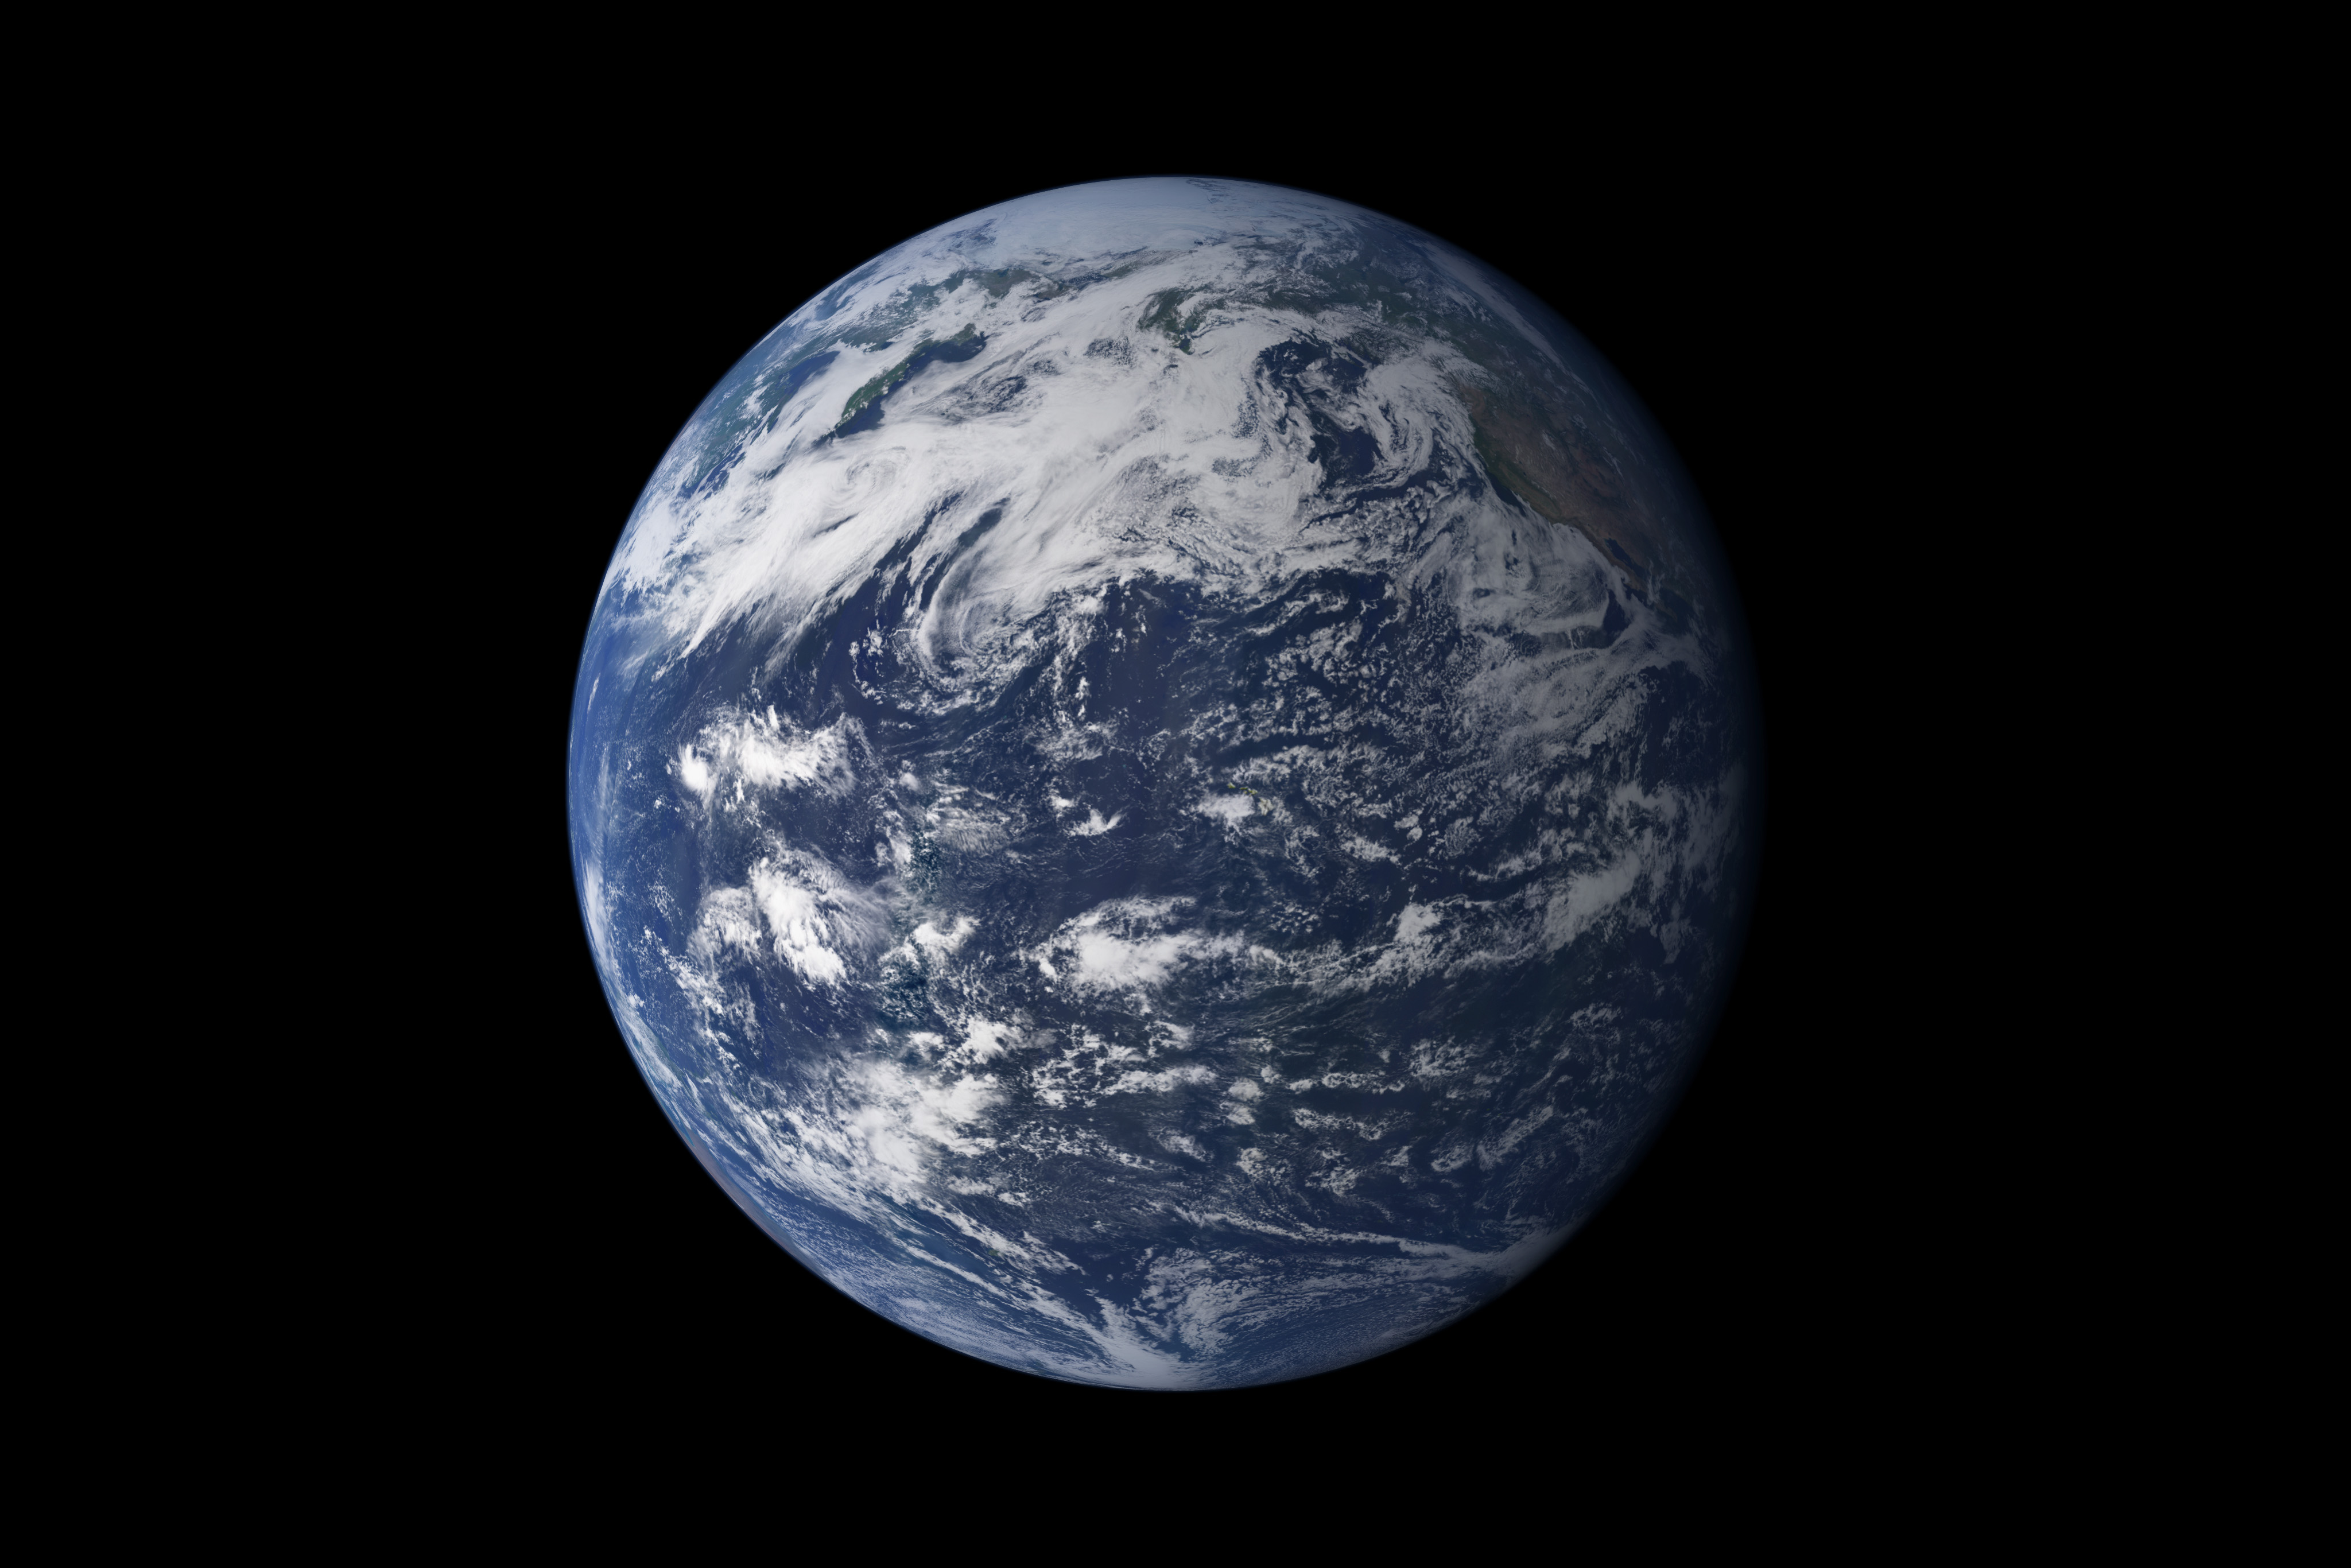
Earth is a water planet: three-quarters of the surface is covered by water, and water-rich clouds fill the sky. (NASA.)
Water is practically everywhere on Earth. Moreover, it is the only known substance that can naturally exist as a gas, a liquid, and solid within the relatively small range of air temperatures and pressures found at the Earth’s surface.
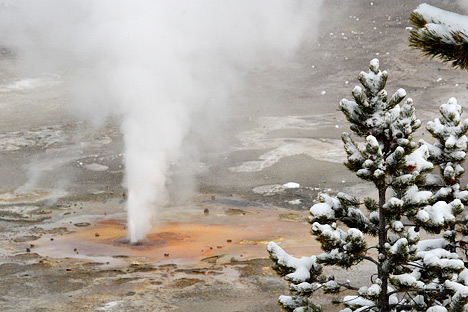
Water is the only common substance that can exist naturally as a gas, liquid, or solid at the relatively small range of temperatures and pressures found on the Earth’s surface. Sometimes, all three states are even present in the same time and place, such as this wintertime eruption of a geyser in Yellowstone National Park. (Photograph ©2008 haglundc.)
In all, the Earth’s water content is about 1.39 billion cubic kilometers (331 million cubic miles), with the bulk of it, about 96.5%, being in the global oceans. As for the rest, approximately 1.7% is stored in the polar icecaps, glaciers, and permanent snow, and another 1.7% is stored in groundwater, lakes, rivers, streams, and soil. Only a thousandth of 1% of the water on Earth exists as water vapor in the atmosphere.
Despite its small amount, this water vapor has a huge influence on the planet. Water vapor is a powerful greenhouse gas, and it is a major driver of the Earth’s weather and climate as it travels around the globe, transporting latent heat with it. Latent heat is heat obtained by water molecules as they transition from liquid or solid to vapor; the heat is released when the molecules condense from vapor back to liquid or solid form, creating cloud droplets and various forms of precipitation.
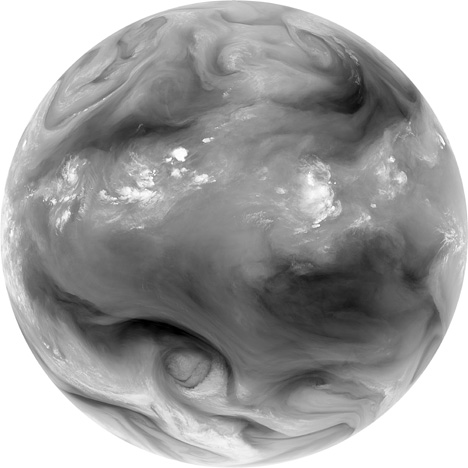
Water vapor—and with it energy—is carried around the globe by weather systems. This satellite image shows the distribution of water vapor over Africa and the Atlantic Ocean. White areas have high concentrations of water vapor, while dark regions are relatively dry. The brightest white areas are towering thunderclouds. The image was acquired on the morning of September 2, 2010 by SEVIRI aboard METEOSAT-9. [Watch this animation (23 MB QuickTime) of similar data to see the movement of water vapor over time.] (Image ©2010 EUMETSAT.)
| Estimate of Global Water Distribution | Volume (1000 km3) | Percent of Total Water | Percent of Fresh Water |
|---|---|---|---|
| Oceans, Seas, and Bays | 1,338,000 | 96.5 | - |
| Ice Caps, Glaciers, and Permanent Snow | 24,064 | 1.74 | 68.7 |
| Groundwater | 23,400 | 1.7 | - |
| Fresh | (10,530) | (0.76) | 30.1 |
| Saline | (12,870) | (0.94) | - |
| Soil Moisture | 16.5 | 0.001 | 0.05 |
| Ground Ice and Permafrost | 300 | 0.022 | 0.86 |
| Lakes | 176.4 | 0.013 | - |
| Fresh | (91.0) | (0.007) | .26 |
| Saline | (85.4) | (0.006) | - |
| Atmosphere | 12.9 | 0.001 | 0.04 |
| Swamp Water | 11.47 | 0.0008 | 0.03 |
| Rivers | 2.12 | 0.0002 | 0.006 |
| Biological Water | 1.12 | 0.0001 | 0.003 |
| Total | 1,385,984 | 100.0 | 100.0 |
| Source: Gleick, P. H., 1996: Water resources. In Encyclopedia of Climate and Weather, ed. by S. H. Schneider, Oxford University Press, New York, vol. 2, pp.817-823. | |||
For human needs, the amount of freshwater on Earth—for drinking and agriculture—is particularly important. Freshwater exists in lakes, rivers, groundwater, and frozen as snow and ice. Estimates of groundwater are particularly difficult to make, and they vary widely. (The value in the above table is near the high end of the range.)
Groundwater may constitute anywhere from approximately 22 to 30% of fresh water, with ice (including ice caps, glaciers, permanent snow, ground ice, and permafrost) accounting for most of the remaining 78 to 70%.
The water, or hydrologic, cycle describes the pilgrimage of water as water molecules make their way from the Earth’s surface to the atmosphere and back again, in some cases to below the surface. This gigantic system, powered by energy from the Sun, is a continuous exchange of moisture between the oceans, the atmosphere, and the land.
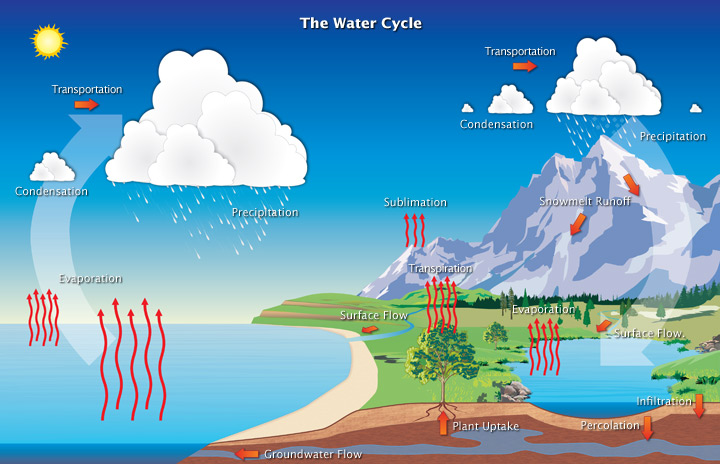
Earth’s water continuously moves through the atmosphere, into and out of the oceans, over the land surface, and underground. (Image courtesy NOAA National Weather Service Jetstream.)
Studies have revealed that evaporation—the process by which water changes from a liquid to a gas—from oceans, seas, and other bodies of water (lakes, rivers, streams) provides nearly 90% of the moisture in our atmosphere. Most of the remaining 10% found in the atmosphere is released by plants through transpiration. Plants take in water through their roots, then release it through small pores on the underside of their leaves. In addition, a very small portion of water vapor enters the atmosphere through sublimation, the process by which water changes directly from a solid (ice or snow) to a gas. The gradual shrinking of snow banks in cases when the temperature remains below freezing results from sublimation.
Together, evaporation, transpiration, and sublimation, plus volcanic emissions, account for almost all the water vapor in the atmosphere that isn’t inserted through human activities. While evaporation from the oceans is the primary vehicle for driving the surface-to-atmosphere portion of the hydrologic cycle, transpiration is also significant. For example, a cornfield 1 acre in size can transpire as much as 4,000 gallons of water every day.
After the water enters the lower atmosphere, rising air currents carry it upward, often high into the atmosphere, where the air is cooler. In the cool air, water vapor is more likely to condense from a gas to a liquid to form cloud droplets. Cloud droplets can grow and produce precipitation (including rain, snow, sleet, freezing rain, and hail), which is the primary mechanism for transporting water from the atmosphere back to the Earth’s surface.
When precipitation falls over the land surface, it follows various routes in its subsequent paths. Some of it evaporates, returning to the atmosphere; some seeps into the ground as soil moisture or groundwater; and some runs off into rivers and streams. Almost all of the water eventually flows into the oceans or other bodies of water, where the cycle continues. At different stages of the cycle, some of the water is intercepted by humans or other life forms for drinking, washing, irrigating, and a large variety of other uses.
Groundwater is found in two broadly defined layers of the soil, the “zone of aeration,” where gaps in the soil are filled with both air and water, and, further down, the “zone of saturation,” where the gaps are completely filled with water. The boundary between these two zones is known as the water table, which rises or falls as the amount of groundwater changes.
The amount of water in the atmosphere at any moment in time is only 12,900 cubic kilometers, a minute fraction of Earth’s total water supply: if it were to completely rain out, atmospheric moisture would cover the Earth’s surface to a depth of only 2.5 centimeters. However, far more water—in fact, some 495,000 cubic kilometers of it—are cycled through the atmosphere every year. It is as if the entire amount of water in the air were removed and replenished nearly 40 times a year.
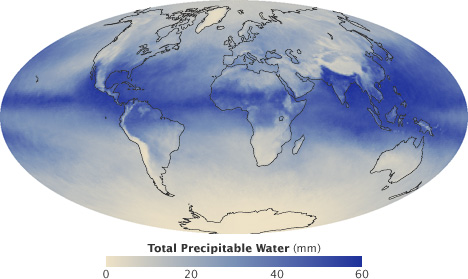
This map shows the distribution of water vapor throughout the depth of the atmosphere during August 2010. Even the wettest regions would form a layer of water only 60 millimeters deep if it were condensed at the surface. (NASA image by Robert Simmon, using AIRS & AMSU data.)
Water continually evaporates, condenses, and precipitates, and on a global basis, evaporation approximately equals precipitation. Because of this equality, the total amount of water vapor in the atmosphere remains approximately the same over time. However, over the continents, precipitation routinely exceeds evaporation, and conversely, over the oceans, evaporation exceeds precipitation.
In the case of the oceans, the continual excess of evaporation versus precipitation would eventually leave the oceans empty if they were not being replenished by additional means. Not only are they being replenished, largely through runoff from the land areas, but over the past 100 years, they have been over-replenished: sea level around the globe has risen approximately 17 centimeters over the course of the twentieth century.
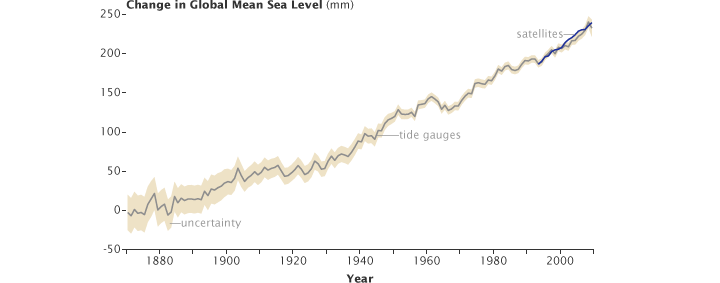
Sea level has been rising over the past century, partly due to thermal expansion of the ocean as it warms, and partly due to the melting of glaciers and ice caps. (Graph ©2010 Australian Commonwealth Scientific and Research Organization.)
Sea level has risen both because of warming of the oceans, causing water to expand and increase in volume, and because more water has been entering the ocean than the amount leaving it through evaporation or other means. A primary cause for increased mass of water entering the ocean is the calving or melting of land ice (ice sheets and glaciers). Sea ice is already in the ocean, so increases or decreases in the annual amount of sea ice do not significantly affect sea level.
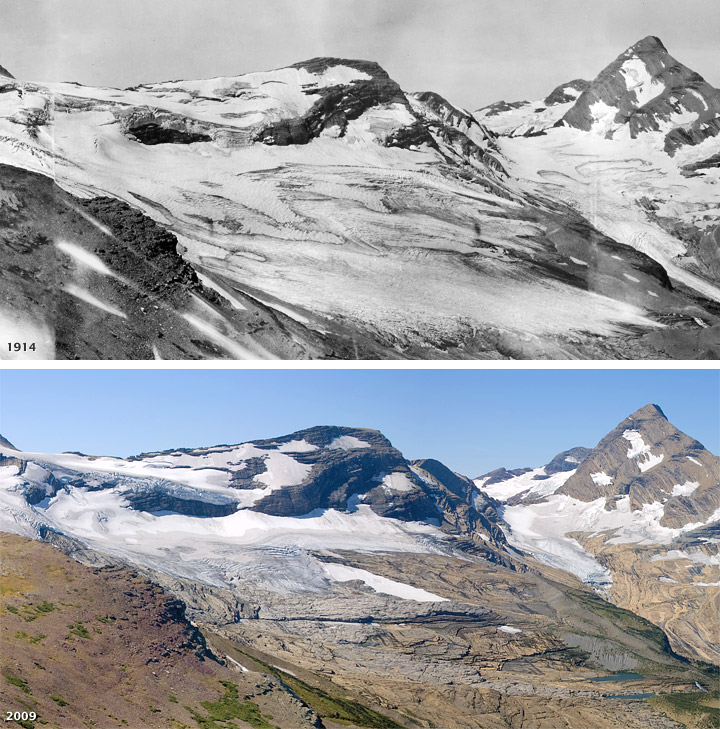
Blackfoot (left) and Jackson (right) glaciers, both in the mountains of Glacier National Park, were joined along their margins in 1914, but have since retreated into separate alpine cirques. The melting of glacial ice is a major contributor to sea level rise. [Photographs by E. B. Stebinger, Glacier National Park archives (1911), and Lisa McKeon, USGS (2009).]
Throughout the hydrologic cycle, there are many paths that a water molecule might follow. Water at the bottom of Lake Superior may eventually rise into the atmosphere and fall as rain in Massachusetts. Runoff from the Massachusetts rain may drain into the Atlantic Ocean and circulate northeastward toward Iceland, destined to become part of a floe of sea ice, or, after evaporation to the atmosphere and precipitation as snow, part of a glacier.
Water molecules can take an immense variety of routes and branching trails that lead them again and again through the three phases of ice, liquid water, and water vapor. For instance, the water molecules that once fell 100 years ago as rain on your great- grandparents’ farmhouse in Iowa might now be falling as snow on your driveway in California.
Among the most serious Earth science and environmental policy issues confronting society are the potential changes in the Earth’s water cycle due to climate change. The science community now generally agrees that the Earth’s climate is undergoing changes in response to natural variability, including solar variability, and increasing concentrations of greenhouse gases and aerosols. Furthermore, agreement is widespread that these changes may profoundly affect atmospheric water vapor concentrations, clouds, precipitation patterns, and runoff and stream flow patterns.
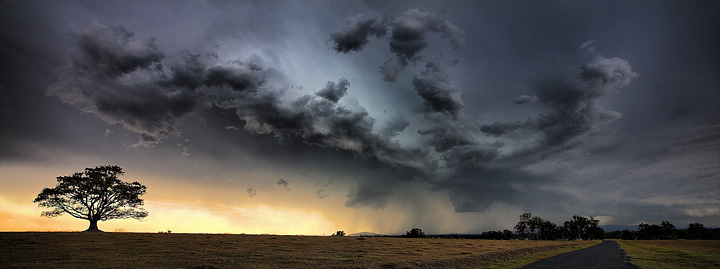
Global climate change will affect the water cycle, likely creating perennial droughts in some areas and frequent floods in others. (Photograph ©2008 Garry Schlatter.)
For example, as the lower atmosphere becomes warmer, evaporation rates will increase, resulting in an increase in the amount of moisture circulating throughout the troposphere (lower atmosphere). An observed consequence of higher water vapor concentrations is the increased frequency of intense precipitation events, mainly over land areas. Furthermore, because of warmer temperatures, more precipitation is falling as rain rather than snow.
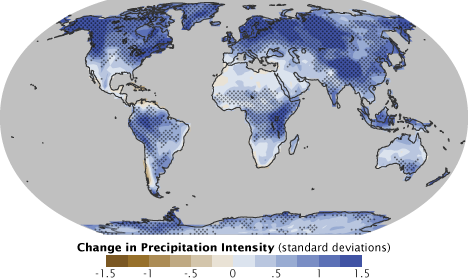
One expected effect of climate change will be an increase in precipitation intensity: a larger proportion of rain will fall in a shorter amount of time than it has historically. Blue represents areas where climate models predict an increase in intensity by the end of the 21st century, brown represents a predicted decrease. (Map adapted from the IPCC Fourth Assessment Report.)
In parts of the Northern Hemisphere, an earlier arrival of spring-like conditions is leading to earlier peaks in snowmelt and resulting river flows. As a consequence, seasons with the highest water demand, typically summer and fall, are being impacted by a reduced availability of fresh water.
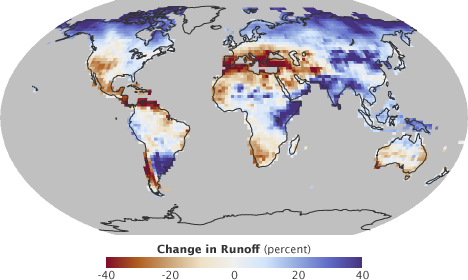
Changes in water runoff into rivers and streams are another expected consequence of climate change by the late 21st Century. This map shows predicted increases in runoff in blue, and decreases in brown and red. (Map by Robert Simmon, using data from Chris Milly, NOAA Geophysical Fluid Dynamics Laboratory.)
Warmer temperatures have led to increased drying of the land surface in some areas, with the effect of an increased incidence and severity of drought. The Palmer Drought Severity Index, which is a measure of soil moisture using precipitation measurements and rough estimates of changes in evaporation, has shown that from 1900 to 2002, the Sahel region of Africa has been experiencing harsher drought conditions. This same index also indicates an opposite trend in southern South America and the south central United States.
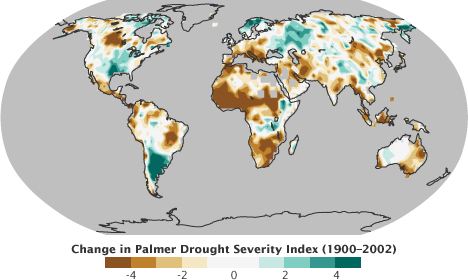
Shifts in the water cycle occurred over the past century due to a combination of natural variations and human forcings. From 1900 to 2002, droughts worsened in Sub-Saharan and southern Africa, eastern Brazil, and Iran (brown). Over the same period western Russia, south-eastern South America, Scandinavia, and the southern United States had less severe droughts (green). (Map adapted from the IPCC Fourth Assessment Report.)
While the brief scenarios described above represent a small portion of the observed changes in the water cycle, it should be noted that many uncertainties remain in the prediction of future climate. These uncertainties derive from the sheer complexity of the climate system, insufficient and incomplete data sets, and inconsistent results given by current climate models. However, state of the art (but still incomplete and imperfect) climate models do consistently predict that precipitation will become more variable, with increased risks of drought and floods at different times and places.
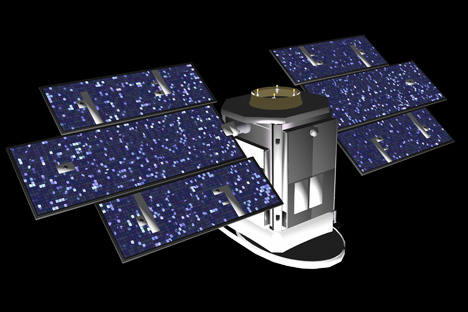
Orbiting satellites are now collecting data relevant to all aspects of the hydrologic cycle, including evaporation, transpiration, condensation, precipitation, and runoff. NASA even has one satellite, Aqua, named specifically for the information it is collecting about the many components of the water cycle.
Aqua launched on May 4, 2002, with six Earth-observing instruments: the Atmospheric Infrared Sounder (AIRS), the Advanced Microwave Sounding Unit (AMSU), the Humidity Sounder for Brazil (HSB), the Advanced Microwave Scanning Radiometer for the Earth Observing System (AMSR-E), the Moderate Resolution Imaging Spectroradiometer (MODIS), and Clouds and the Earth’s Radiant Energy System (CERES).
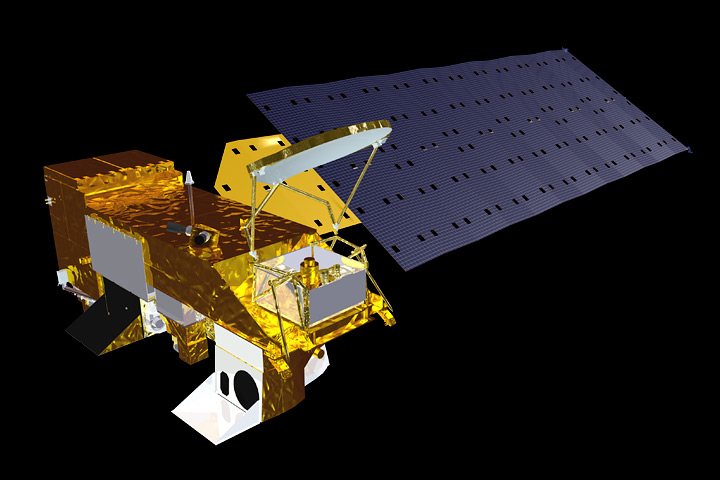
NASA’s Aqua satellite carries a suite of instruments designed primarily to study the water cycle. (NASA image by Marit Jentoft-Nilsen.)
Since water vapor is the Earth’s primary greenhouse gas, and it contributes significantly to uncertainties in projections of future global warming, it is critical to understand how it varies in the Earth system. In the first years of the Aqua mission, AIRS, AMSU, and HSB provided space-based measurements of atmospheric temperature and water vapor that were more accurate than any obtained before; the sensors also made measurements from more altitudes than any previous sensor. The HSB is no longer operational, but the AIRS/AMSU system continues to provide high-quality atmospheric temperature and water vapor measurements.
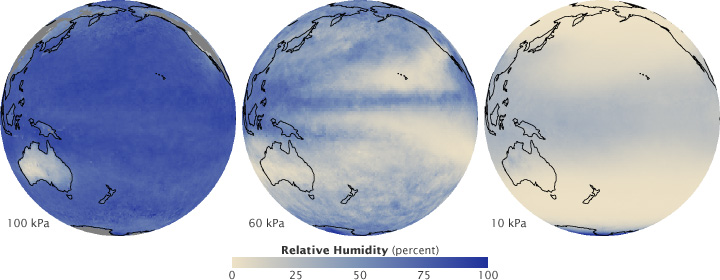
Aqua’s AIRS and AMSU instruments measure relative humidity at multiple pressure levels, which correspond to altitude. Near the surface (100 kPa), the air above the ocean is almost saturated with water, while it is dry above Australia. It is generally drier higher in the atmosphere (60 kPa), except where convection lifts moisture aloft. At the lower edge of the stratosphere (10 kPa) the air is almost universally dry. (NASA maps by Robert Simmon, based on AIRS/AMSU data.)
More recent studies using AIRS data have demonstrated that most of the warming caused by carbon dioxide does not come directly from carbon dioxide, but rather from increased water vapor and other factors that amplify the initial warming. Other studies have shown improved estimation of the landfall of a hurricane in the Bay of Bengal by incorporating AIRS temperature measurements, and improved understanding of large-scale atmospheric patterns such as the Madden-Julian Oscillation.
In addition to their importance to our weather, clouds play a major role in regulating Earth’s climate system. MODIS, CERES, and AIRS all collect data relevant to the study of clouds. The cloud data include the height and area of clouds, the liquid water they contain, and the sizes of cloud droplets and ice particles. The size of cloud particles affects how they reflect and absorb incoming sunlight, and the reflectivity (albedo) of clouds plays a major role in Earth’s energy balance.
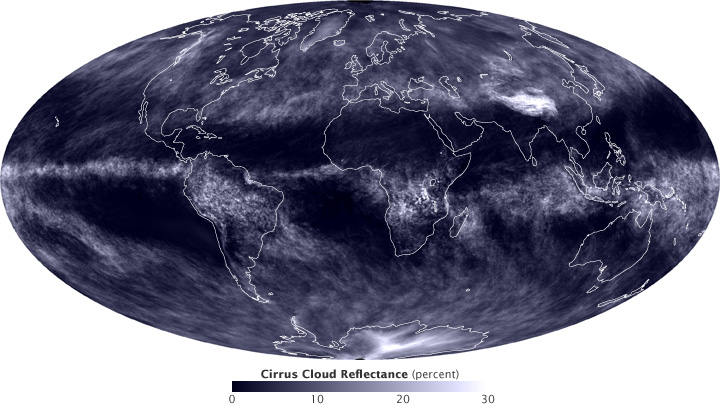
High, thin cirrus clouds reflect relatively little sunlight back into space compared to the amount reflected by thick cumulus clouds. This map shows the reflectivity of cirrus clouds [with a maximum of 30 percent (shown in white)] during March of 2010. (Map by Robert Simmon, using data from the MODIS Atmosphere Team.)
One of the many variables AMSR-E monitors is global precipitation. The sensor measures microwave energy, some of which passes through clouds, and so the sensor can detect the rainfall even under the clouds.
Water in the atmosphere is hardly the only focus of the Aqua mission. Among much else, AMSR-E and MODIS are being used to study sea ice. Sea ice is important to the Earth system not just as an important element in the habitat of polar bears, penguins, and some species of seals, but also because it can insulate the underlying liquid water against heat loss to the often frigid overlying polar atmosphere and because it reflects sunlight that would otherwise be available to warm the ocean.
When it comes to sea ice, AMSR-E and MODIS provide complementary information. AMSR-E doesn’t record as much detail about ice features as MODIS does, but it can distinguish ice versus open water even when it is cloudy. The AMSR-E measurements continue, with improved resolution and accuracy, a satellite record of changes in the extent of polar ice that extends back to the 1970s.
AMSR-E and MODIS also provide monitoring of snow coverage over land, another key indicator of climate change. As with sea ice, AMSR-E allows routine monitoring of the snow, irrespective of cloud cover, but with less spatial detail, while MODIS sees greater spatial detail, but only under cloud-free conditions.
As for liquid water on land, AMSR-E provides information about soil moisture, which is crucial for vegetation including agricultural crops. AMSR-E’s monitoring of soil moisture globally permits, for example, the early identification of signs of drought.
Aqua is the most comprehensive of NASA’s water cycle missions, but it isn’t alone. In fact, the Terra satellite also has MODIS and CERES instruments onboard, and several other spacecraft have made or are making unique water-cycle measurements.
The Ice, Cloud, and Land Elevation Satellite (ICESat) was launched in January 2003, and it collected data on the topography of the Earth’s ice sheets, clouds, vegetation, and the thickness of sea ice off and on until October 2009. A new ICESat mission, ICESat-2, is now under development and is scheduled to launch in 2015.
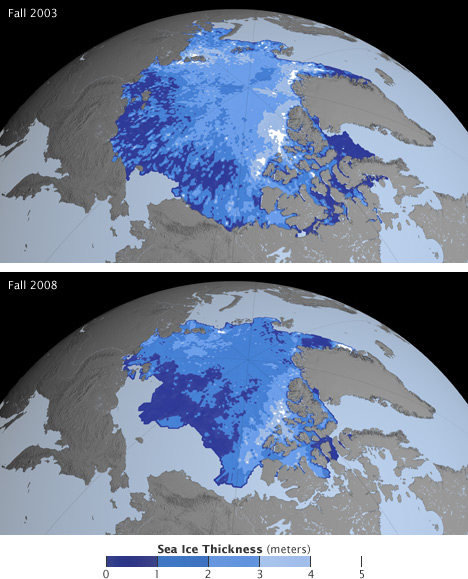
ICESat’s precise observation of the surface elevation of Arctic sea ice enabled measurement of ice thickness. These images show that sea ice thinned from fall 2003 to fall 2008. Dark blue areas are thin ice, white areas are thick ice, gray regions are land, and light blue south of the ice pack represents open water. (NASA images by the NASA GSFC Scientific Visualization Studio, using ICESat data.)
The Gravity Recovery and Climate Experiment (GRACE) is a unique mission that consists of two spacecraft orbiting one behind the other; changes in the distance between the two provide information about the gravity field on the Earth below. Because gravity depends on mass, some of the changes in gravity over time signal a shift in water from one place on Earth to another. Through measurements of changing gravity fields, GRACE scientists are able to derive information about changes in the mass of ice sheets and glaciers and even changes in groundwater around the world.
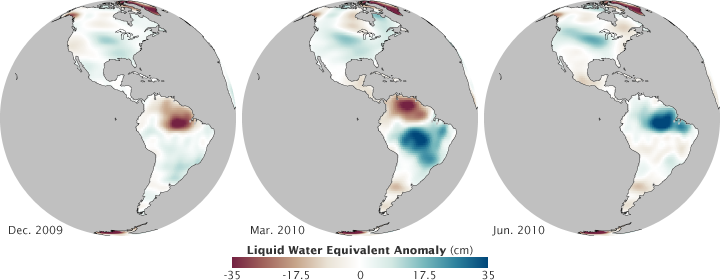
These GRACE data show monthly gravity differences calculated from a 2003-2007 baseline. The big contrasts in the Amazon are due to seasonal changes in rainfall. (NASA maps by Robert Simmon, using GRACE data.)
CloudSat is advancing scientists’ understanding of cloud abundance, distribution, structure, and radiative properties (how they absorb and emit energy, including thermal infrared energy escaping from Earth’s surface). Since 2006, CloudSat has flown the first satellite-based, millimeter-wavelength cloud radar—an instrument that is 1000 times more sensitive than existing weather radars on the ground. Unlike ground-based weather radars that use centimeter wavelengths to detect raindrop-sized particles, CloudSat’s radar allows the detection of the much smaller particles of liquid water and ice in the large cloud masses that contribute significantly to our weather.
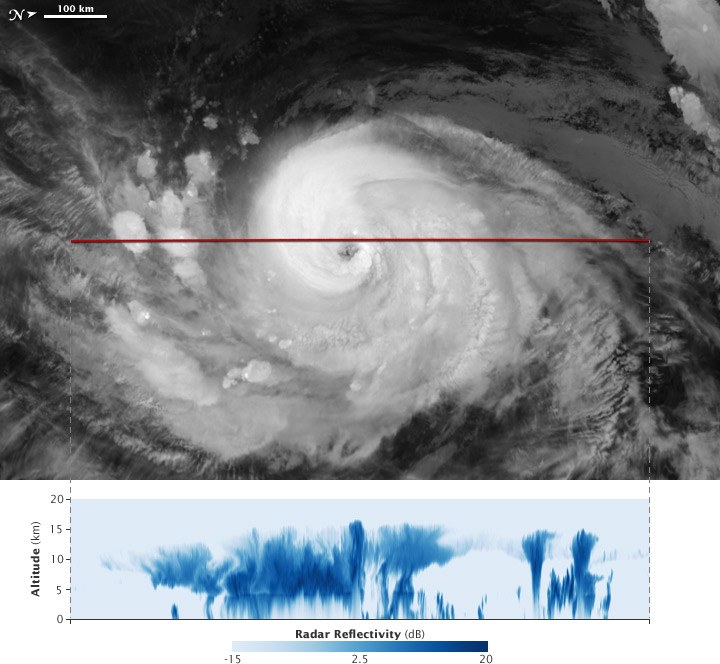
The joint NASA and French Cloud-Aerosol Lidar and Infrared Pathfinder Satellite Observations (CALIPSO) is providing new insight into the role that clouds and atmospheric aerosols (particles like dust and pollution) play in regulating Earth’s weather, climate, and air quality. CALIPSO combines an active laser instrument with passive infrared and visible imagers to probe the vertical structure and properties of thin clouds and aerosols over the globe.
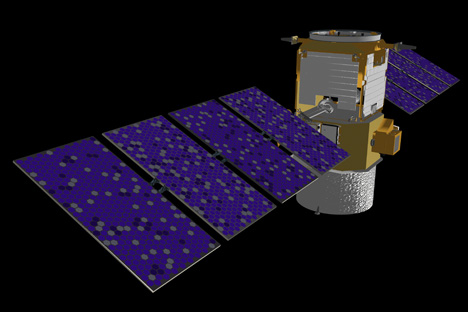
CloudSat (top) and CALIPSO (lower) are two satellites providing detailed views of the structure of clouds. (NASA images by Marit Jentoft-Nilsen.)
