One year ago, the central and eastern parts of the tropical Pacific Ocean were pulsing with heat, a result of one of the most intense El Niño events on record. One year later, La Niña has been relatively quiet, and she does not seem to be staying for long.
La Niña is the cool sister pattern to El Niño. While El Niño knocks down the easterly trade winds and sloshes warm water from the western Pacific to the Americas, La Niña pulls up cool water from the depths of the eastern Pacific, energizes the easterlies, and pushes the warm water back toward Asia. Regions that often get drenched with rain and snow during El Niño often go dry during La Niña events, and vice versa, as atmospheric circulation and jet streams shift with the changing heat and moisture supply from the vast Pacific Ocean.
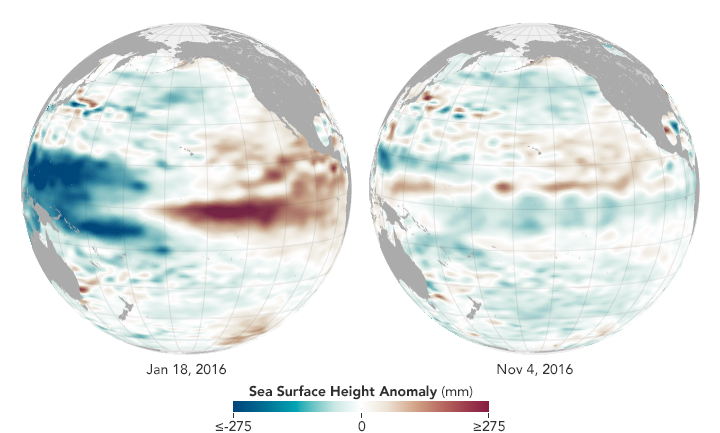
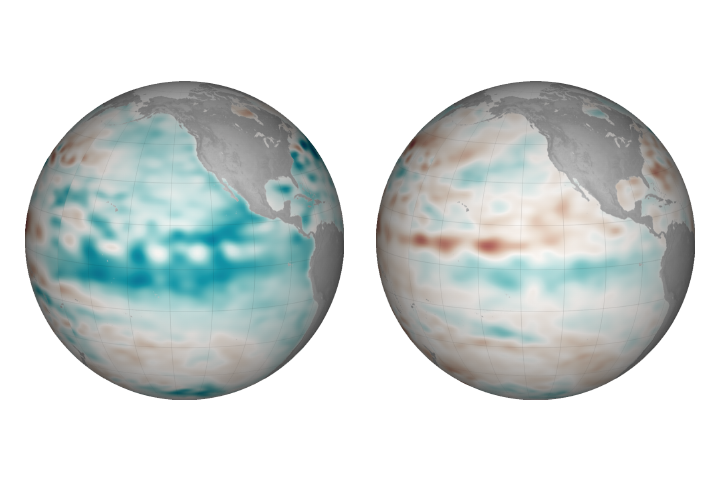
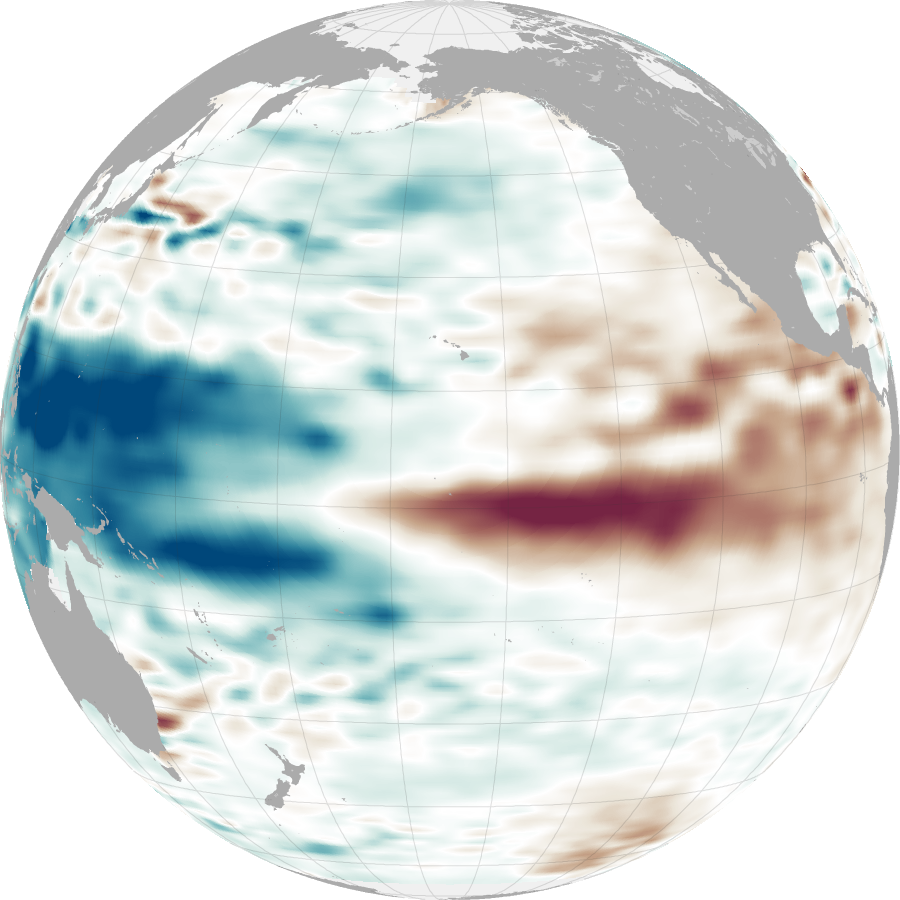
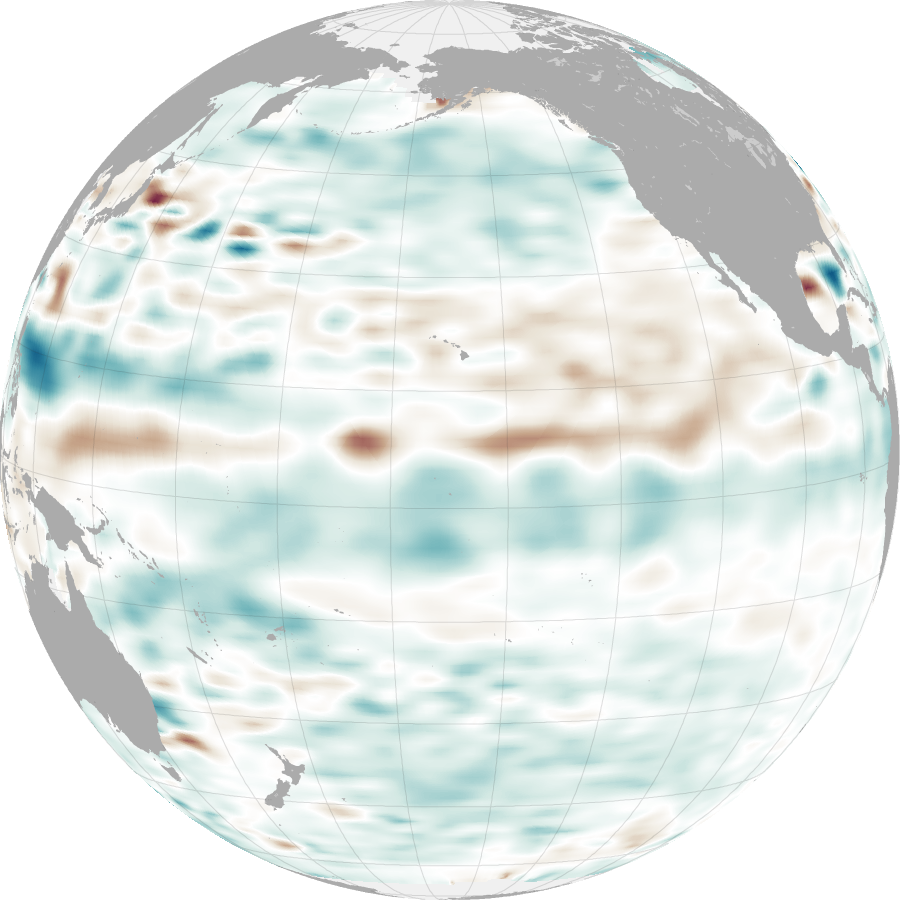
The maps above compare sea surface height anomalies in the Pacific Ocean as observed by NASA scientists on November 4, 2016, near the peak of the current La Niña, and on January 18, 2016, near the peak of last winter’s El Niño. The measurements were made by altimeters on the Jason-2 and Jason-3 satellites, and show averaged sea surface height anomalies. Shades of red indicate areas where the ocean stood higher than the normal sea level; surface height is a good proxy for temperatures because warmer water expands to fill more volume. Shades of blue show where sea level and temperatures were lower than average (water contraction). Normal sea-level conditions appear in white.
In a report issued in December 2016, the NOAA Climate Prediction Center described the latest La Niña as “weak” and likely changing to neutral conditions in early 2017. La Niña conditions—with surface water temperatures at least 0.5° Celsius below normal in the central and eastern Pacific (the Niño 3.4 region from 170° to 120° West longitude)—began to surface in July and August 2016. During last year’s El Niño, surface water temperatures were as much as 2.5°C above the 1981-2010 norm. During the current La Niña, temperatures have not dropped more than 1 degree below normal.
“Last year’s Niño was huge in area, duration, and magnitude,” said Bill Patzert, a climatologist at NASA’s Jet Propulsion Laboratory. “My take is that because it lasted so long and covered such a large area, it damped the return of strong trade winds needed for a healthy Niña. Note the strong positive heat content north of the equator—the entire tropical Pacific between Central America and Hawaii—that lingered into the fall.”
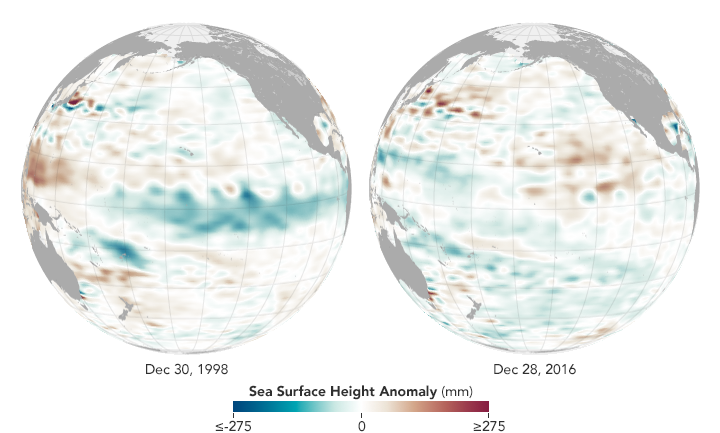
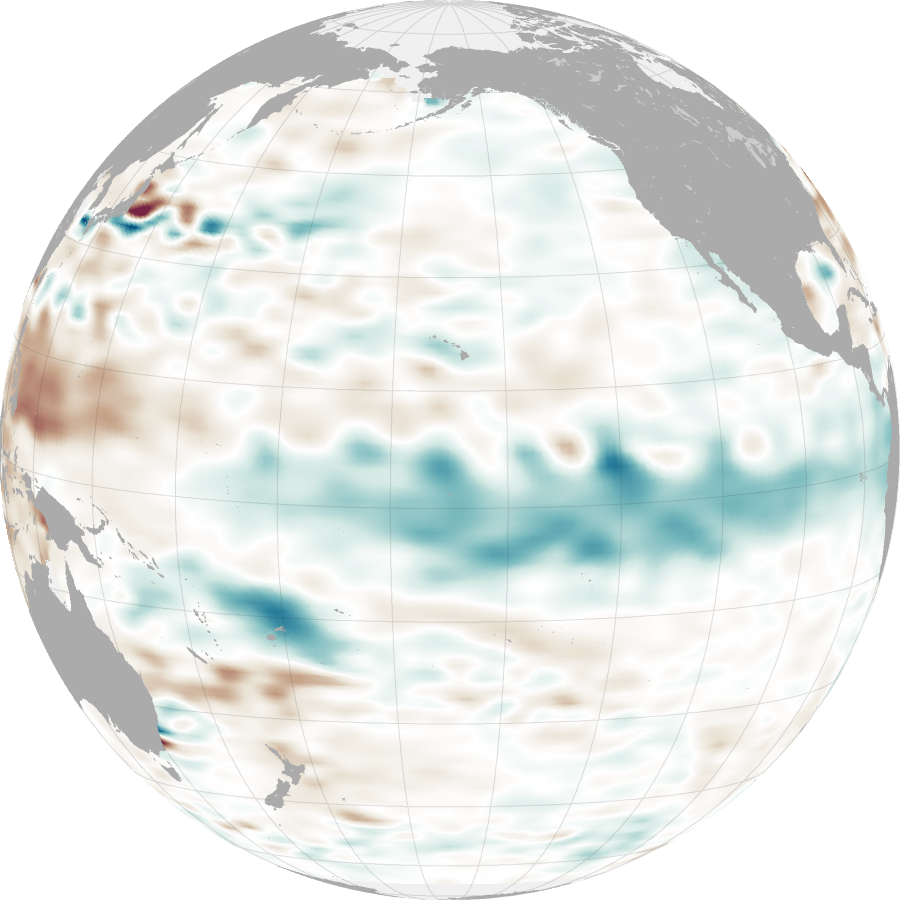
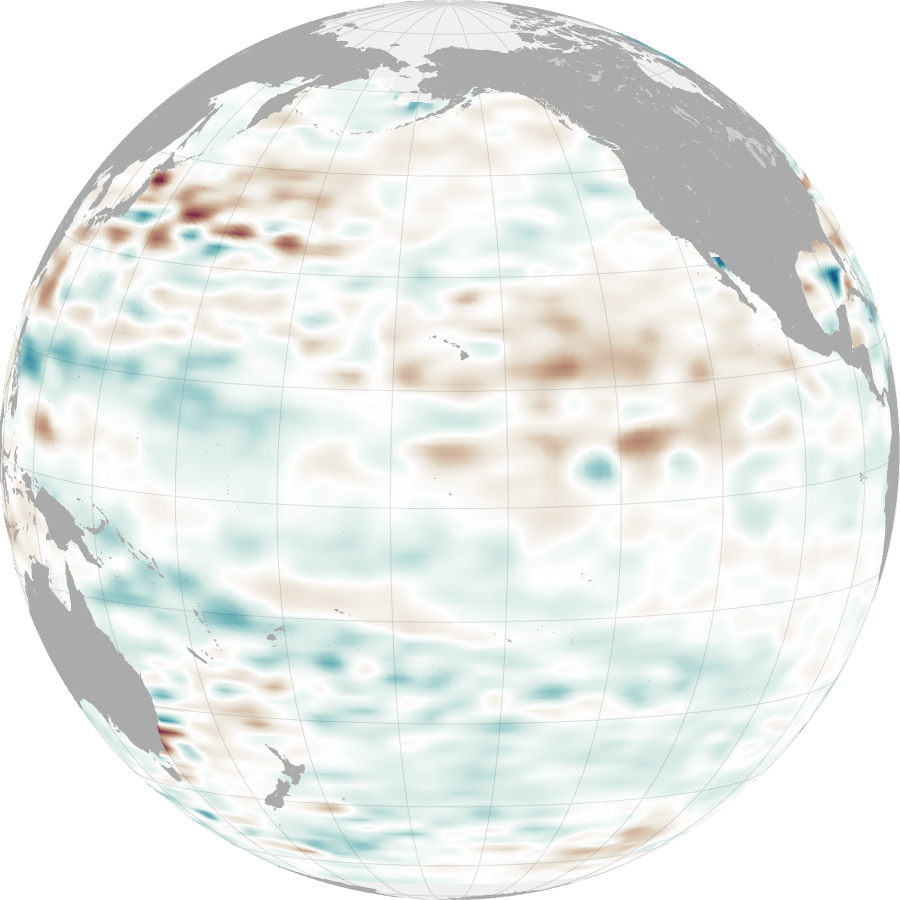
The patterns following the great El Niño of 2015–16 have been starkly different from what occurred after the last major event. In 1997-98, very warm El Niño conditions persisted for roughly 13 months, but were then followed by roughly 32 months of well-below-normal (La Niña) water temperatures in the eastern Pacific. In 2015–2016, water temperatures and sea surface heights were above normal for 19 months, first weakly and then with great gusto in late 2015. But this event has been followed by just five months of weak La Niña conditions that are already fading.
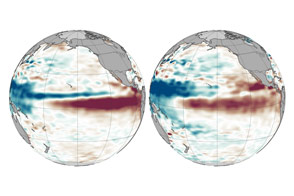
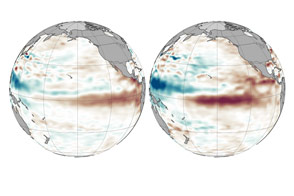
The maps above compare conditions in December 2016 with December 1998, one of the strongest La Niña events on record. The data come from Jason-3 and from the TOPEX-Poseidon mission.
“As with investing, past performance does not guarantee future results for the ENSO cycle,” wrote ocean climatologist Mike McPhaden of the NOAA Pacific Marine Environmental Laboratory in an email. “Though there are common features that characterize all El Niños and La Niñas, each one is different with its own unique personality. That a strong La Niña followed a strong El Niño in 1997-98 does not mean that all strong El Niños are followed by strong La Niñas.”
“What factors have limited the growth of this La Niña event is a great research question, one that I am sure many people will be investigating in the near future,” McPhaden added. “The climate system is very complex, and many processes are at work at any given point in time and space. It could be just the randomness of the climate system that kept this La Nina from taking full flight. Or maybe it is the fact that the Pacific Decadal Oscillation has been in a mostly warm state since 2014, with elevated temperatures in the tropical Pacific making it harder to develop cold anomalies there.”
Mike Halpert, deputy director of the NOAA Climate Prediction Center, noted that the current pattern is somewhat similar to 1982–83, when another strong El Niño was followed by a relatively modest La Niña. “Just when you think you have seen everything and think you know what to expect, something happens that you just can’t explain,” he noted. “There are many rhythms and natural variabilities, and nature will always keep it interesting.”
NASA Earth Observatory maps by Jesse Allen, using TOPEX-Poseidon, Jason-2, and Jason-3 data provided by Akiko Kayashi and Bill Patzert, NASA/JPL Ocean Surface Topography Team. Caption by Mike Carlowicz.
alert message


