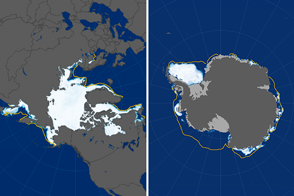
As previously reported, Arctic sea ice cover was lower in November 2016 than any other November in the satellite record. It turns out that the Arctic was not alone. Sea ice at the other pole, around Antarctica, also reached a record November low.
During this time of year, the Arctic Ocean and neighboring seas are refreezing after the annual summer melt season. Conversely, the sea ice fringing Antarctica is normally melting at this time of year, during the austral spring and summer. What is unusual is the amount of melting so far in the Antarctic, spurred by warm air temperatures and shifting winds.
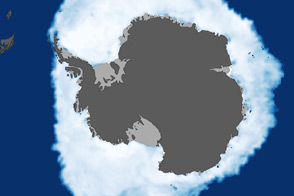
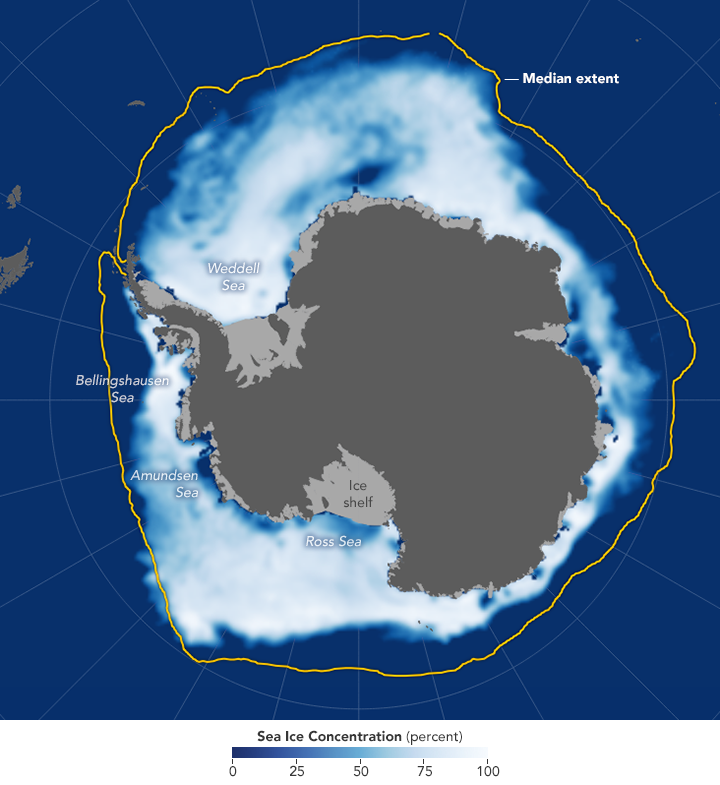
The map above shows the average concentration of Antarctic sea ice for November 2016. Opaque white areas indicate the greatest concentration, and dark blue areas are open water. All icy areas pictured here have an ice concentration of at least 15 percent (the minimum at which space-based measurements give a reliable measure), and cover a total area that scientists refer to as the “ice extent.”
The ice extent for November 2016 averaged just 14.54 million square kilometers (5.61 million square miles). The yellow line shows the median extent from 1981 to 2010, and gives an idea of how conditions this November strayed from the norm. Specifically, the November extent this year was 1.81 million square kilometers (699,000 square miles) below the 1981 to 2010 average.
The melt season started early this year, after Antarctic sea ice reached its annual maximum extent on August 31. By November, the ice reached daily record lows amid air temperatures that were 2 to 4 degrees Celsius (4 to 7 Fahrenheit) above average. Winds that usually disperse the ice instead shifted direction and compressed it around various land areas.
It remains to be seen how much Antarctic sea ice will melt during the remainder of the season; sea ice usually reaches its annual minimum extent in February. In some places around the continent, sea ice can melt completely before starting the annual cycle of refreezing.
In recent years, notably from 2012 to 2014, the period of refreezing has culminated in record-high maximum extents. On an annual basis, the total Antarctic sea ice extent has increased about 1 percent per decade since 1979. Still, the long-term trend still shows a global decline in sea ice. The chart of global extent demonstrates how, over the long term, the slight increases in Antarctic sea ice have not offset the large losses in the Arctic.
NASA Earth Observatory images by Joshua Stevens, using data from the National Snow and Ice Data Center. Caption by Kathryn Hansen.