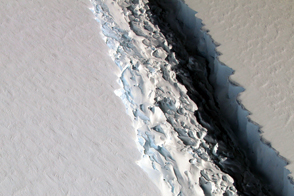
Earth’s ice is changing, from mountain glaciers to ice sheets to ice shelves. For the most part, land-based ice has been shrinking, and the very definition of a “glacial pace” has changed within our lifetimes. Now researchers have the tools to see those changes every few weeks and at scales as small as 5 meters (16 feet).
Using freely available data from the Landsat 8 satellite, scientists are working to provide a near-real-time view of every large glacier and ice sheet on Earth. A group of scientists from the National Snow and Ice Data Center (NSIDC), the University of Alaska–Fairbanks, the University of Bristol, and the Jet Propulsion Laboratory (JPL) have started the Global Land Ice Velocity Extraction project (GoLIVE), a NASA-funded effort to better understand how ice flow is changing worldwide.
“We are now able to map how the skin of the ice is moving,” said Ted Scambos, senior research scientist at NSIDC and lead for the GoLIVE project. “From now on, we’re going to be able to track all of the different types of changes in glaciers. There’s so much science to extract from the data.” The effort was described at the 2016 fall meeting of the American Geophysical Union.
Evidence strongly suggests that the loss of ice from glaciers and ice sheets has been the largest contributor to sea level rise over the past three decades, with waters rising at a global average rate of 3.3 millimeters per year. By examining changes in ice flow in combination with data on ocean and atmospheric changes, the researchers hope to determine what causes ice masses to change and how much ice will flow into the ocean. The satellite-based approach is particularly valuable in remote landscapes, where ground- and airplane-based observations are expensive, dangerous, and intermittent.
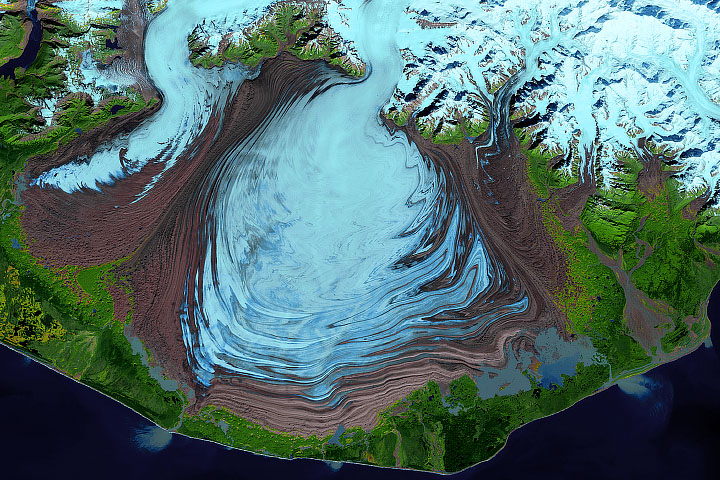
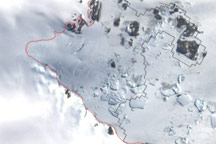
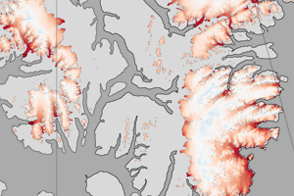
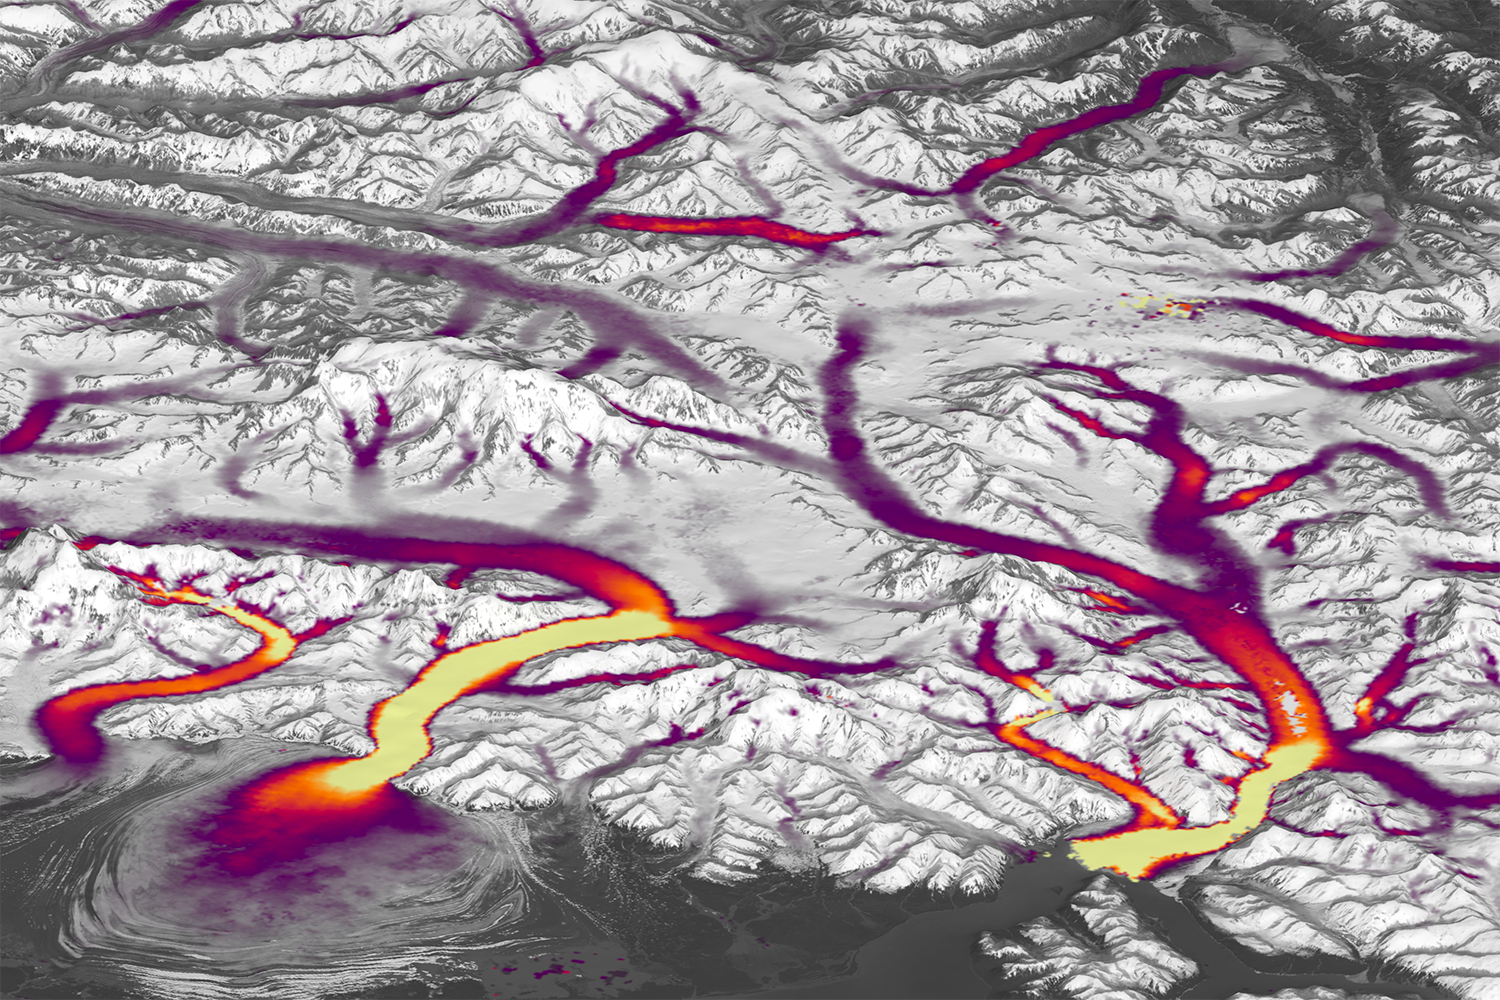
In Alaska and Canada’s Yukon Territory, for instance, most glaciers are so remote that speedup events can go unnoticed for months until a pilot flies over the region and reports disrupted ice, notes Mark Fahnestock of the University of Alaska. The map at the top of this page, based on an analysis by GoLIVE investigators, shows the velocity of ice in southeastern Alaska near Malaspina and Hubbard glaciers.
“By measuring ice flow all the time, we can identify a surge as it starts, providing an entirely new way to follow this phenomenon,” Fahnestock said. “We can also follow large seasonal swings in tidewater glaciers as they respond to their environment. Scientists need to see all of this variability in order to identify trends.”
Automation has been key to this ice velocity mapping effort. Landsat 8 collects images of roughly 700 sunlit parcels the planet every day; over the course of 16 days, it observes the entire land surface of Earth in multiple visible and infrared wavelengths. This means scientists can view changes in the same spot on Earth every 16 days (or 32, 48, 64, etc., as cloud cover allows).
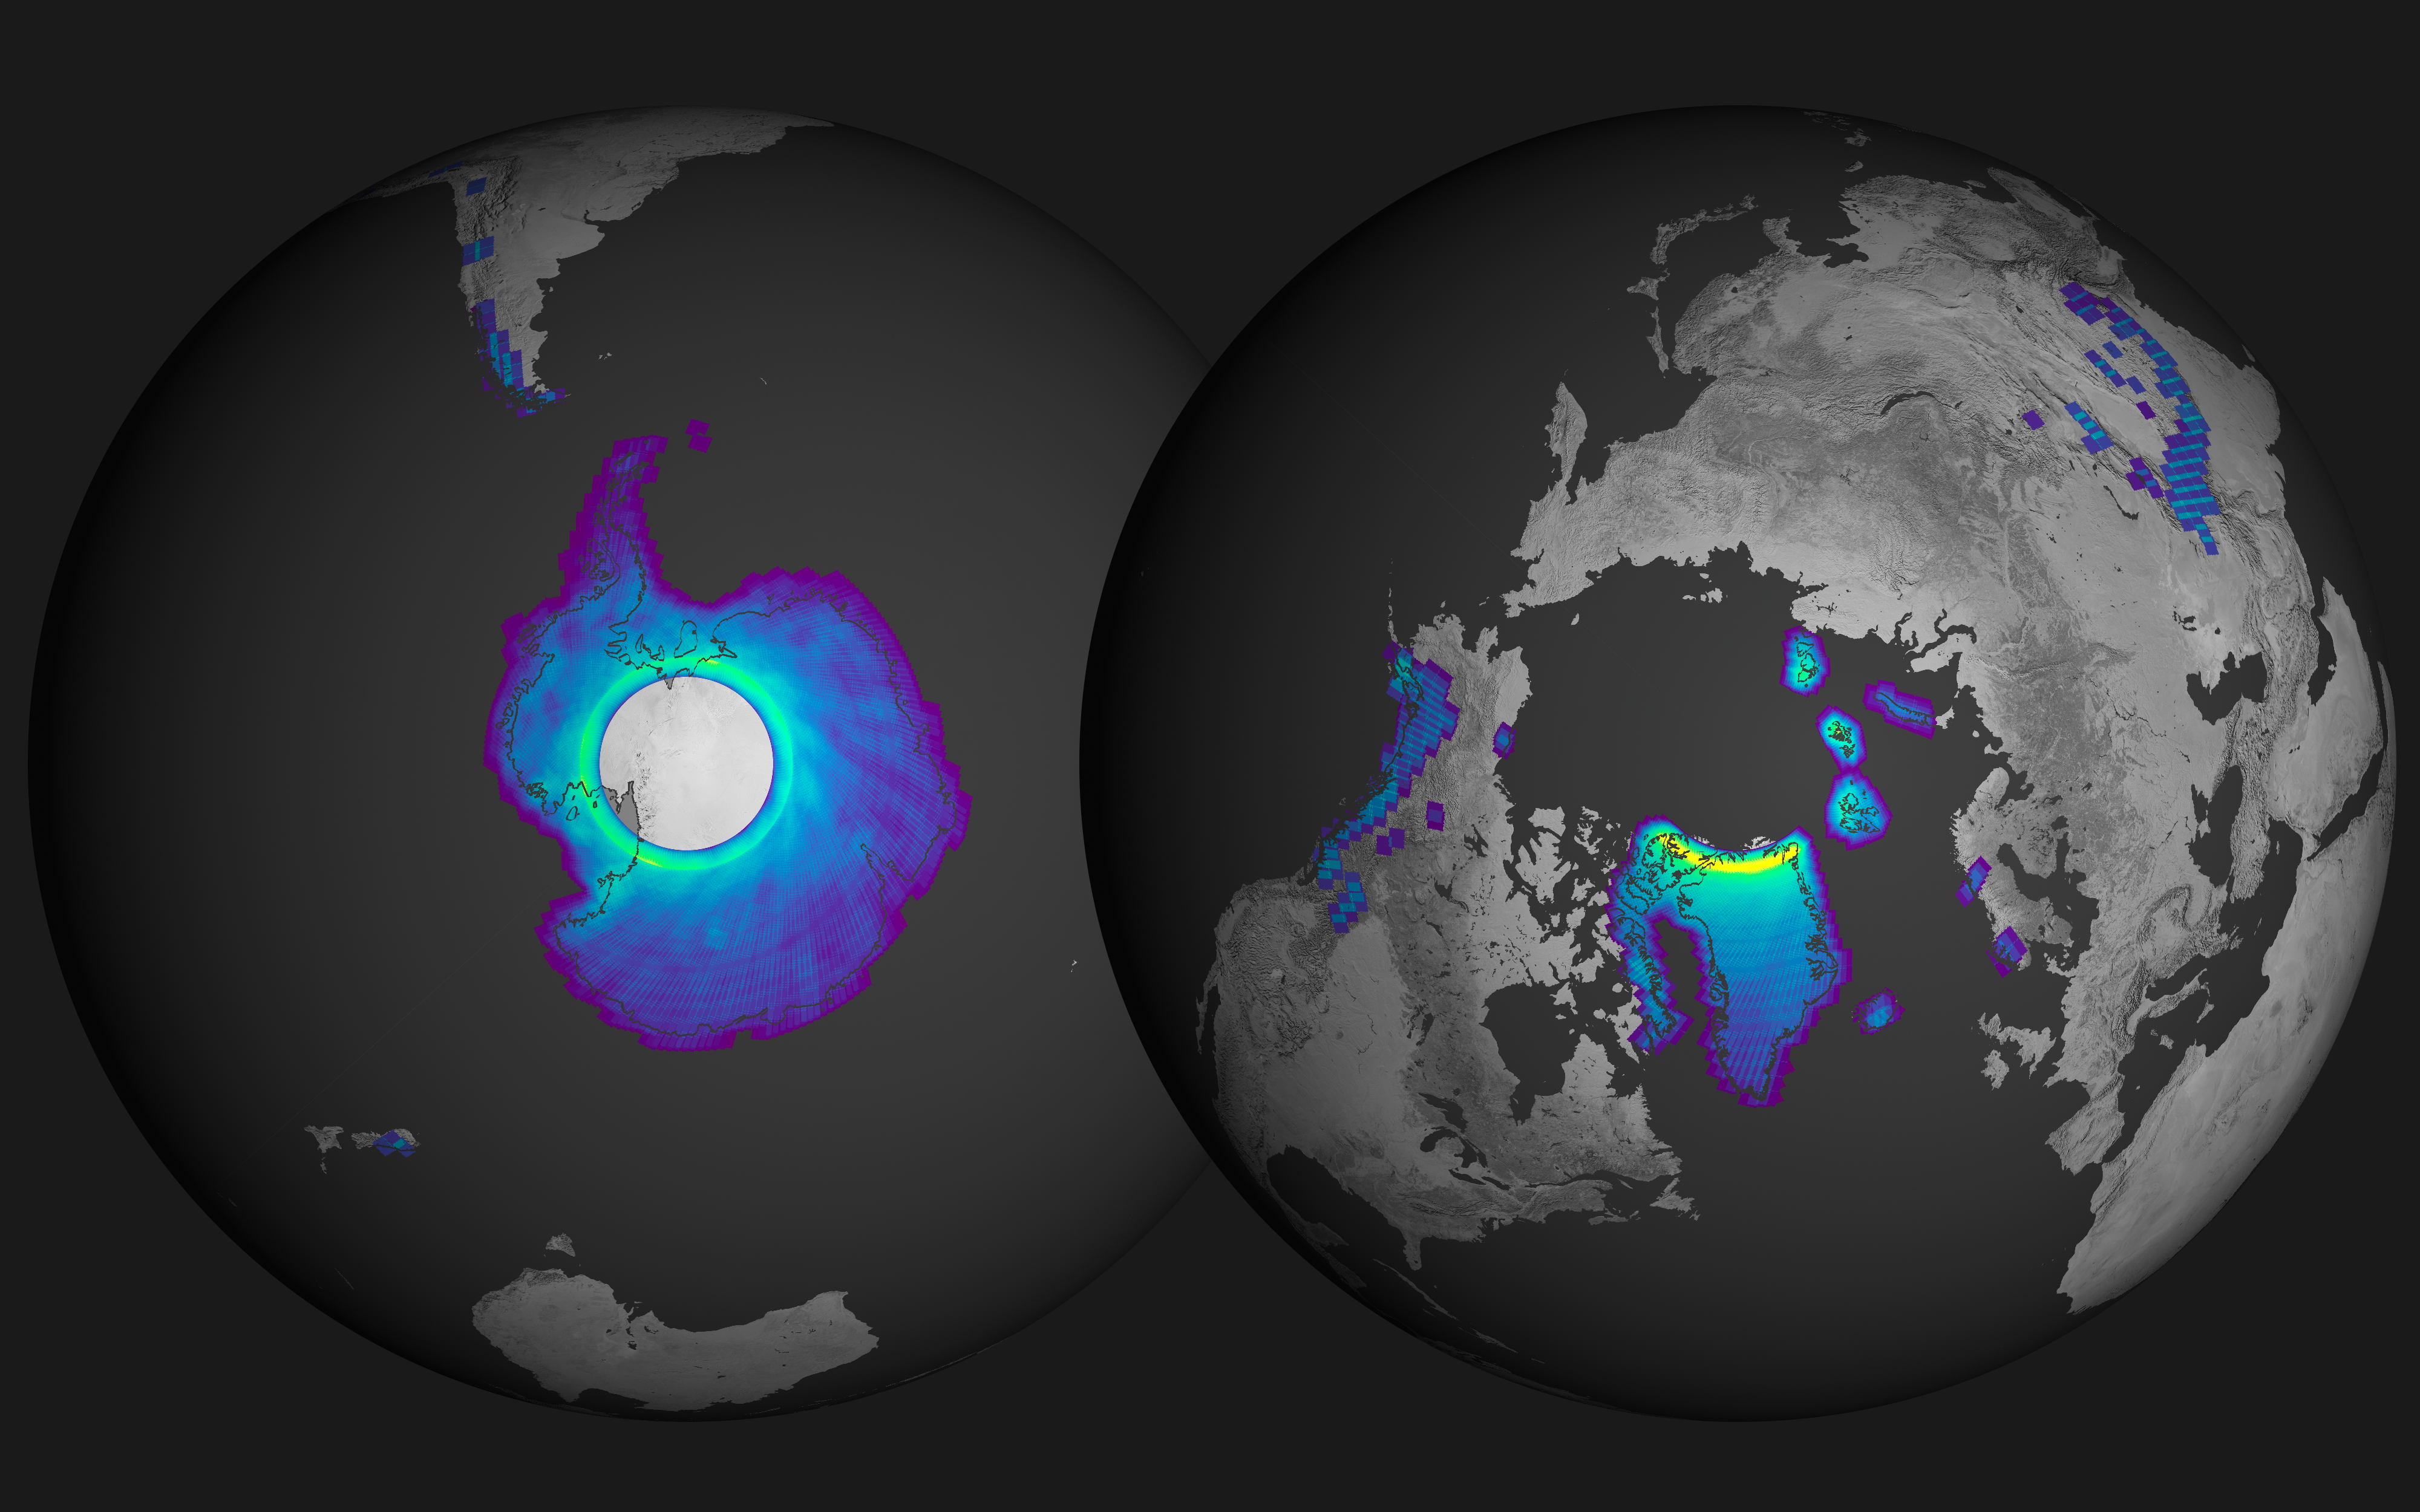
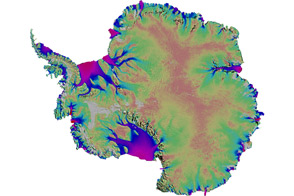
It also means there is a huge amount of data to process and analyze. From 2013 to 2016, Landsat 8 collected thousands of images from Antarctica alone. The globes above show how many times Landsat 8 passed over a given icy parcel in 2015 alone. As many as 150 to 200 images were collected over the brightest yellow and green areas, while purple areas had just a handful of useful images because of frequent cloud cover and fewer orbital passes. Due to the nature of the satellite’s polar orbit, areas in the far north and south can be imaged more frequently (when there is sunlight).
The imaging system on Landsat 8 is far more sensitive than previous Landsat sensors, distinguishing far more subtle differences in shading and surface texture. The GoLIVE team has written software that allows researchers to follow these subtle features, like bumps or dune-like patterns on ice surfaces. By comparing images of the same location on different dates, researchers can track individual features and determine the speed of the surface flow.
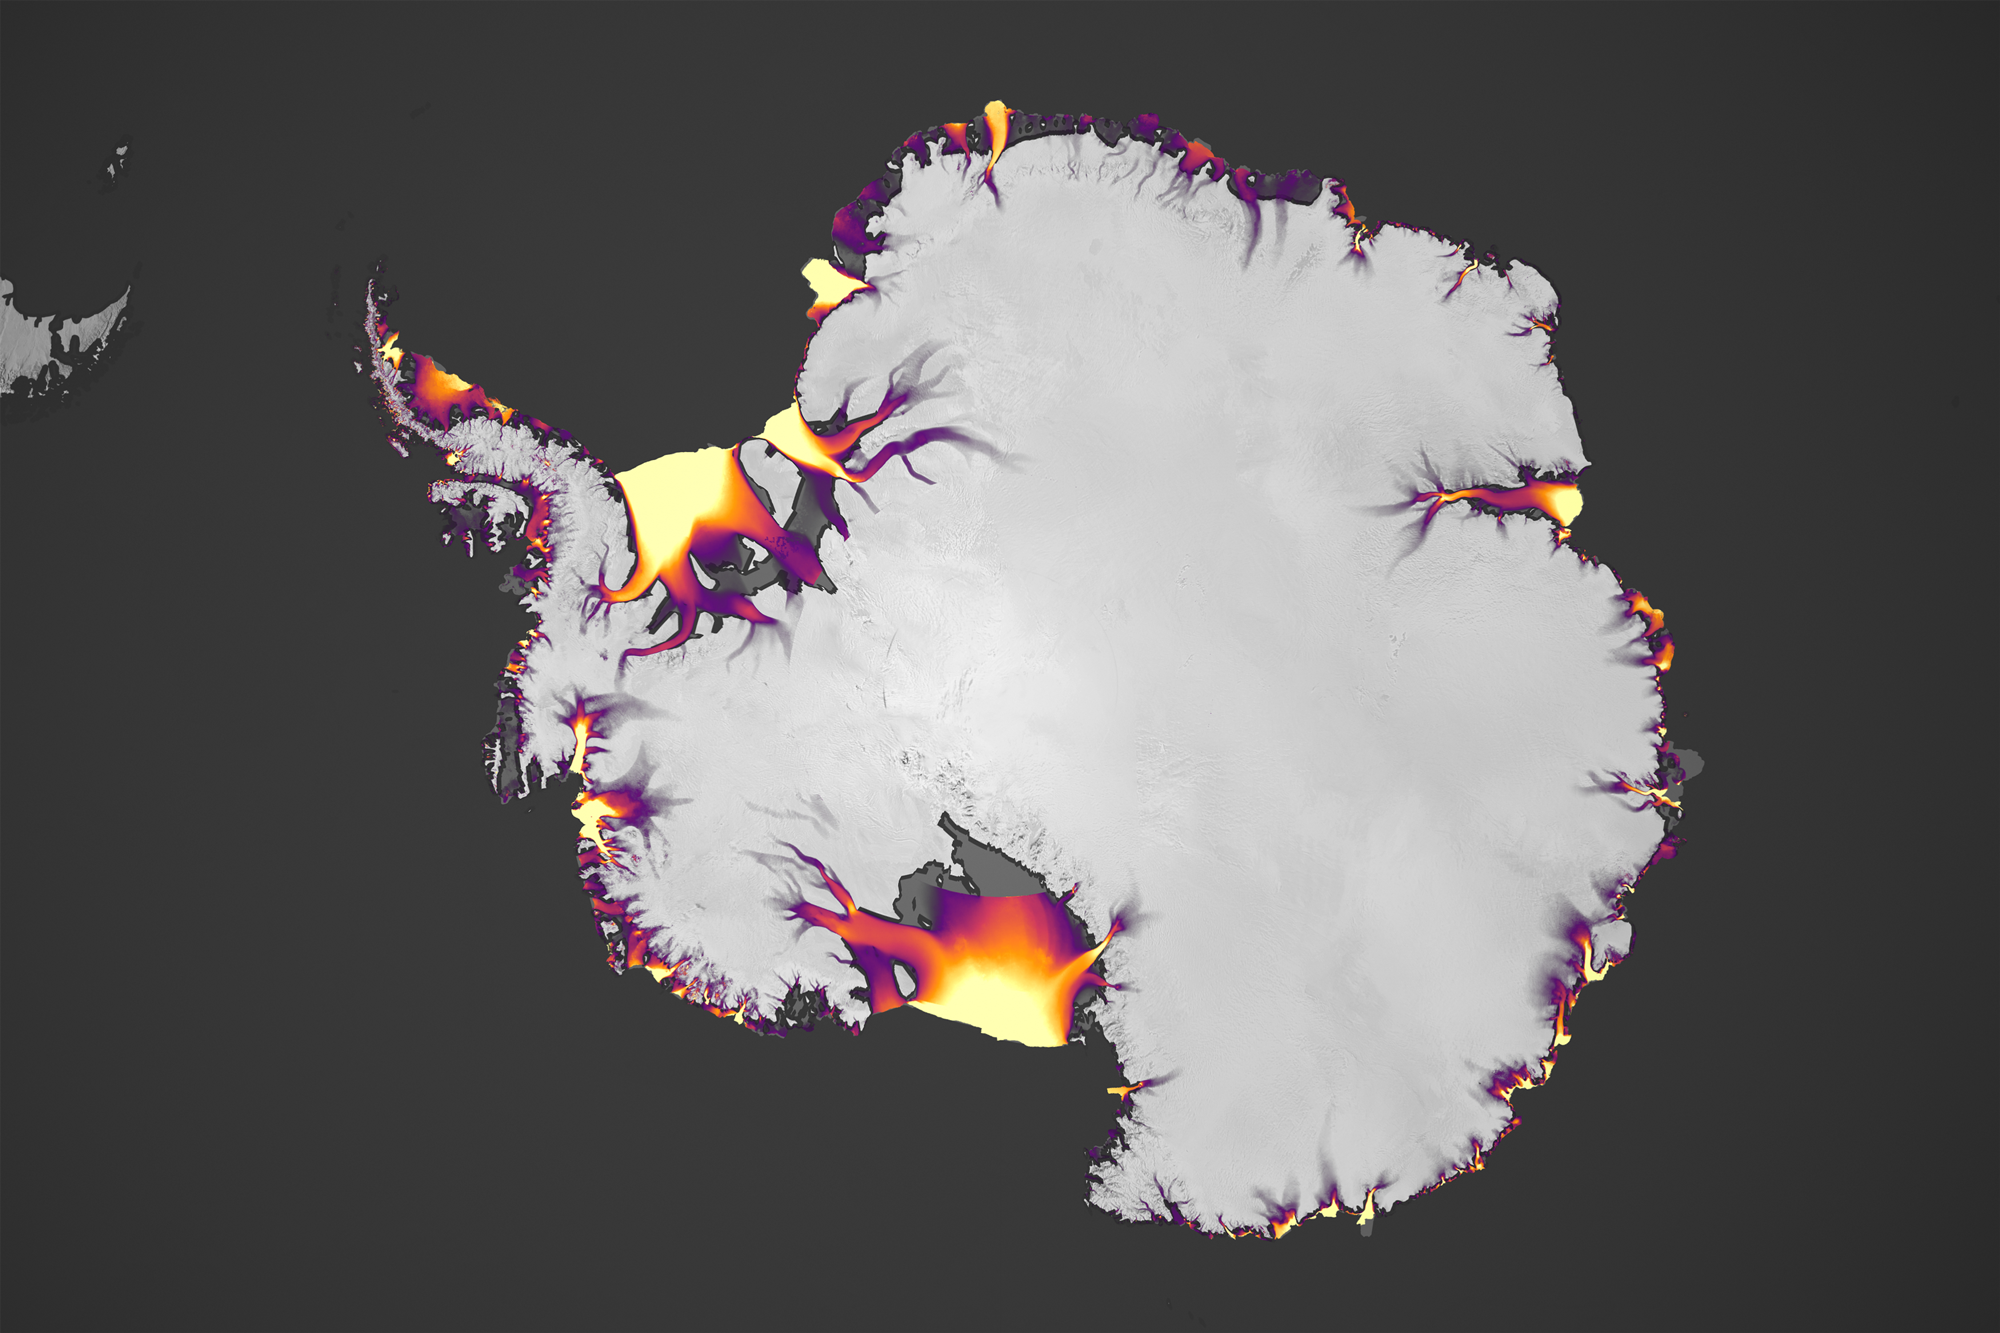
“The question is: how sensitive are these ice sheets to changes in the atmosphere and the ocean?” said Alex Gardner of JPL. “We could wait and see, or we could look to the past to help inform what is most likely to happen in the future.”
Gardner has been looking closely at Antarctica, with ice velocities represented in the map below. He is working to combine the new Landsat 8 ice-flow data with prior maps of the continent’s glacier flow in the hopes of understanding decadal changes across the entirety of the ice sheet. Almost 2,000 cubic kilometers of ice flows into the Southern Ocean from Antarctica each year.
Twila Moon, an ice scientist at the University of Bristol, is using the global maps to expand her research in Greenland. With the new database, she can study the movements of more than 240 glaciers, nearly all of the outlets from the ice sheet. And with Landsat 8 making an overpass every 16 days, she has an opportunity to detect seasonal changes and cyclical patterns.
While most glaciers speed up in the warmer summer months, Moon has found several that slow down dramatically in the mid- to late-summer. “We can group these glaciers by looking at the similarities in their behavior,” Moon said. “It’s providing an opportunity to get at the underlying drivers of why they change.” With measurements of what the seasonal shifts do to glacier speed, scientists can extrapolate what might happen to those glaciers as global temperatures continue to climb.
NASA Earth Observatory images by Joshua Stevens, using Landsat-derived ice velocity data courtesy of Alex Gardner, NASA Jet Propulsion Laboratory/California Institute of Technology and ASTER GDEM data from the NASA/GSFC/METI/ERSDAC/JAROS, and U.S./Japan ASTER Science Team. Caption by Kate Ramsayer and Mike Carlowicz.
alert message