Wind energy has the potential to provide 10 to 15 percent of the world’s future energy, according to Paul Dimotakis, chief technologist at NASA’s Jet Propulsion Laboratory. Once windmills are installed, wind can be converted to electricity inexpensively. But not everyone likes wind farms. The giant collection of whirling blades mars scenic views and can kill birds and bats, particularly if located in a high-traffic flyway. To minimize these risks, one solution may be to place wind farms in the ocean. Wind tends to blow stronger over the ocean than over land. The ocean presents a smooth surface over which wind can glide without interruption, while hills, mountains, and forests tend to slow or channel wind over land.
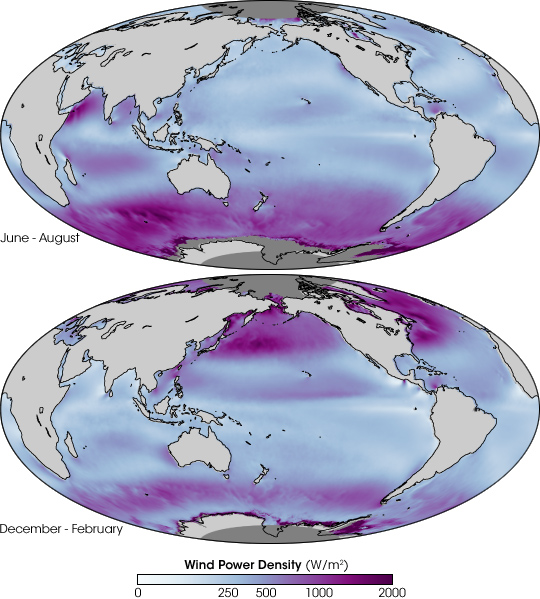
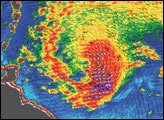
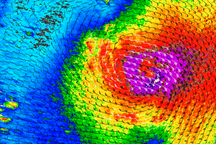
But, as any sailor could tell you, wind over the ocean isn’t consistent. In some places, the air is still, while in others, the wind blows fiercely. To identify potential wind farm locations, NASA scientists Tim Liu, Wenqing Tang, and Xiaosu Xie, all at the Jet Propulsion Laboratory, mapped out average wind intensity over the ocean between 2000 and 2007. They created their maps from data collected by NASA’s Quick Scatterometer (QuikSCAT), which measures wind speed and direction over the world’s oceans. The satellite sends pulses of microwave energy through the atmosphere to the ocean surface and measures the energy that bounces back from the wind-roughened surface. The energy of the microwave pulses changes depending on wind speed and direction. The scientists averaged QuikSCAT’s measured wind speeds by season, and then calculated the wind power density, the amount of energy that could be derived from a wind turbine in a given location. Their maps for the winter and summer seasons are shown here.
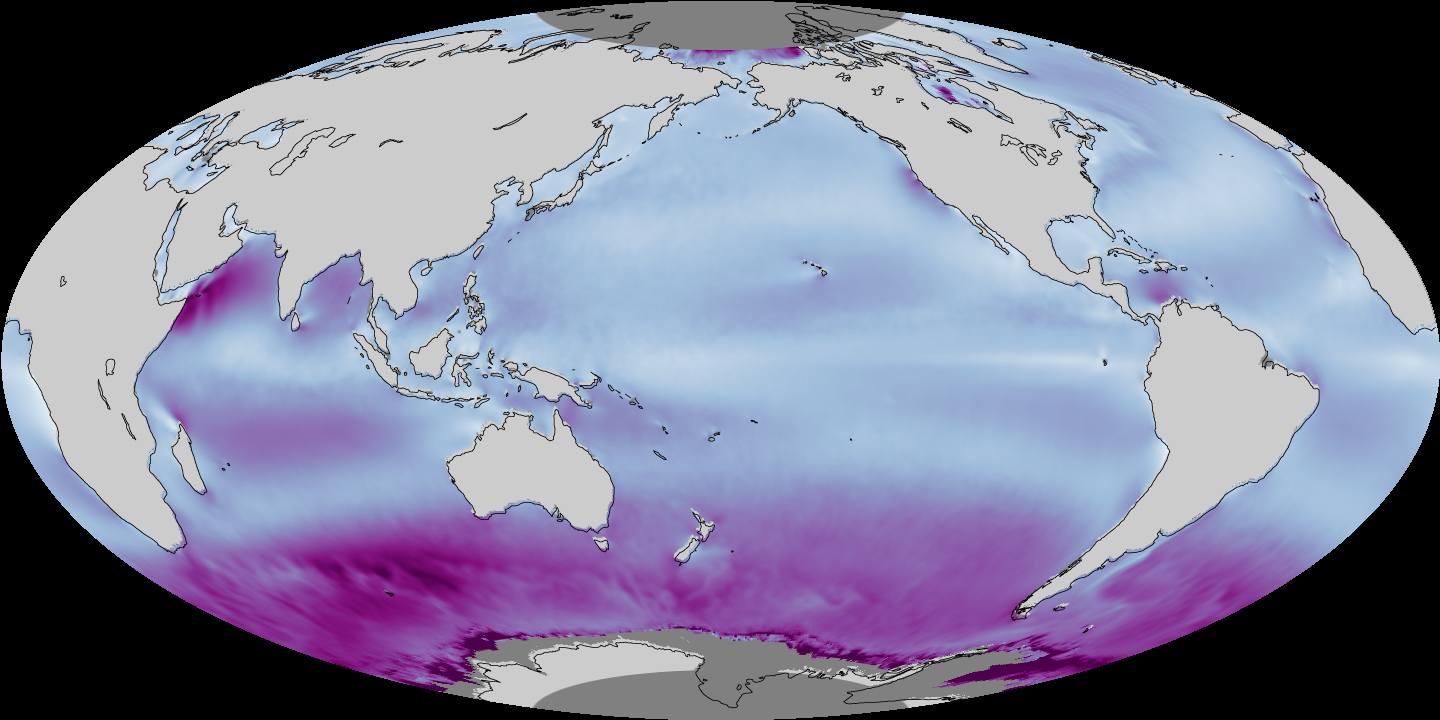
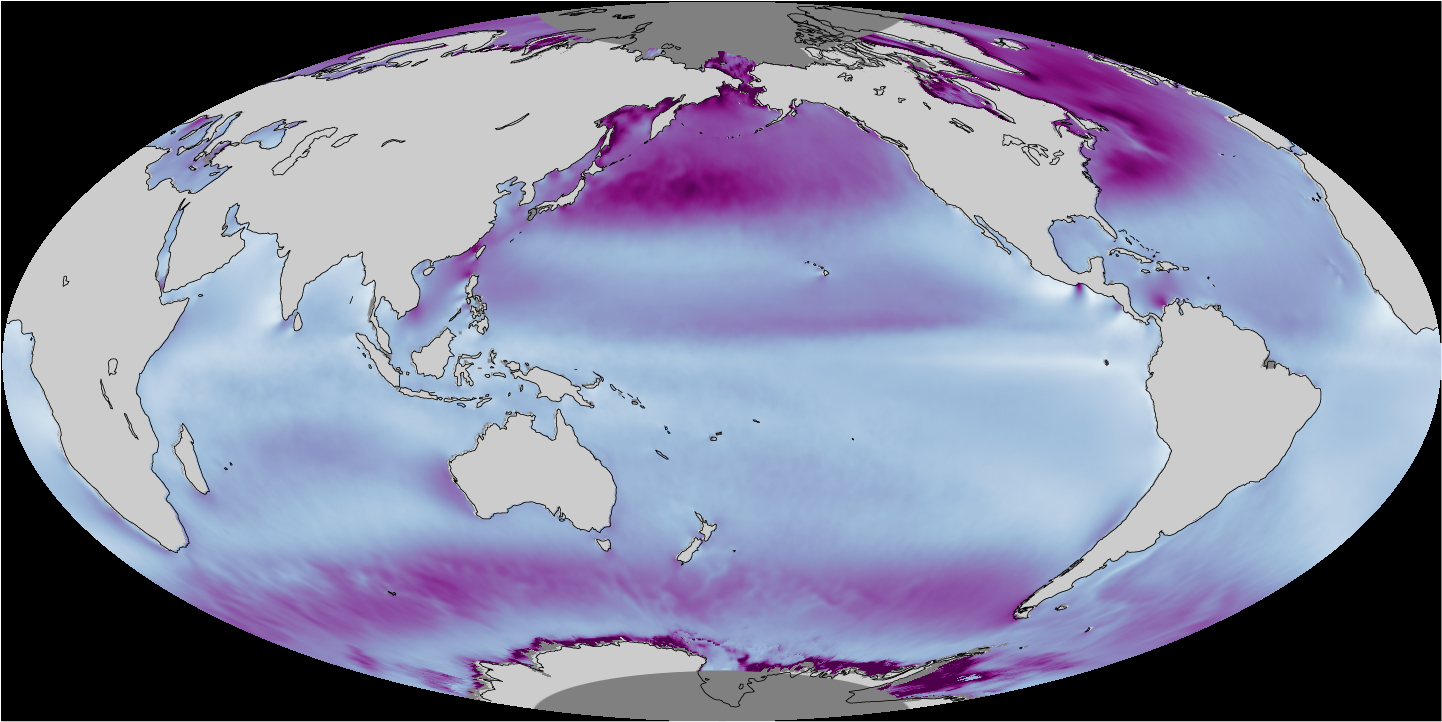
Wind strength is influenced by seasonal patterns, land-ocean interactions, land topography, and ocean temperatures. All of these interactions are evident in this pair of images. Areas of high wind power density, where winds are strongest, are purple, while low power density regions are light blue and white.
The largest patterns shown in the images are seasonal patterns. In December, January, and February, winter storms fuel strong winds in the mid-latitudes of the Northern Hemisphere. In June, July, and August, winter reigns in the Southern Hemisphere, and the pattern is reversed. The Asian monsoon also controls the seasonal distribution of wind. In June, July, and August, strong winds gust across the Bay of Bengal and the Arabian Sea. From December to February, the monsoon winds blow over the East China Sea. Finally, the trade winds trace their way across the tropics, stronger in the winter than in the summer.
In places where the land and the ocean interact to generate strong winds, the wind power density is more consistent. Winds accelerate as they deflect around a bit of land sticking into the ocean. This feature is most obvious off the southern tip of South America, which has high wind potential in both summer and winter. The effect occurs in other locations, such as off Tasmania, New Zealand, and northern California, and is easiest to see in the summer when seasonal winds are calmer.
The spot of brilliant purple in an otherwise calm ocean off the Pacific coast of Central America in December, January, and February is an example of strong winds created by the topography of the land. In Central America, as in other places, mountains channel the wind, creating a natural wind tunnel that sends strong gusts over the ocean.
The final wind pattern shown in this image is the wind created by the ocean itself. Warm ocean currents naturally warm the air above them. When ocean currents carry warm water into an area of cool water, or vice versa, the temperature difference in the air generates wind. The clearest example in these images is the Gulf Stream, which snakes up the east coast of the United States and east over the North Atlantic. In both winter and summer, winds are stronger over the Gulf Stream than the surrounding ocean.
NASA image created by Jesse Allen, using data provided courtesy of Timothy Liu, Wenqing Tang, and Xiaosu Xie, NASA/JPL. Caption by Holli Riebeek.

