Of the six inhabited continents on Earth, Australia is the driest. Its water resources are scarce, and climate change is not helping. The austral summers of 2012–13 and 2013–14 broke heat record after heat record, earning them the moniker of “Angry Summers.”
Since record keeping began in 1860, no period has been drier in southeastern Australia than the Millennium Drought. The lack of rain between 1997 and 2009 led to livestock losses, crop failures, and percentage drops in the Australian gross domestic product. There were dust storms and bushfires and lots of ecological fallout.
South of Adelaide, the famous Coorong Lagoon waterfowl sanctuary was cut off from its main freshwater source for three long years; this turned half of it into a lifeless dead sea (with salinity levels matching the Dead Sea between Israel and Jordan). The nearby Goolwa wetlands dried out, then acidified. The Barmah-Millewa Forest, an internationally recognized wetland famous for its river red gum trees, lost many of those iconic trees. Inland, the Darling River set a world record for a 1000-kilometer (600 mile) long toxic algal bloom fed by undiluted nutrients from upstream farms.
The impacts of the Millennium Drought were so severe that the Australian government created an agency to balance the competing water needs—agricultural, industrial, municipal, and environmental—within the Murray-Darling Basin. With so many demands for water, managers needed to understand the basin’s historical behavior in order to make the right water allocation decisions.
A team of researchers at the Geospatial Analysis for Environmental Change Lab, headed by Mirela Tulbure of the University of New South Wales, used more than a quarter-century of Landsat data to map the basin’s dramatically changing surface water. Tulbure and colleagues processed more than 25,000 Landsat images to create their Surface Water Dynamic (SWD) data set, a comprehensive historical record of the basin’s surface water between 1986 and 2011. The results were recently published in Remote Sensing of Environment.
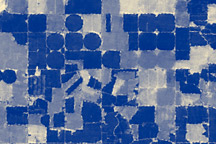
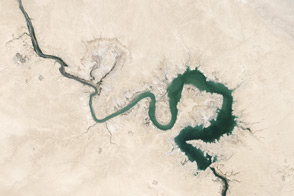
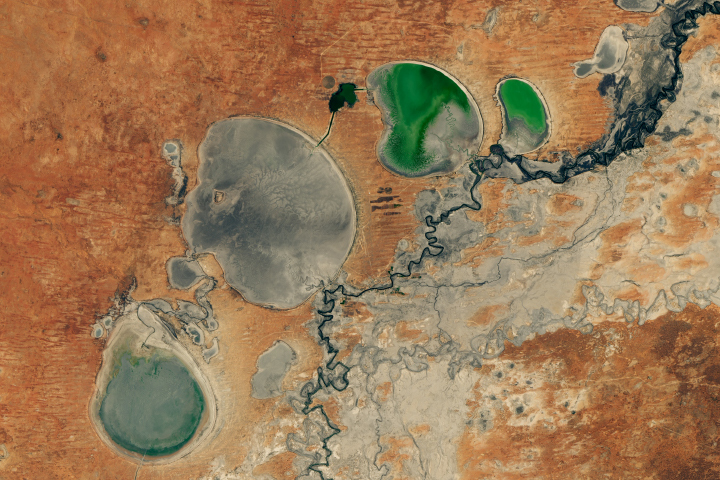
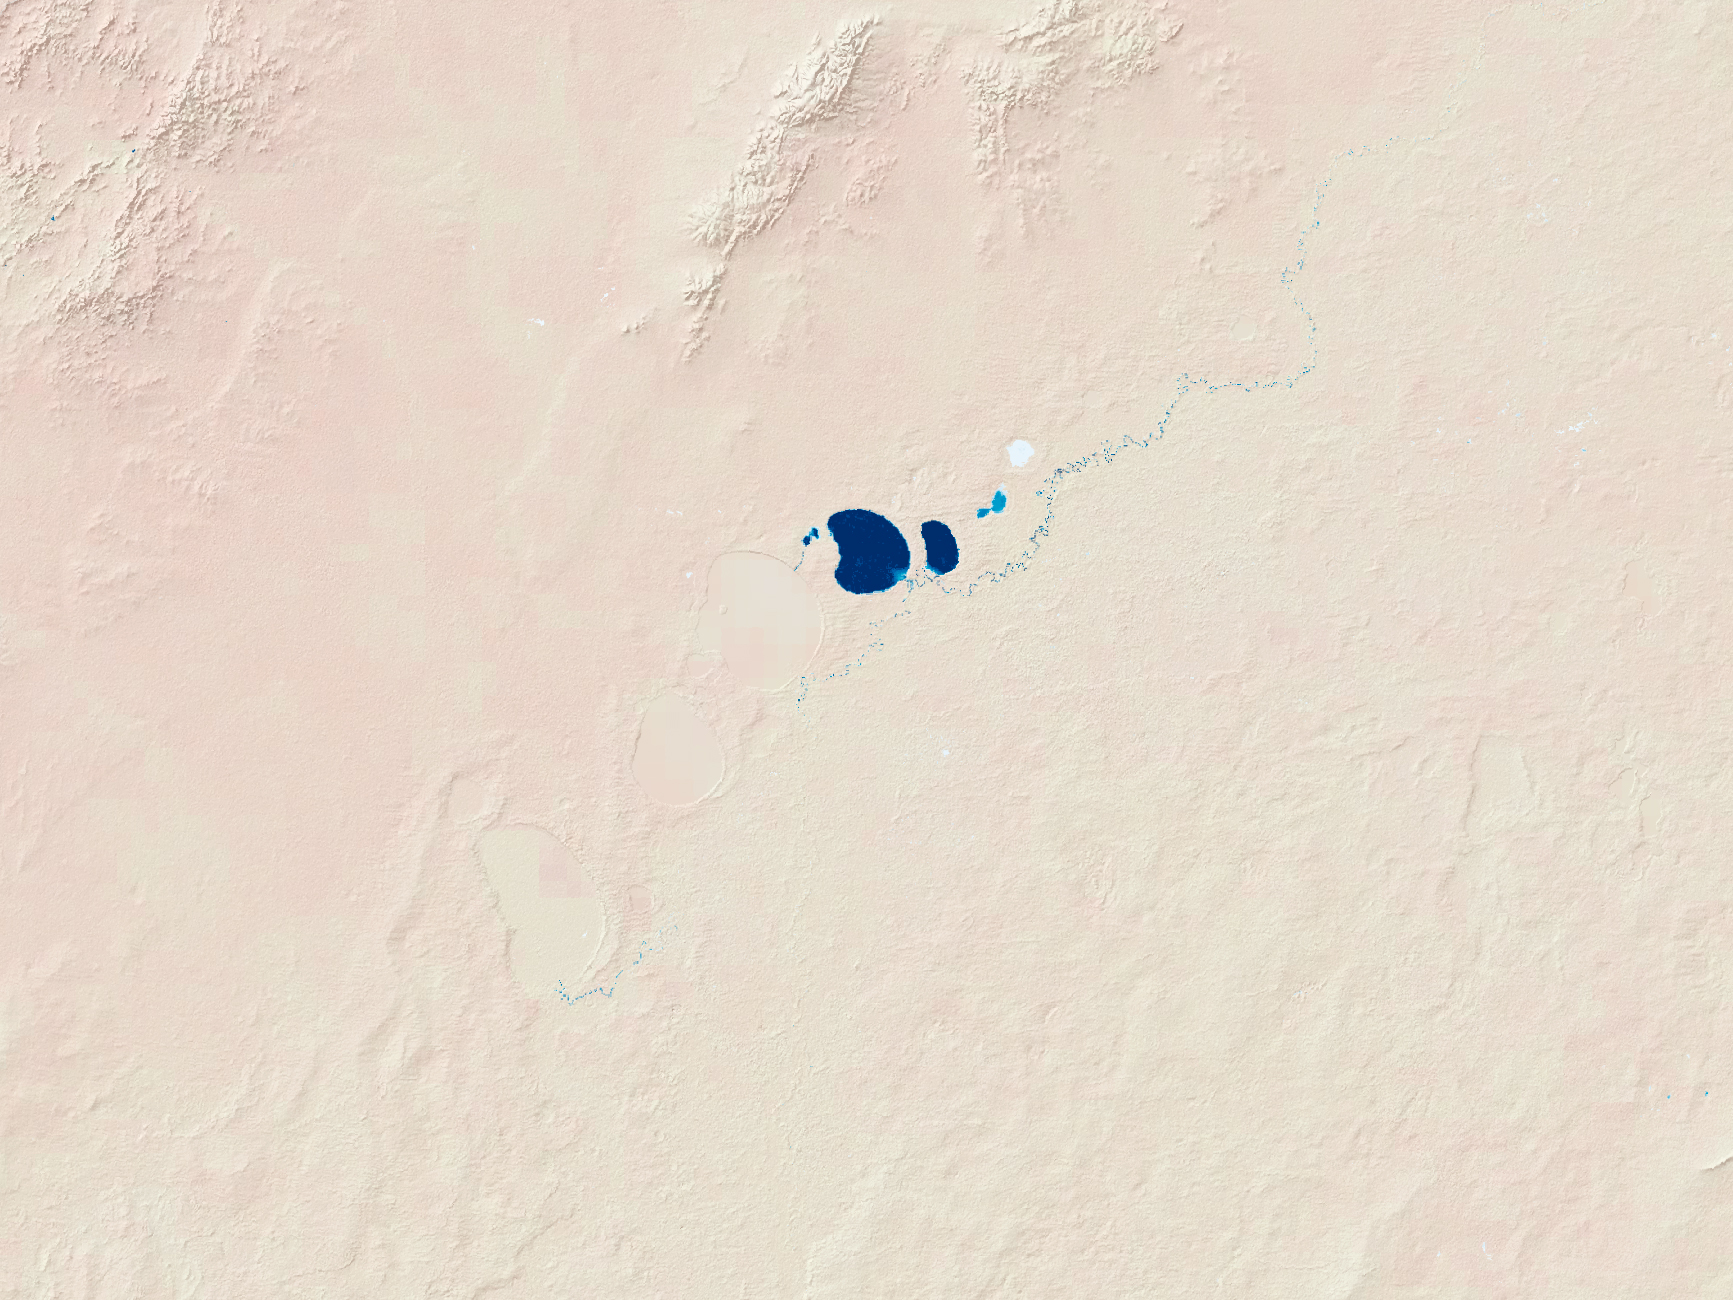
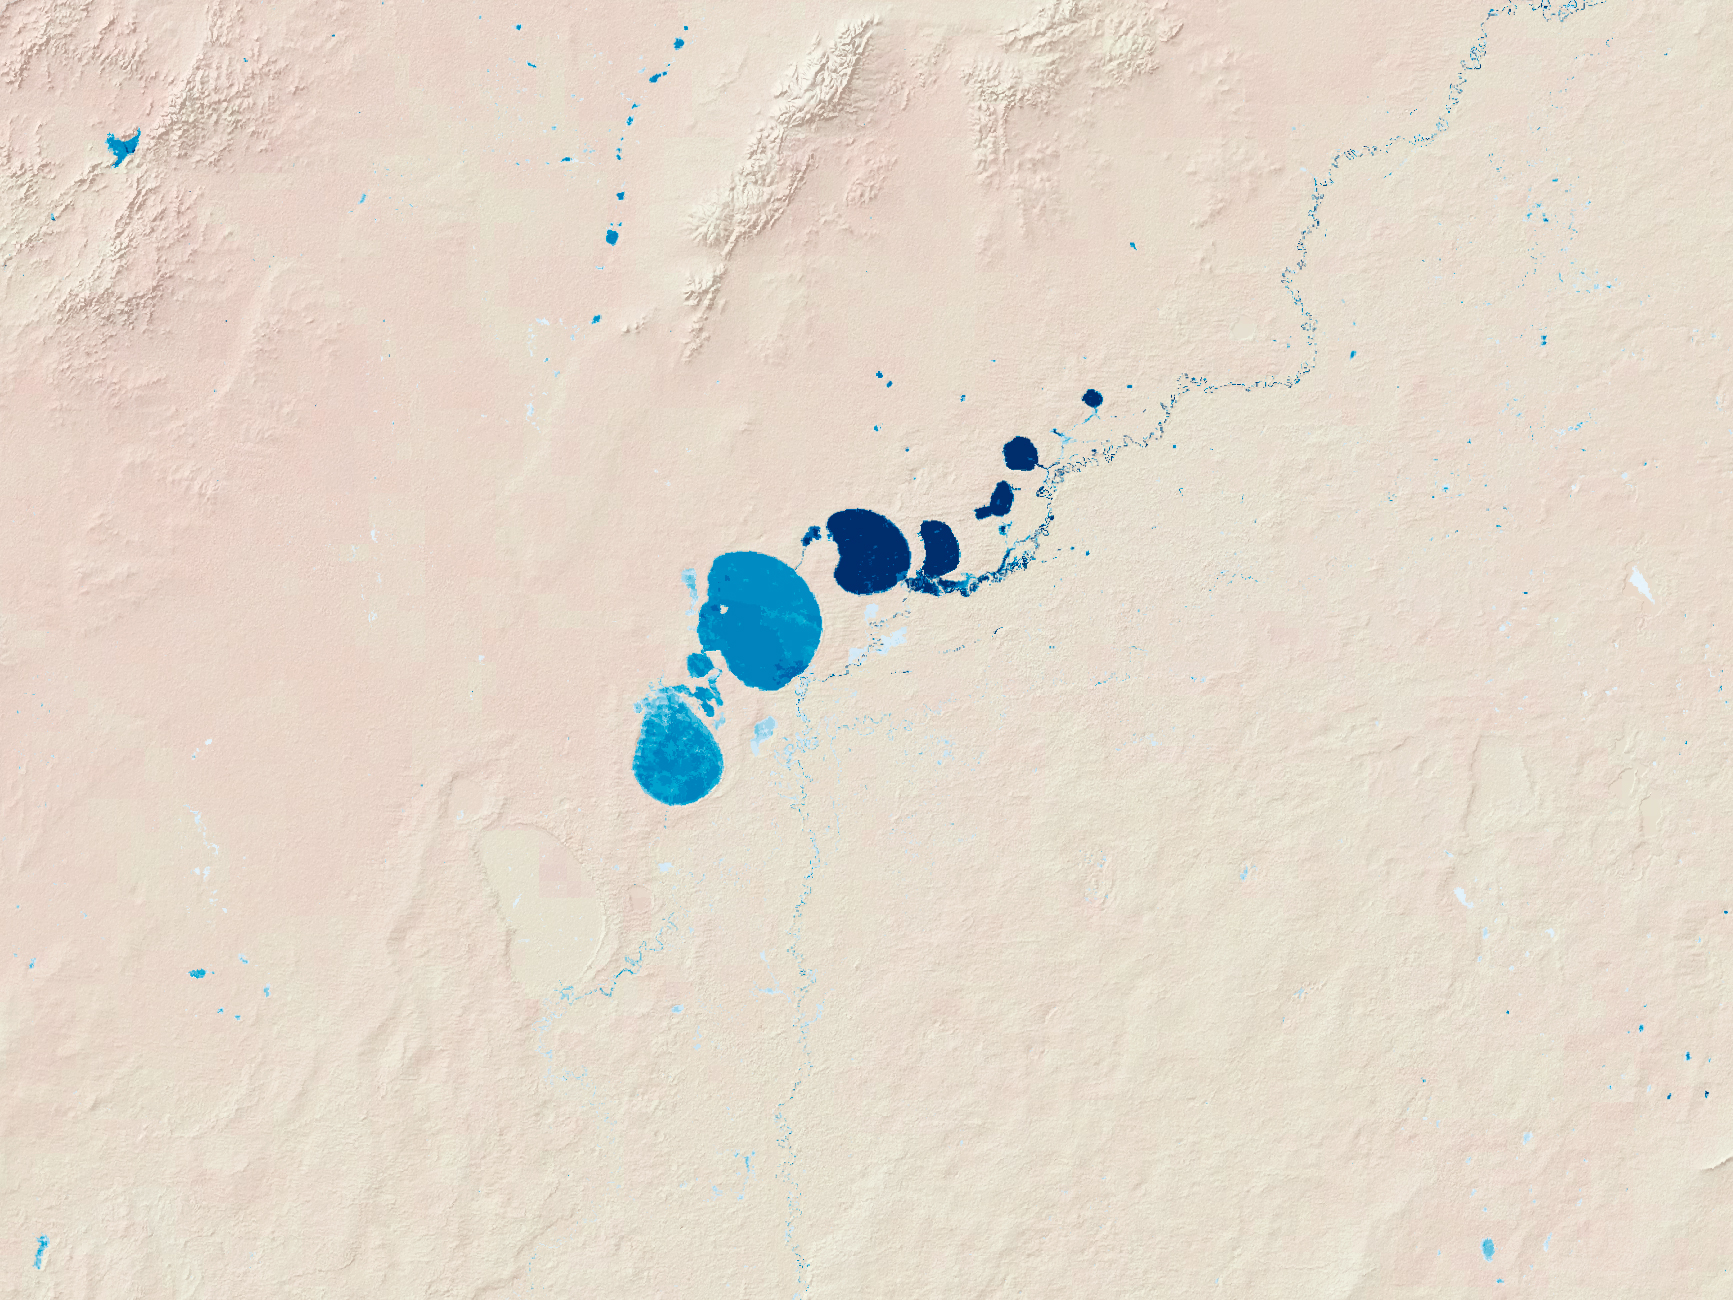
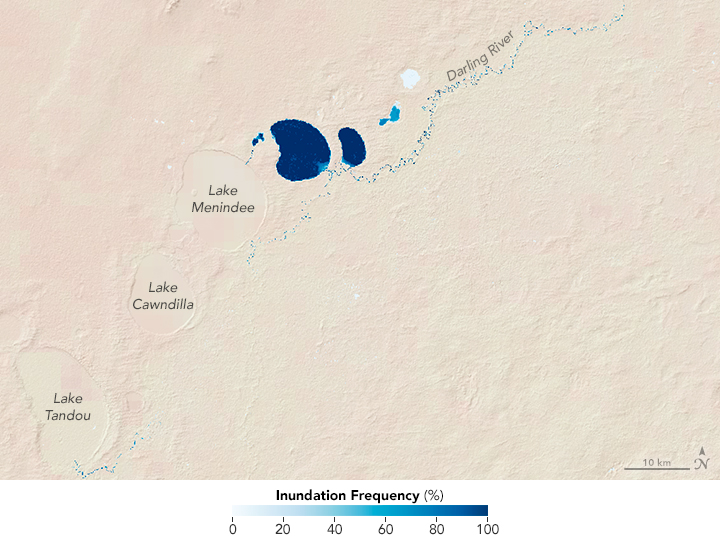
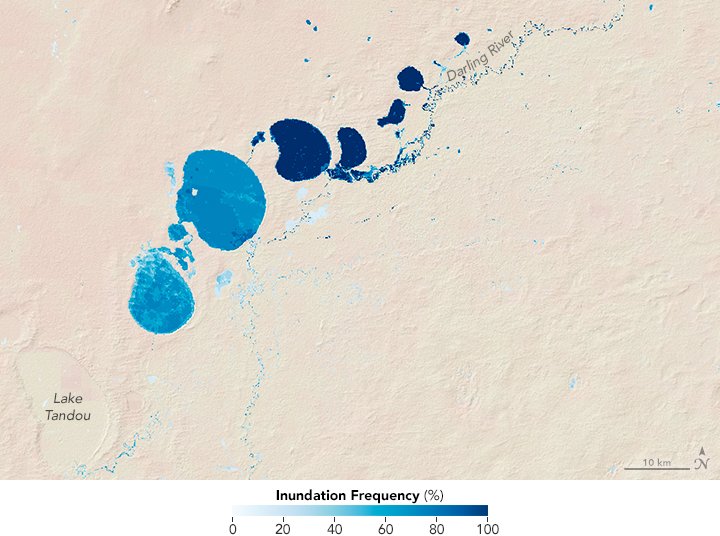
Thanks to Tulbure’s team, water managers now have a series of maps that show how the Millennium Drought and subsequent La Niña deluges affected surface water throughout the Murray-Darling Basin. At the top of this page you can see two inundation frequency maps for the Menindee Lakes along the Darling River in New South Wales.
The top image shows 2006, a very dry year during the Millennium Drought; the bottom one shows 2010, a wet La Niña year. The shades of blue indicate how often a Landsat pixel (and corresponding parcel of land) was filled with water. The number of times a pixel showed water was divided by the total number of cloud-free satellite observations for that year; this is the inundation frequency percentage. In arid regions like this, seasonally inundated land can affect water availability, so knowing the inundation frequency can help managers predict flooding, drought, and water shortages.
“To be able to quantify where the water is, there needs to be a systematic quantification of surface water dynamics, which is only possible from satellite data in an automated manner,” explained Mark Broich, a co-author of the study and researcher at the University of New South Wales. “This is why our product is important to water and land managers.”
NASA Earth Observatory images by Joshua Stevens, using data courtesy of Mirela Tulbure, UNSW Australia and the Geospatial Analysis for Environmental Change Lab. Caption by Laura Rocchio with Mike Carlowicz.