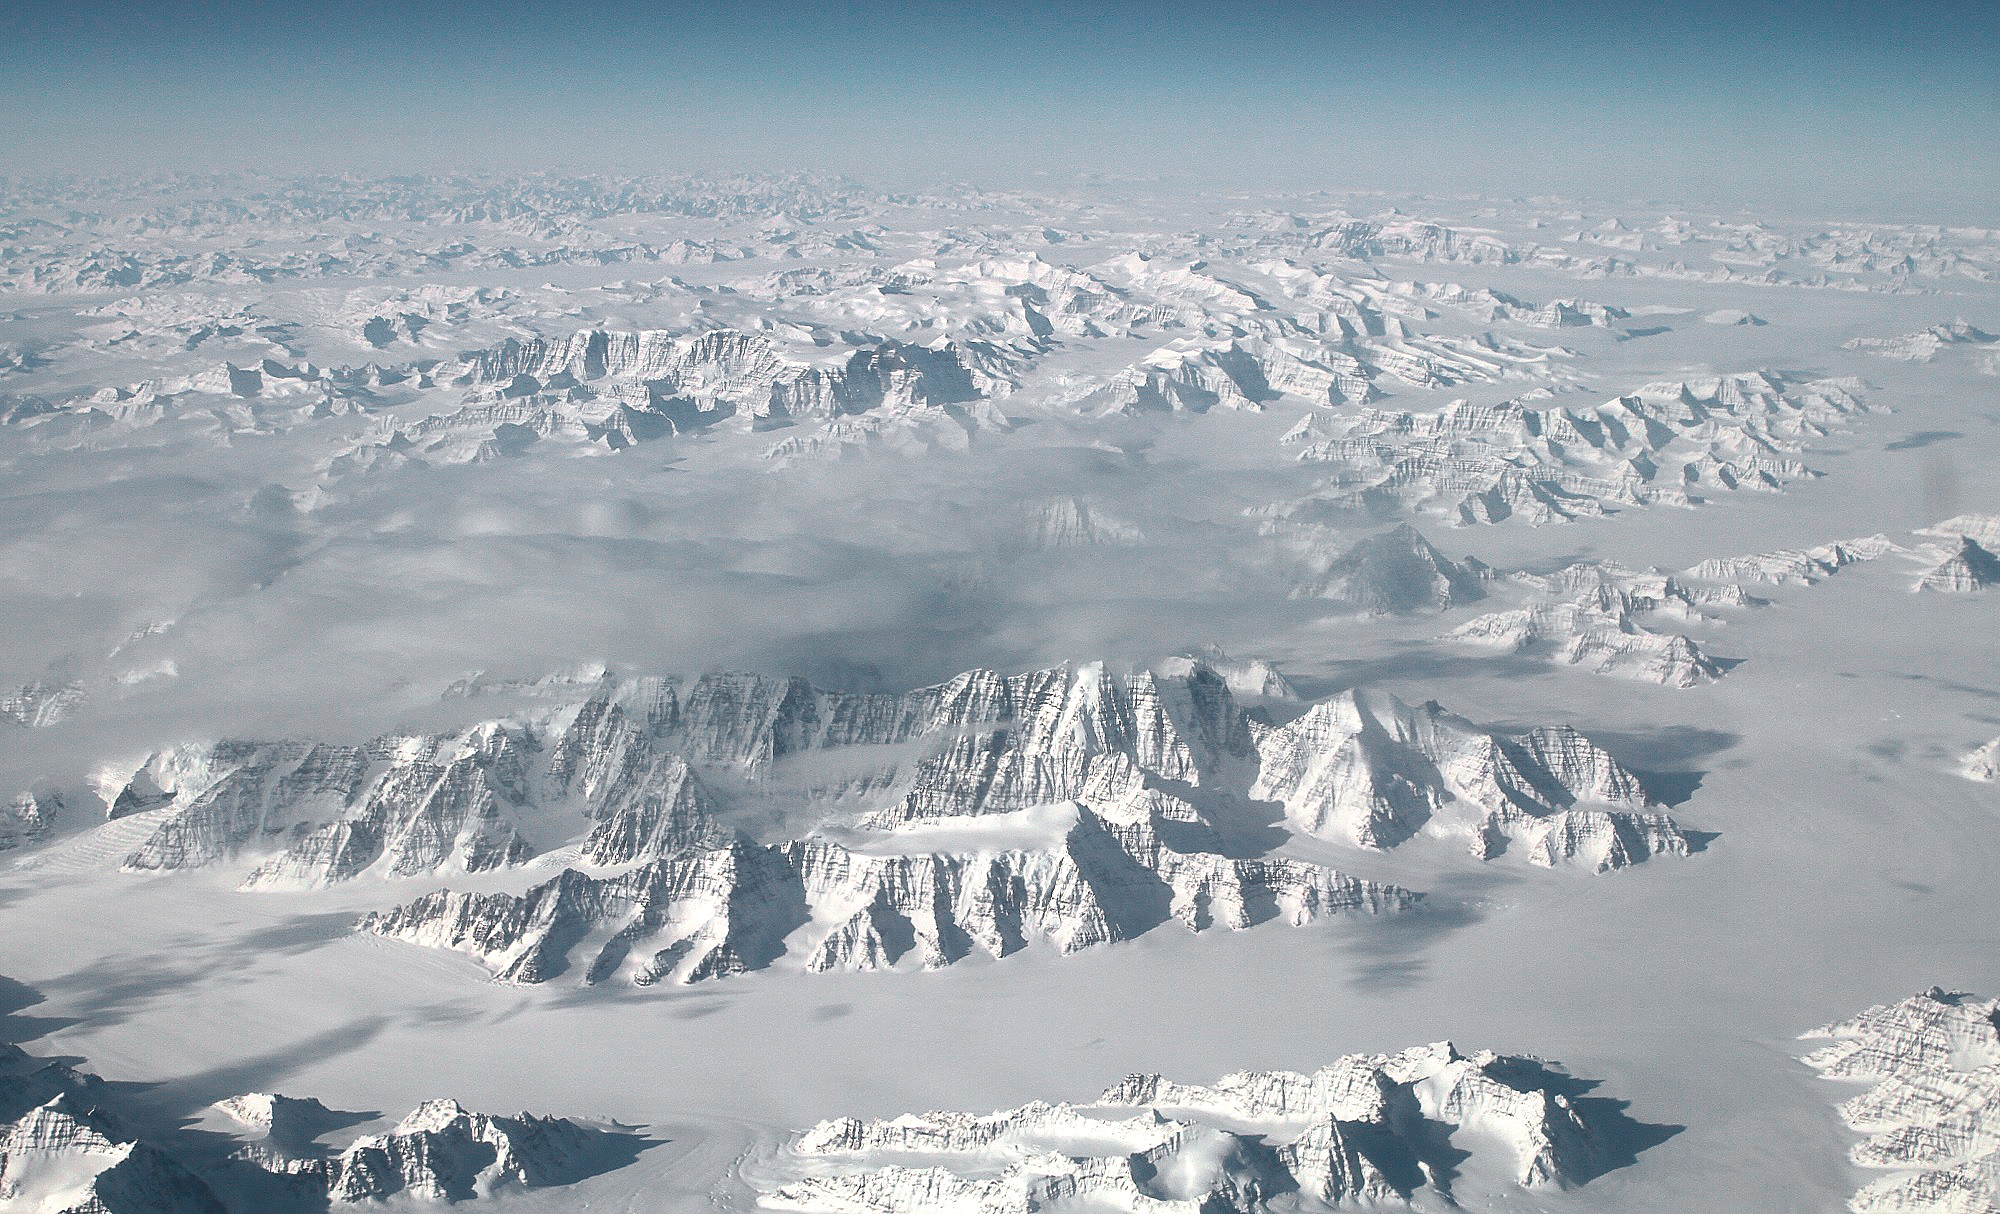
At 1.7 million square kilometers (660,000 square miles), the Greenland ice sheet is three times the size of Texas. On average, the ice is about 1.6 kilometers (1 mile) deep and contains enough water to raise global sea levels about 6 meters (20 feet) if it were all to melt.
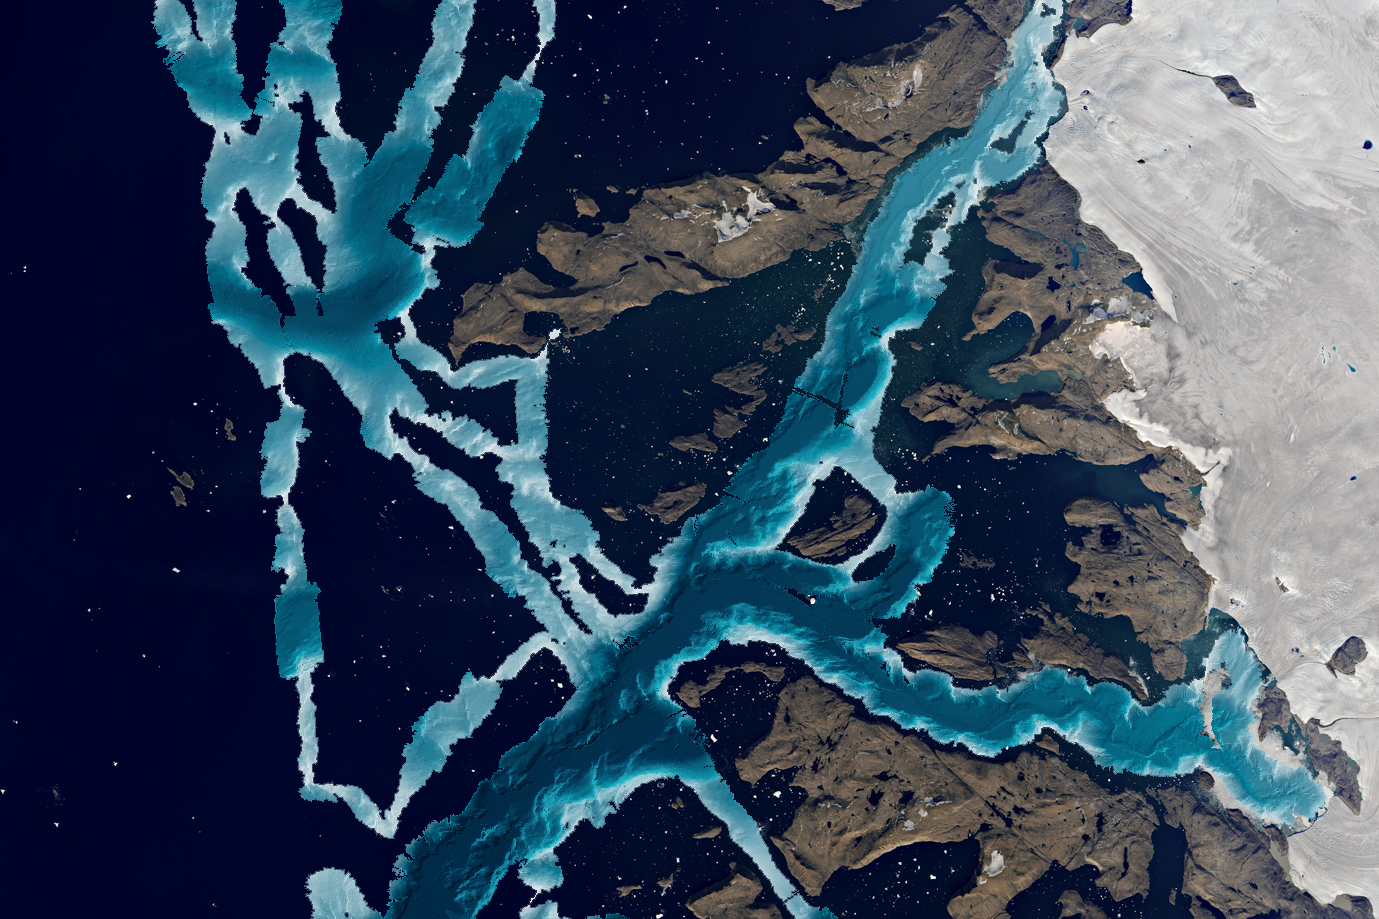
Global sea level rise is one of the major environmental challenges of the 21st Century, and Greenland is central to the problem. That massive ice sheet touches the sea along more than 44,000 kilometers (27,000 miles) of jagged coastline. Hundreds of fjords, inlets, and bays bring ocean water right to the edge of the ice and, in some places, under it. This means the ice sheet is not just melting from warm air temperatures above; it is also likely being melted from water below.
For this reason, a team of scientists led by the Jet Propulsion Laboratory’s Josh Willis have launched the Oceans Melting Greenland, or OMG, field campaign. Started in the summer of 2015, OMG is a five-year airborne and ship-based mission to study the role of the oceans in melting Greenland’s ice. Researchers will examine the temperatures and other properties of North Atlantic waters along the coast, while also making measurements of the glaciers that reach the ocean. The OMG team is also building a profile of the seafloor around the island in order to better model how warm, deep ocean water might flow into those fjords and reach the glacier edges.
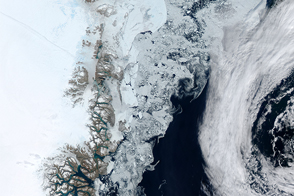
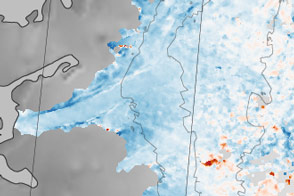
The map above shows some early results from OMG. In the late summer of 2015, the OMG team outfitted a fishing boat with sonar equipment to map the shape of the seafloor (the bathymetry) along the west coast of Greenland. The depth of the water is shown in shades of blue, with the deepest shades representing the deepest parts. Note the deep trench offshore from the Cornell and Ussing Braeer glaciers. Many of these canyons were cut into the seafloor during the advance and retreat of ice during the last Ice Age.
In this part of the North Atlantic, the warmest water is actually in the deepest parts of the sea, below waters that are cooled by cold Arctic air temperatures and winds. The OMG mapping effort will help the team figure out where deep Atlantic warm water might be able to reach the ice through the complicated currents and circulation around these canyons.
In March and April 2016, the OMG team began another phase of the campaign. Flying out of Iceland and Greenland, the team has been using a NASA G-III aircraft to survey coastal glaciers. The plane is equipped with the Glacier and Ice Surface Topography Interferometer (GLISTIN-A), a type of radar that can generate high-resolution, high-precision measurements of the height of coastal glaciers. The team will make such survey flights each spring through 2020 to track changes in glacier extent as evidence of growth or thinning in each melt season.
In the summer or fall of 2016, the third part of the research campaign will begin. The team will fly along both coasts and release 250 expendable sensors that can measure the temperature and salinity of coastal waters from the surface to 1000 meters (about 3,000 feet) in depth. The measurements of temperature properties will help complete the puzzle of how the ocean and ice are interacting, leading researchers to build better models of ice sheet changes and sea level rise.
NASA Earth Observatory map by Joshua Stevens, using Oceans Melting Greenland (OMG) data courtesy of Josh Willis/JPL. Photograph by Josh Willis. Caption compiled by Mike Carlowicz from reporting by Patrick Lynch and Carol Rasmussen, NASA Earth Science Communications.
alert message