

Starting in early October, farmers in southern Africa typically plant maize (corn)—an important food staple—across millions of hectares of land. But the first half of the 2015-2016 growing season was far from typical. Hot and dry conditions associated with a strong El Niño left experts wondering if a record agricultural drought was in the works.
Whether the season breaks a record won’t be known until the growing season concludes in April 2016. But early in the season, when crops are normally planted, many areas faced inadequate growing conditions. According to Curt Reynolds of the USDA Foreign Agricultural Service, rainfall in South Africa’s croplands from October through December 2015 was the lowest measured since at least 1981. With so little rainfall, sowing was delayed and plants could not emerge.
Reynolds and other agricultural researchers track growing conditions around the world by analyzing the Normalized Difference Vegetation Index (NDVI), a measure of how plants absorb visible light and reflect infrared light. Drought-stressed vegetation reflects more visible light and less infrared than healthy vegetation.
This NDVI anomaly map above is based on data from the Moderate Resolution Imaging Spectroradiometer (MODIS) on NASA’s Terra satellite. The map contrasts vegetation health in December 2015 against the long-term average for that month from 2000–2015. Brown areas show where plant growth, or “greenness,” was below normal. Greens indicate vegetation that is more widespread or abundant than normal for the time of year. Grays depict areas where data were not available, usually due to cloud cover.
Three South African provinces—Free State, North West, and Mpumalanga—normally account for more than 80 percent of the country’s maize/corn production. By January 24, 2016, Free State and North West still lacked green vegetation. Some greenery was visible in Mpumalanga, but the below-average levels hinted that crop yields would likely be low.
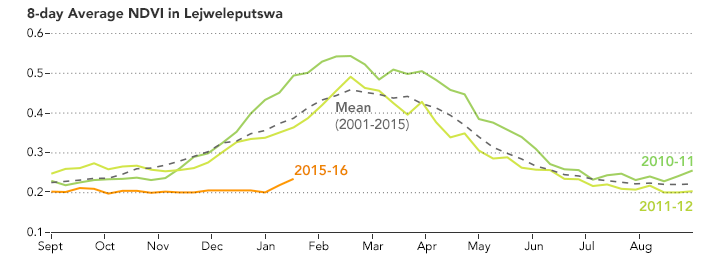
Assaf Anyamba, a remote sensing scientist with the NASA Goddard Earth Sciences Technology Center, noted that some areas were hit particularly hard by the drought. Among them was Lejweleputswa, a district in northwest Free State. The graph above shows how the NDVI for Lejweleputswa this season compares to previous seasons and to the mean from 2001–2015 (dashed gray line).
Farmlands and other vegetation also contended with unusually warm land surface temperatures in the first half of the growing season. This temperature anomaly map is based on data from the Moderate Resolution Imaging Spectroradiometer (MODIS) on NASA’s Terra satellite. It shows land surface temperatures (LSTs) in December 2015, compared to the long-term average conditions for that month from 2000–2015. Red colors depict areas that were hotter than the average; blue colors were colder than average. White pixels were normal, and gray pixels depict areas where data are missing due to cloud cover.
NASA Earth Observatory images by Jesse Allen and Joshua Stevens, using vegetation anomaly and land surface temperature data provided by Jennifer Small, Ed Pak, and Assaf Anyamba, NASA GIMMS Group at Goddard Space Flight Center and the USDA Foreign Agriculture Service (FAS) Global Agricultural Monitoring Project (GLAM) Project. Caption by Kathryn Hansen.