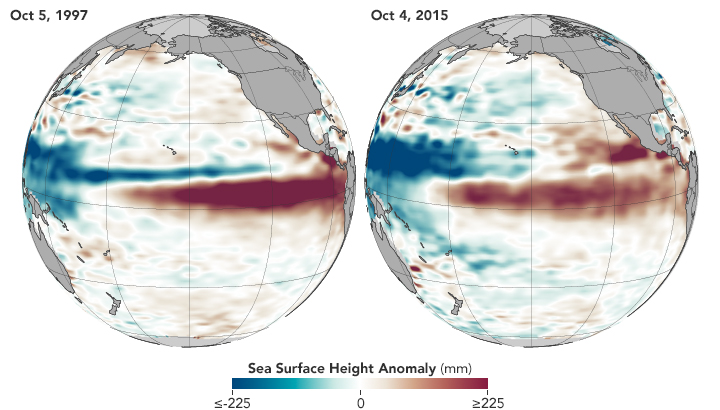
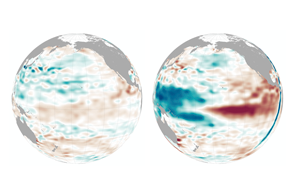
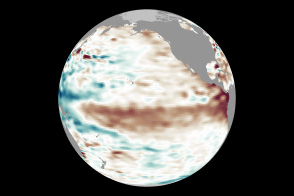
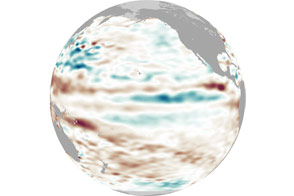
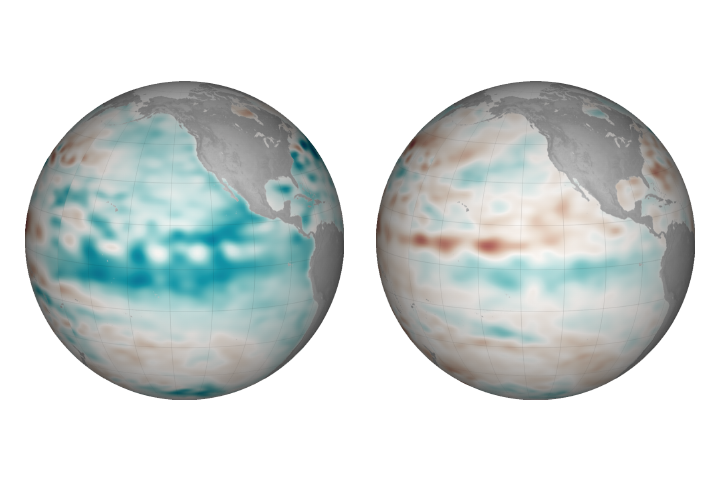
The latest analyses from the National Oceanic and Atmospheric Administration and from NASA confirm that El Niño is strengthening and it looks a lot like the strong event that occurred in 1997–98. Observations of sea surface heights and temperatures, as well as wind patterns, show surface waters cooling off in the Western Pacific and warming significantly in the tropical Eastern Pacific.
“Whether El Niño gets slightly stronger or a little weaker is not statistically significant now. This baby is too big to fail,” said Bill Patzert, a climatologist at NASA’s Jet Propulsion Laboratory. October sea level height anomalies show that 2015 is as big or bigger in heat content than 1997. “Over North America, this winter will definitely not be normal. However, the climatic events of the past decade make ‘normal’ difficult to define.”
The maps above show a comparison of sea surface heights in the Pacific Ocean as observed at the beginning of October in 1997 and 2015. The measurements come from altimeters on the TOPEX/Poseidon mission (left) and Jason-2 (right); both show averaged sea surface height anomalies. Shades of red indicate where the ocean stood higher (in tens of millimeters) than the normal sea level because warmer water expands to fill more volume. Shades of blue show where sea level and temperatures were lower than average (contraction). Normal sea-level conditions appear in white.
“The trade winds have been weakening again,” Patzert said. “This should strengthen this El Niño.” Weaker trade winds out of the eastern Pacific allow west wind bursts to push warm surface waters from the central and western Pacific toward the Americas. Click here to watch a video of Kelvin waves propagating across the ocean in the first seven months of 2015.
In its October monthly update, scientists at NOAA’s Climate Prediction Center stated: “All multi-model averages predict a peak in late fall/early winter. The forecaster consensus unanimously favors a strong El Niño...Overall, there is an approximately 95 percent chance that El Niño will continue through Northern Hemisphere winter 2015–16.”
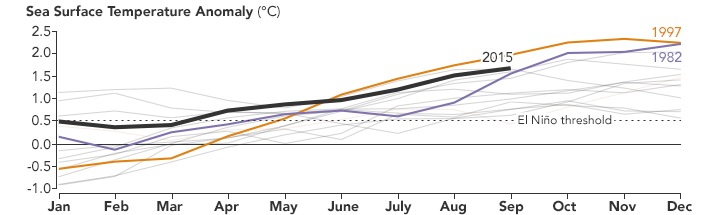
The July–September average of sea surface temperatures was 1.5°C above normal, NOAA reported, ranking third behind 1982 (1.6°C) and 1997 (1.7°C). The plot above shows sea surface temperatures in the tropical Pacific for all moderate to strong El Niño years since 1950.
Both Patzert and NOAA forecasters believe the southern tier of North America, particularly southern California, is likely to see a cooler and wetter than normal winter, while the northern tier could be warmer and drier. But the sample of El Niños in the meteorological record are still too few and other elements of our changing climate are too new to say with certainty what the winter will bring.
NASA Earth Observatory map by Jesse Allen, using Jason-2 and TOPEX/Posideon data provided by Akiko Kayashi and Bill Patzert, NASA/JPL Ocean Surface Topography Team. NASA Earth Observatory chart by Joshua Stevens, using data from NOAA. Caption by Mike Carlowicz.


