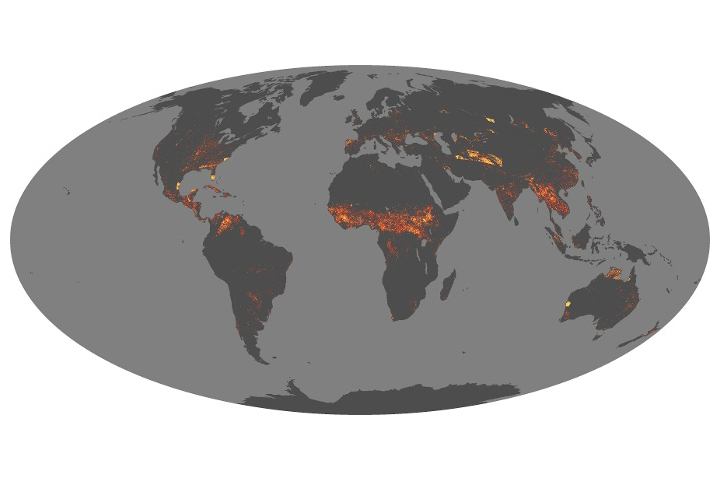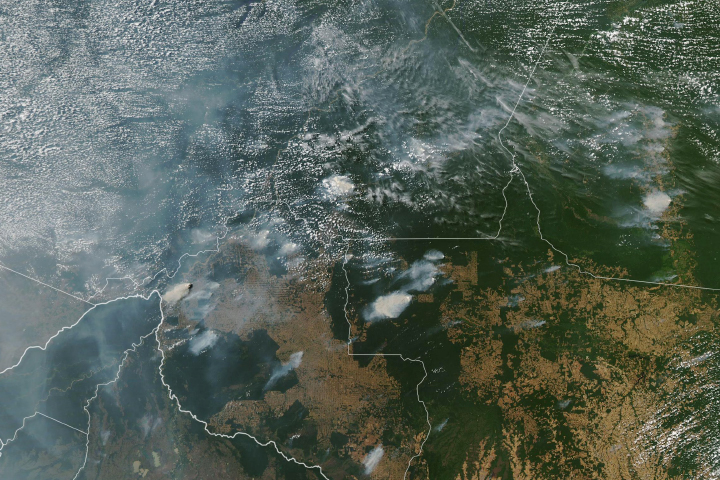
On Earth, there is always something burning. On a typical day in August, the Moderate Resolution Imaging Spectroradiometers (MODIS) on NASA’s Aqua and Terra satellites detect approximately 10,000 active fires, as well as huge swaths of freshly charred land in ecosystems ranging from boreal forests to savanna to tropical forests.
In order to determine how much carbon dioxide and other pollutants all these fires contribute to the atmosphere in a given year, scientists have developed computer models that combine satellite observations of burned area and active fires together with information about vegetation, fuel loads, and other details. Data produced by two computer modeling efforts—the Global Fire Assimilation System (GFAS) and the Global Fire Emissions Database (GFED)—were highlighted in NOAA’s 2014 State of the Climate report, published in the Bulletin of the American Meteorological Society.
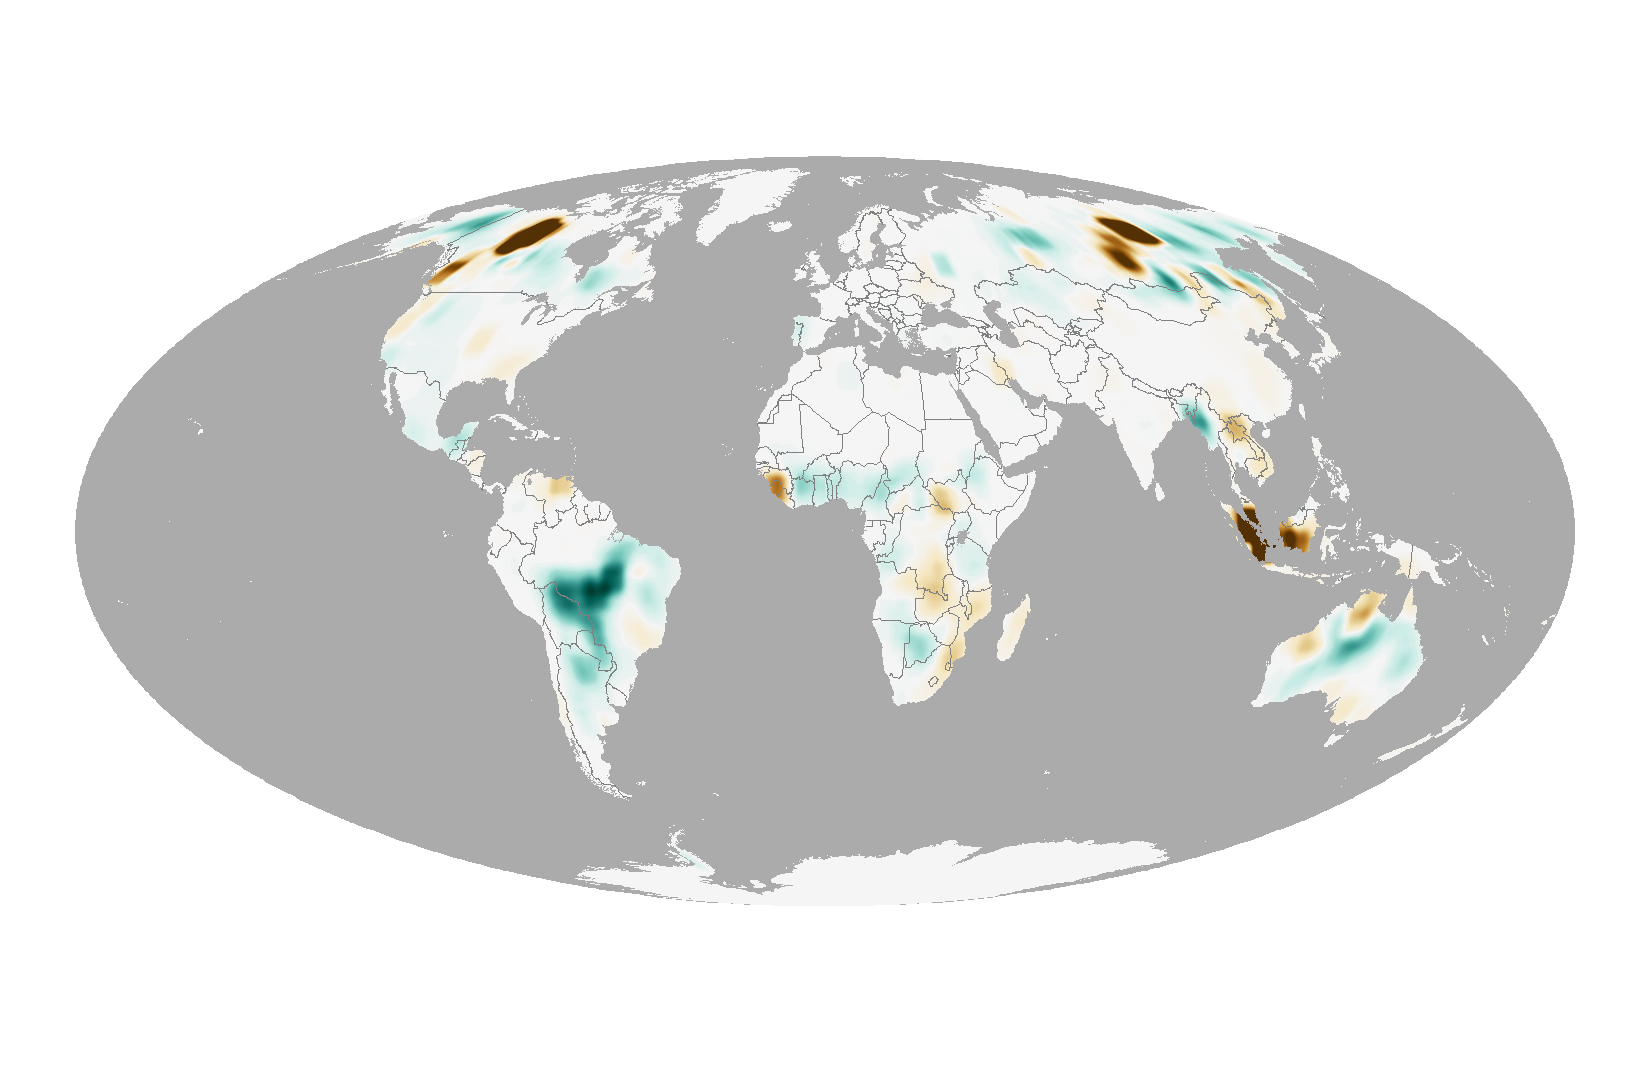
In 2014, fires released about 2,030 teragrams of carbon into the atmosphere, according to the report. That’s just slightly below the 2001–2013 average of 2,034 teragrams per year. While global emissions were average in 2014, North America and the Indonesian archipelago saw a very active fire season. South America and northern Africa had an unusually quiet season. The map above shows the difference from average emissions for 2014 in grams of carbon per square meter per year. Areas that had higher than average emissions are shown in shades of brown. Areas that had lower emissions are shown in blue-green.
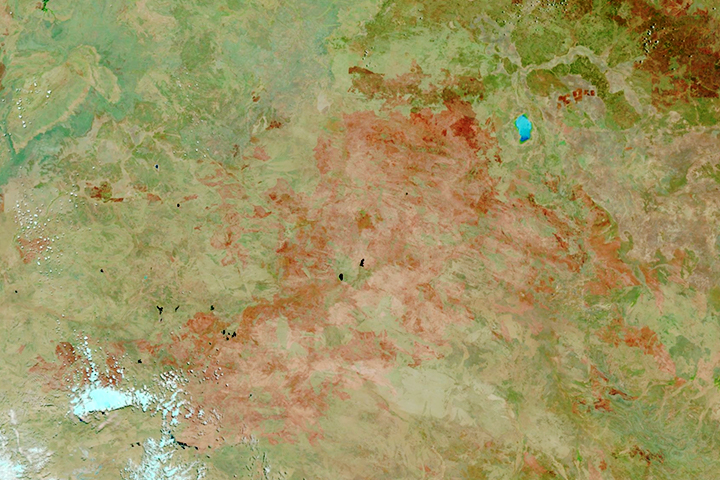
In North America, the burning was centered on Canada’s Northwest Territories, where low winter precipitation, high summer temperatures, and low summer rainfall combined to produce a fierce fire season that charred millions of hectares of forest. See satellite imagery of the 2014 fires in Canada here. In Indonesia, the high emissions can be traced to an intense outbreak of fires that affected northern Sumatra in the spring, as well as a surge of burning in the fall in the southern part of the island.
Meanwhile, fire emissions in South America were 41 percent below the 2000–2013 average. Emissions have been declining since 2005 as deforestation rates in Brazil have declined as well. The decline in emissions from equatorial Africa is part of a downward trend driven by the conversion of savanna to cropland, which reduces the amount of fuel available for fires.
Download the full State of the Climate report here.
Read more State of the Climate coverage from NOAA here.
NASA Earth Observatory map by Joshua Stevens and Jesse Allen, using data from the Global Fire Assimilation System (GFAS) and the State of the Climate in 2014 report. Caption by Adam Voiland.
alert message