Food, fuel, and shelter: vegetation is one of the most important requirements for human populations around the world. Satellites monitor how “green” different parts of the planet are and how that greenness changes over time. These observations can help scientists understand the influence of natural cycles, such as drought and pest outbreaks, on vegetation, as well as human influences, such as land-clearing and global warming.
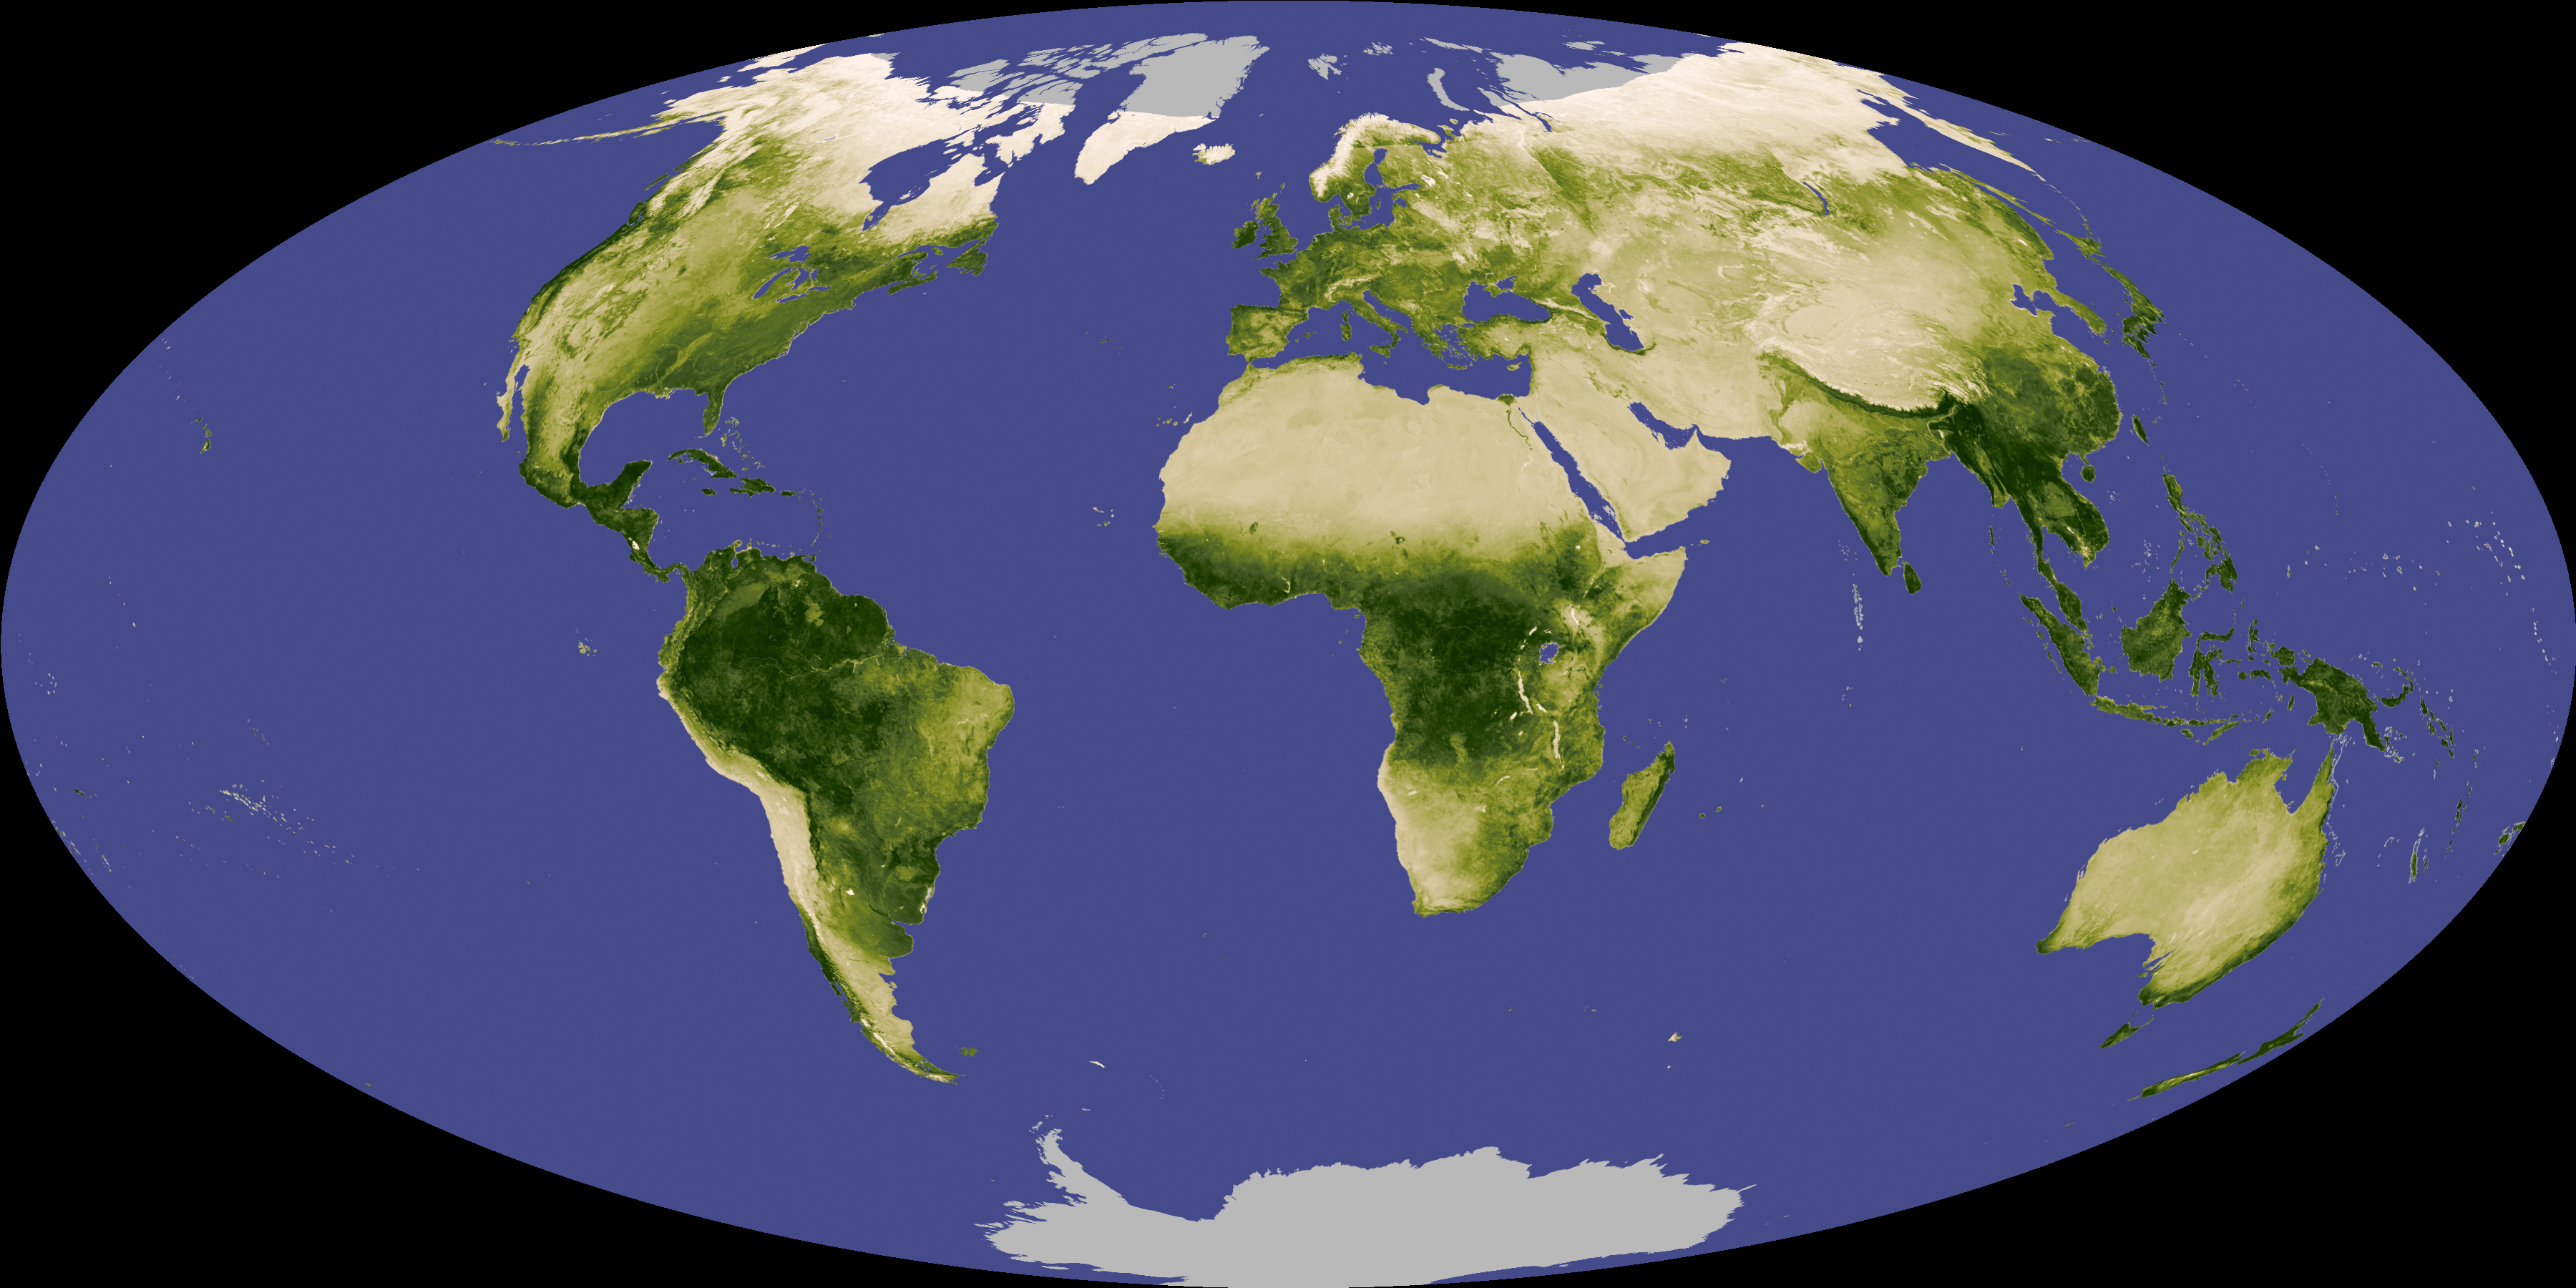
One method of mapping the difference in vegetation amounts around the world is a measurement known as the Normalized Difference Vegetation Index (NDVI). This image shows NDVI from November 1, 2007, to December 1, 2007, during autumn in the Northern Hemisphere. This monthly average is based on observations from the Moderate Resolution Imaging Spectroradiometer (MODIS) on NASA’s Terra satellite.
The greenness values on this global map range from -0.1 to 0.9, but have no actual unit. Instead, higher values (dark greens) show land areas with plenty of leafy green vegetation, such as the Amazon Rainforest. Lower values (beige to white) show areas with little or no vegetation, including sand seas and Arctic areas. Areas with moderate amounts of vegetation are pale green. Land areas with no data appear gray, and water appears blue.
If you direct sunlight through a prism, you can see its varying wavelengths in a spectrum ranging from red (the longest visible wavelengths), through orange, yellow, green, blue, and indigo, and eventually violet (the shortest visible wavelengths). Researchers examine such wavelengths and their interaction with plant life to derive NDVI. Chlorophyll, the pigment that gives plants their greenness, absorbs considerable visible light for use in photosynthesis, but leaves’ cell structure reflects near-infrared light, which are wavelengths slightly longer than the part of the spectrum that human eyes can see. Satellite sensors such as MODIS, however, can detect both visible and near-infrared light. NDVI is calculated by subtracting plants’ reflectance of red light from near-infrared light then dividing that difference by the sum of red and near-infrared light.
NDVI’s utility doesn’t stop at showing which of Earth’s areas are greener than others. NDVI has been used for research purposes as varied as identifying the beginning of the growing season in Africa’s arid Western Sahel, documenting the influence of climate change on Northern Hemisphere vegetation, and estimating the yield of winter wheat production in China’s Shandong Province.
Sixteen-day and monthly NDVI images from MODIS are available from the NASA Earth Observations (NEO) Website.
NASA images produced by Reto Stockli and Jesse Allen, using data provided by the MODIS Land Science Team. Caption by Michon Scott.