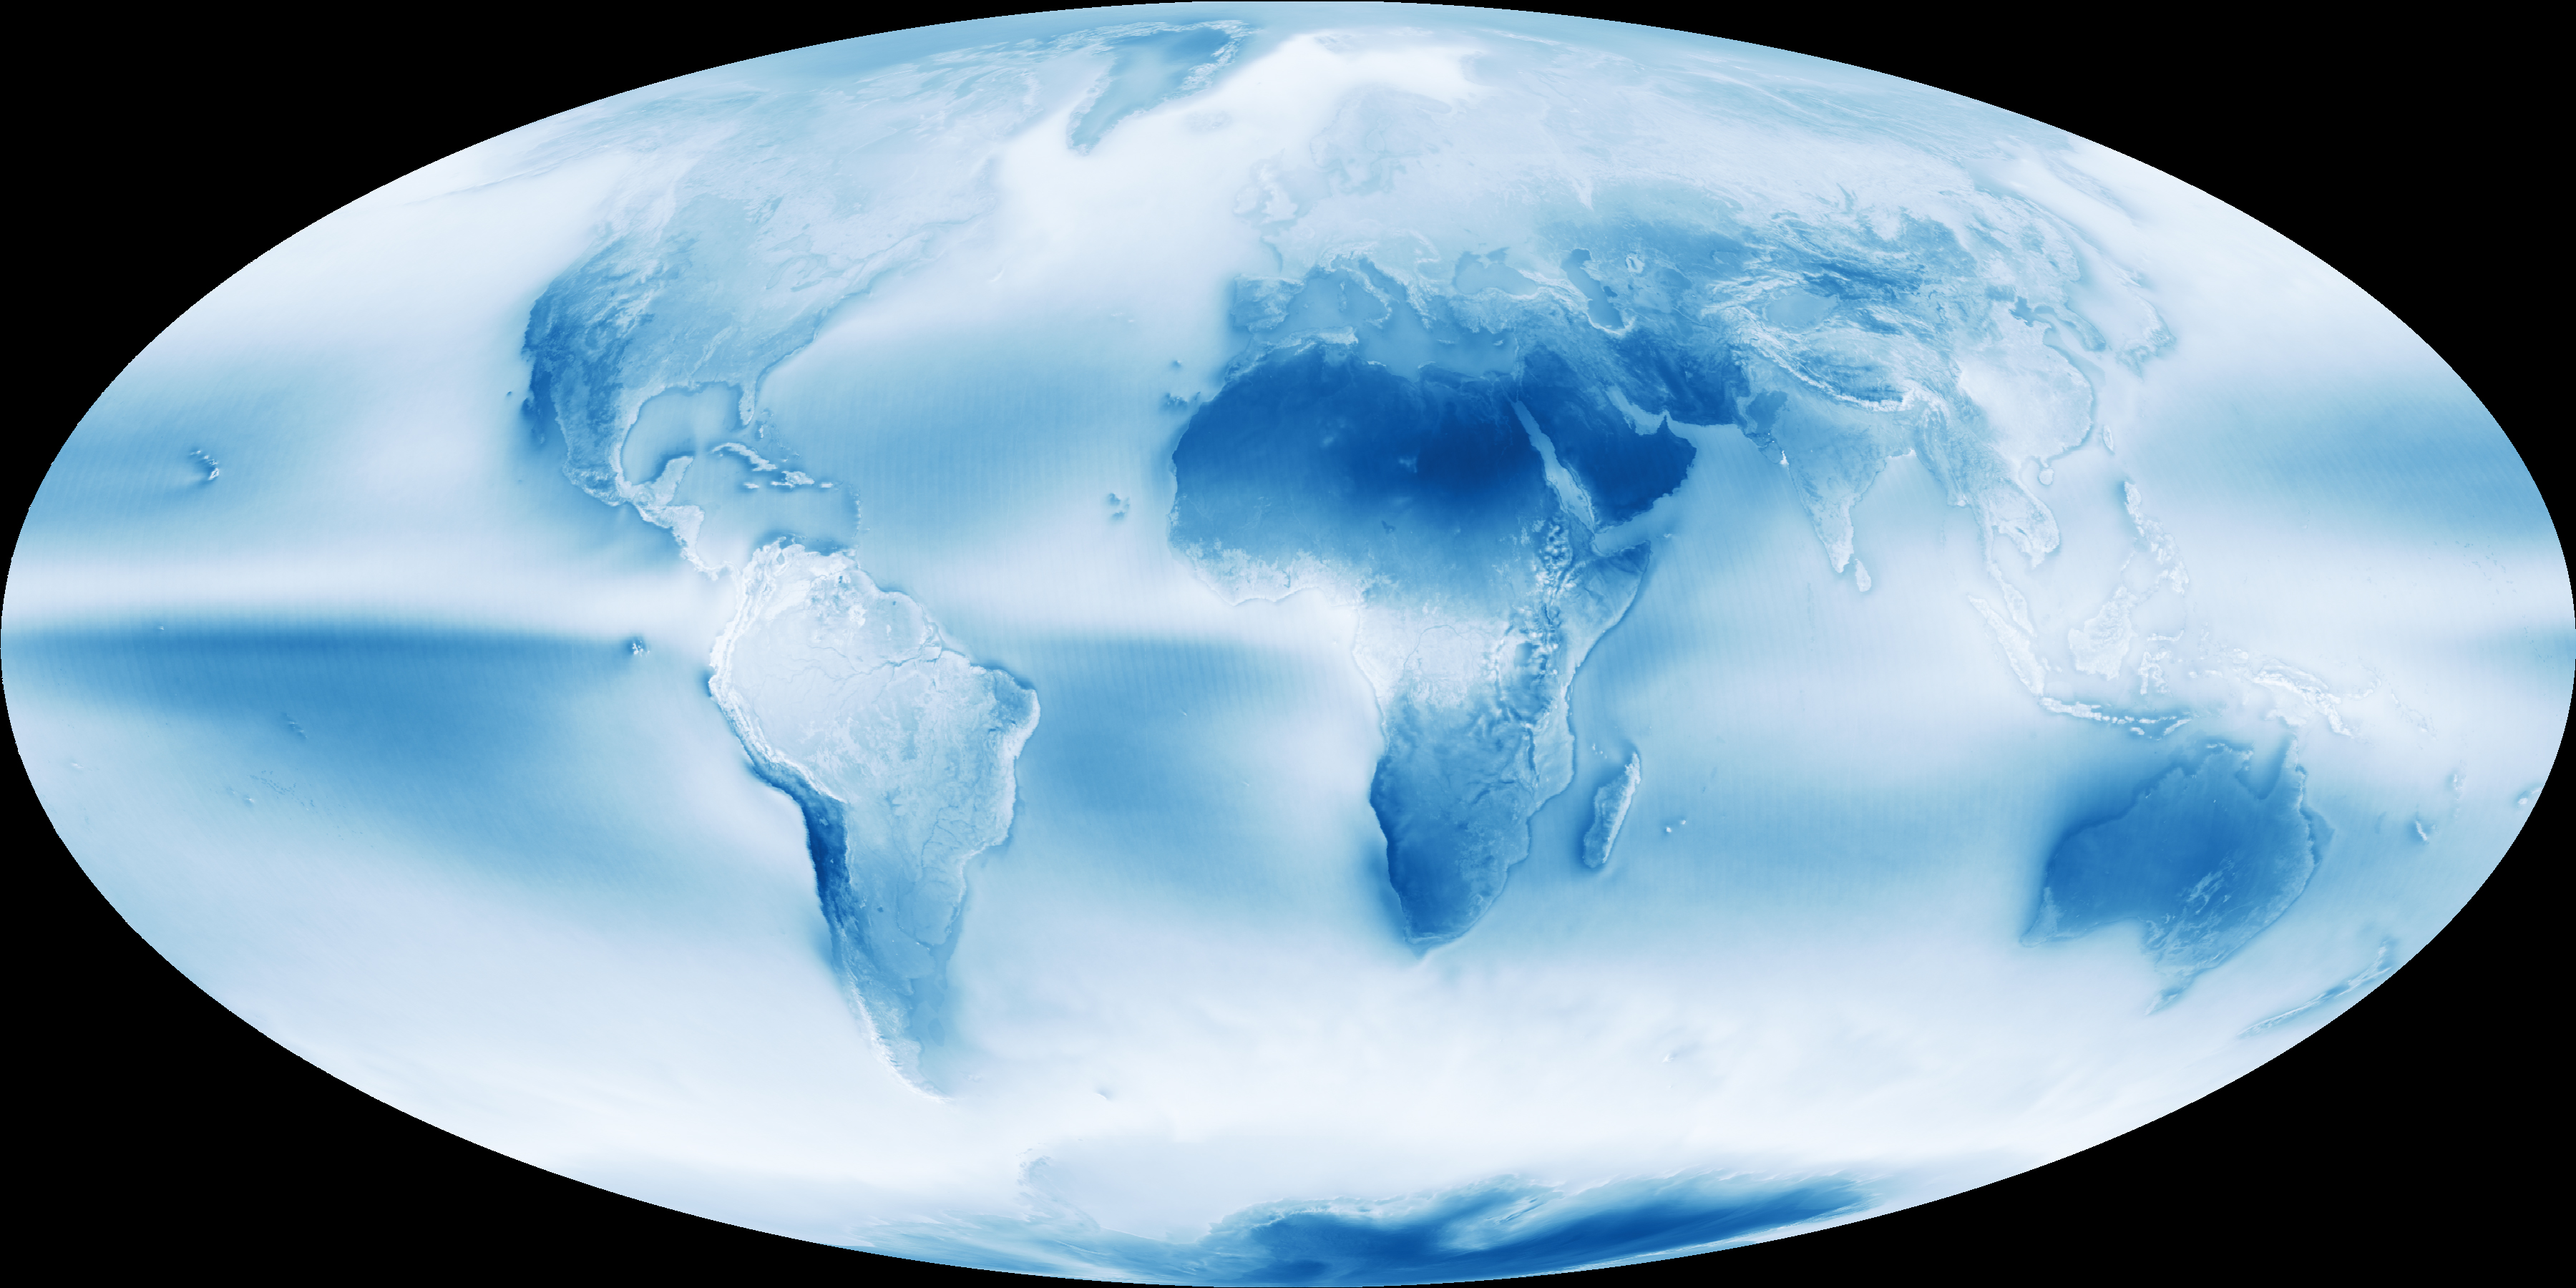

Earth’s cloudy nature is unmistakable in this global cloud fraction map, based on data collected by the Moderate Resolution Imaging Spectroradiometer (MODIS) on the Aqua satellite. While MODIS collects enough data to make a new global map of cloudiness every day, this version of the map shows an average of all of the satellite’s cloud observations between July 2002 and April 2015. Colors range from dark blue (no clouds) to light blue (some clouds) to white (frequent clouds).
There are three broad bands where Earth’s skies are most likely to be cloudy: a narrow strip near the equator and two wider strips in the mid-latitudes. The band near the equator is a function of the large scale circulation patterns—or Hadley cells—present in the tropics. Hadley cells are defined by cool air sinking near the 30 degree latitude line north and south of the equator and warm air rising near the equator where winds from separate Hadley cells converge. (The diagram here illustrates where Hadley cells are located and how they behave.) As warm, moist air converges at lower altitudes near the equator, it rises and cools and therefore can hold less moisture. This causes water vapor to condense into cloud particles and produces a dependable band of thunderstorms in an area known as the Inter Tropical Convergence Zone (ITCZ).
Clouds also tend to form in abundance in the middle latitudes 60 degrees north and south of the equator. This is where the edges of polar and mid-latitude (or Ferrel) circulation cells collide and push air upward, fueling the formation of the large-scale frontal systems that dominate weather patterns in the mid-latitudes. While clouds tend to form where air rises as part of atmospheric circulation patterns, descending air inhibits cloud formation. Since air descends between about 15 and 30 degrees north and south of the equator, clouds are rare and deserts are common at this latitude.
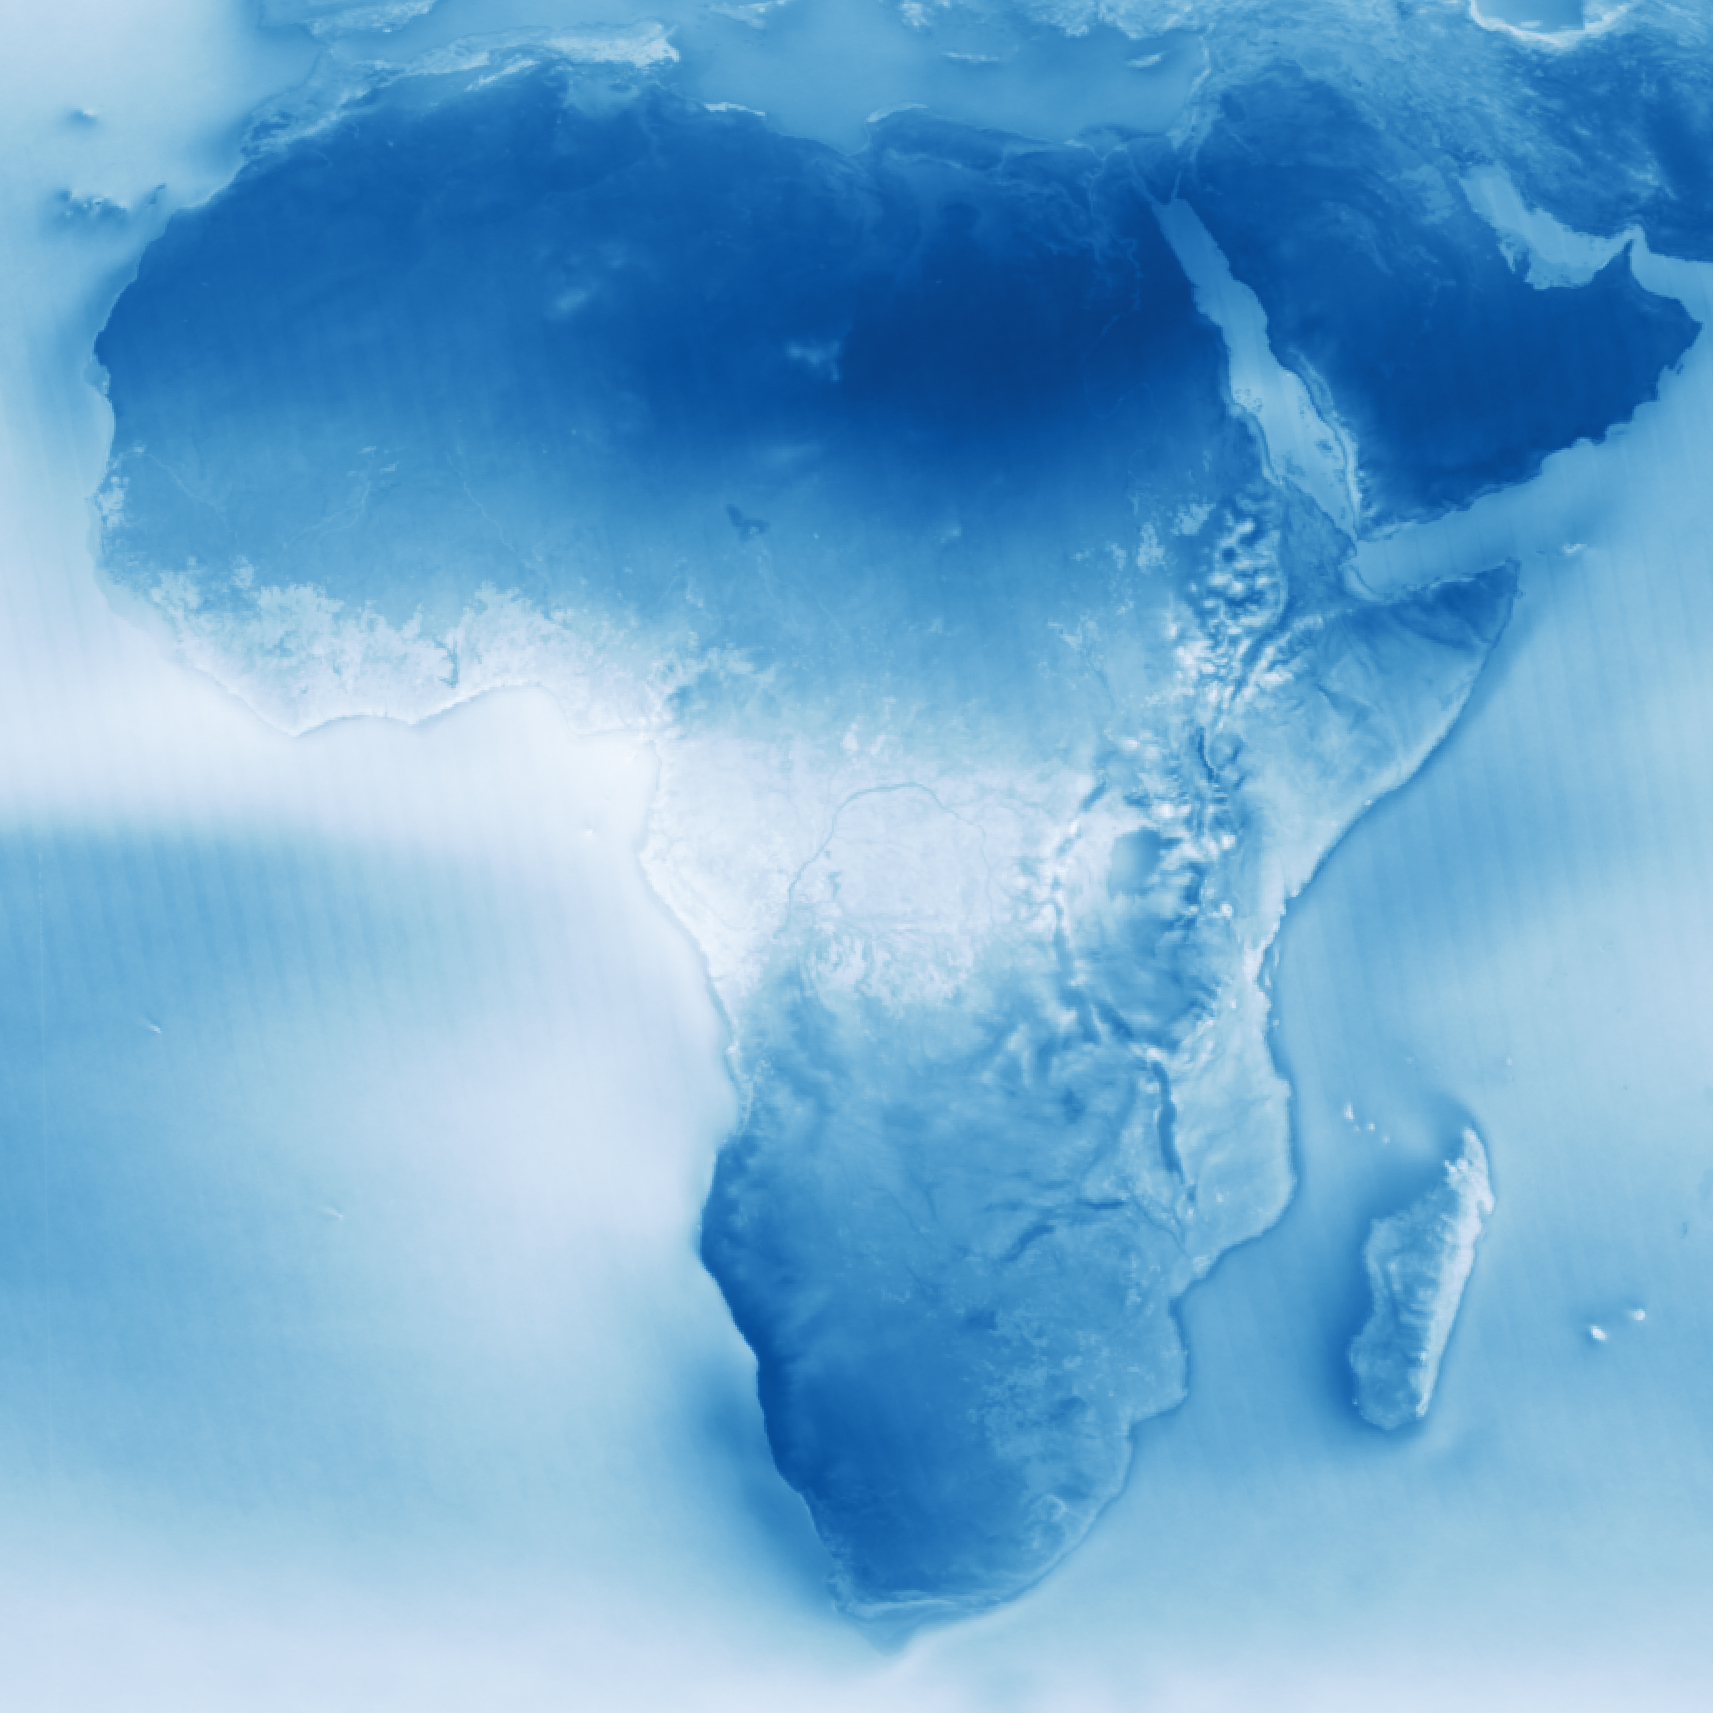
Ocean currents govern the second pattern visible in the cloudiness map: the tendency for clouds to form off the west coasts of continents. This pattern is particularly clear off of South America, Africa, and North America. It occurs because the surface water of oceans gets pushed west away from the western edge of continents because of the direction Earth spins on its axis.
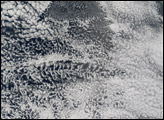
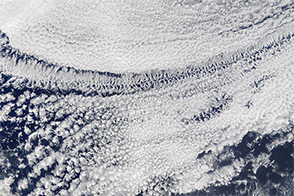
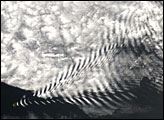
In a process called upwelling, cooler water from deep in the ocean rises to replace the surface water. Upwelling creates a layer of cool water at the surface, which chills the air immediately above the water. As this moist, marine air cools, water vapor condenses into water droplets, and low clouds form. These lumpy, sheet-like clouds are called marine stratocumulus, the most common cloud type in the world by area. Stratocumulus clouds typically cover about one fifth of Earth’s surface.
In some of the less cloudy parts of the world, the influence of other physical processes are visible. For instance, the shape of the landscape can influence where clouds form. Mountain ranges force air currents upward, so rains tend to form on the windward (wind-facing) slopes of the mountain ranges. By the time the air has moved over the top of a range, there is little moisture left. This produces deserts on the lee side of mountains. Examples of deserts caused by rain shadows that are visible in the map above are the Tibetan Plateau (north of the Himalayan Mountains) and Death Valley (east of the Sierra Nevada Range in California). A rain shadow caused by the Andes Mountains contributes to the dryness of the coastal Atacama Desert in South America as well, but several other factors relating to ocean currents and circulation patterns are important.
Note because the map is simply an average of all of the available cloud observations from Aqua, it does not illustrate daily or seasonal variations in the distribution of clouds. Nor does the map offer insight into the altitude of clouds or the presence or absence of multiple layers of clouds (though such datasets are available from MODIS and other NASA sensors). Instead it simply offers a top-down view that shows where MODIS sees clouds versus clear sky.
Since the reflectivity of the underlying surface can affect how sensitive the MODIS is to clouds, slightly different techniques are used to detect clouds over the ocean, coasts, deserts, and vegetated land surfaces. This can affect cloud detection accuracy in different environments. For instance, the MODIS is better at detecting clouds over the dark surfaces of oceans and forests, than the bright surfaces of ice. Likewise thin cirrus clouds are more difficult for the sensor to detect than optically thick cumulus clouds.
NASA Earth Observatory images by Jesse Allen and Kevin Ward, using data provided by the MODIS Atmosphere Science Team, NASA Goddard Space Flight Center. Caption by Adam Voiland, with information from Steve Platnick and Tom Arnold.