
Earth’s atmosphere is many things, but it is certainly not uniform. In many cases, while one part of the world freezes, another broils; while precipitation pummels one region, drought grips another. That's what has been happening to the extreme in the northern hemisphere this week.
One of the underlying features connecting seemingly opposite weather outbreaks are giant meanders in high-altitude winds known as Rossby waves. These planetary-scale waves define the jet stream and do much to determine the type of weather any given area will face over periods of days to weeks. However, the waves are also governed by fundamental laws of fluid dynamics and thermodynamics that ensure the total amount of energy circulating through the global atmosphere doesn’t change, despite the weather extremes in one area or another.
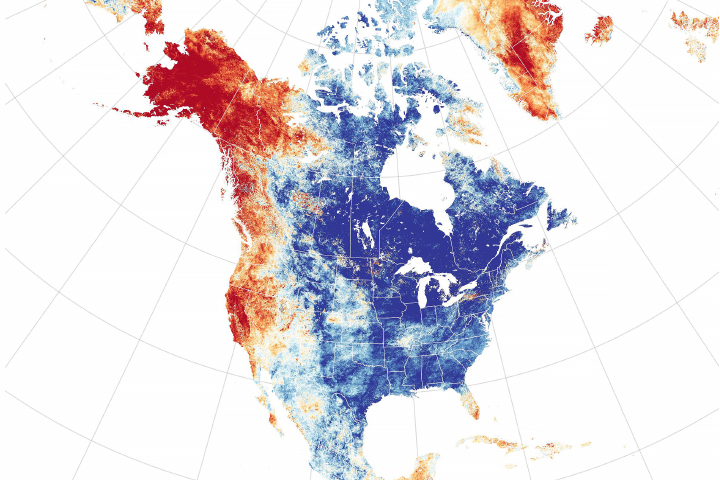
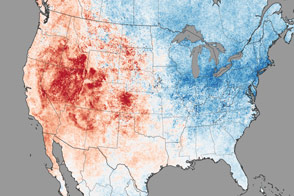
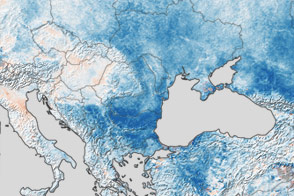
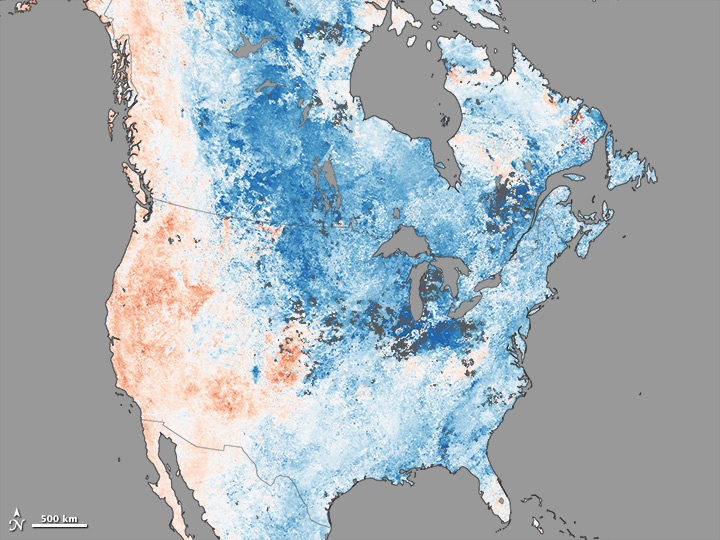
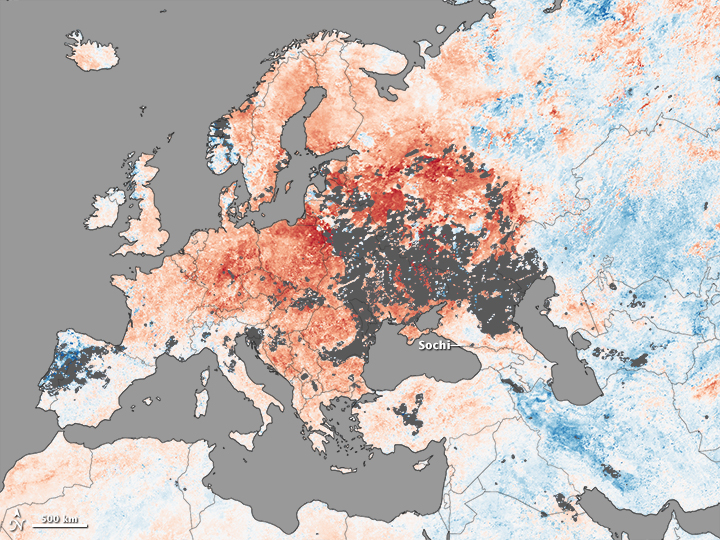
In early 2014, temperature patterns in the northern hemisphere offered a good example of how the atmosphere can simultaneously produce starkly contrasting weather extremes. In North America, a swirling mass of Arctic air moved south and brought extremely cold temperatures—and much discussion of the polar vortex. At the same time, Europe faced a stretch of unusually warm weather that made holiday celebrations rainy rather than snowy and prompted discussions about whether there will be enough snow for the upcoming winter Olympics in Sochi, Russia.
The top map above shows land surface temperature anomalies in North America for January 1–7, 2014. Based on data from the Moderate Resolution Imaging Spectroradiometer (MODIS) on NASA’s Terra satellite, the map depicts temperatures for that period compared to the 2001–2010 average for the same week. Areas with warmer than average temperatures are shown in red; near-normal temperatures are white; and areas that were cooler than the base period are blue. Gray indicates areas where clouds blocked the satellite from collecting usable data. The second map, based on the same MODIS data, shows temperature anomalies in Europe for the same period.
In the United States, the cold spell generated public debate about whether such events disprove global warming or if, in fact, they are exacerbated or caused by it. However, most climate scientists and meteorologists are wary of drawing such connections between climate and weather, which operate on different time scales.
“It’s tempting to link individual weather events like this to broader discussions of climate change, and there certainly are some interesting theories out there, but the science really isn’t mature enough at this point to make any meaningful connections,” said Paul Newman, an atmospheric scientist based at NASA’s Goddard Space Flight Center. “One-off events like this are neither evidence for or against climate change.”
Other experts have emphasized individual weather events are such a small piece in the global earth system. At its peak, the cold spell that attracted so much attention in the United States affected only about 2 percent of Earth, noted Capital Weather Gang meteorologist Jason Samenow. And despite the cold, NOAA’s U.S. Records database showed that four times more daily record highs (999) than record lows (254) were set in the 30 days ending on January 5, according to Bob Henson of the National Center for Atmospheric Research.
“When weather events like this come along, it’s critical to remember that weather in the United States does not define the global trends,” said Marshall Shepherd, president of the American Meteorological Society and a professor at the University of Georgia.
Europe and the western United States weren’t the only areas that experienced warm temperatures in late-December 2013 and early January 2014. Australians sweated through an intense heatwave that brought record-breaking temperatures to nearly 9 percent of the country. And in South America, Argentinians faced a two-week heatwave that elevated temperatures more than 15°C (27°F) above average in some areas, producing widespread power and water shortages.
NASA Earth Observatory image by Jesse Allen, using data from the Level 1 and Atmospheres Active Distribution System (LAADS). Caption by Adam Voiland, with information from Paul Newman (NASA Goddard), Marshall Shepherd (University of Georgia), and John Knox (University of Georgia).