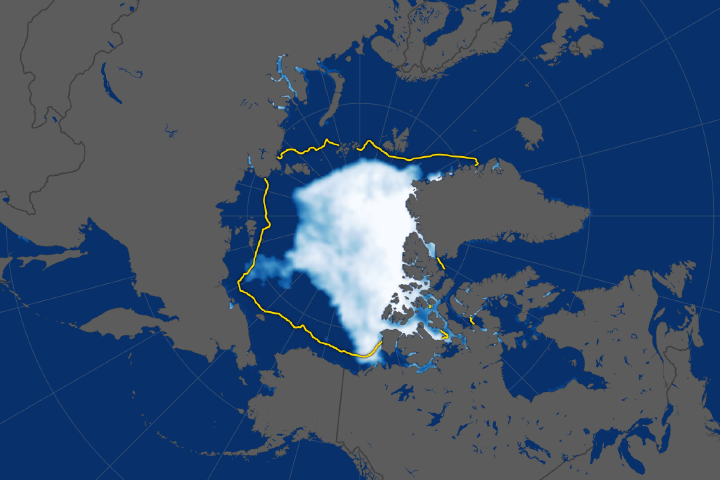

After an unusually cool summer in the northernmost latitudes, Arctic sea ice appears to have reached its annual minimum extent on September 13, 2013. Analysis of satellite data by the National Snow and Ice Data Center (NSIDC) showed that sea ice extent shrunk to 5.10 million square kilometers (1.97 million square miles).
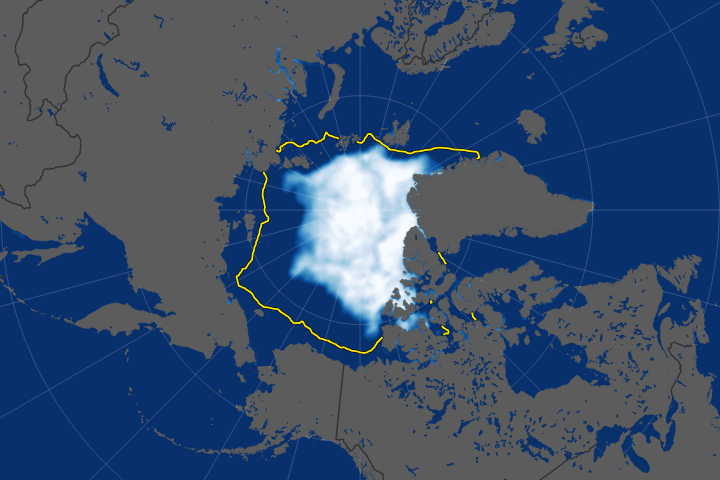
The extent of sea ice this September is substantially greater than last year’s record low. On September 16, 2012, Arctic sea ice spread across just 3.41 million square kilometers (1.32 million square miles)—the smallest extent ever recorded by satellites and about half the average minimum from 1981 to 2010.
Though less Arctic sea ice melted in 2013 compared to 2012, this year’s total is the sixth lowest in the satellite record. This year continues a long-term downward trend of about 12 percent Arctic sea ice loss per decade since the late 1970s—a decline that accelerated after 2007.
“I was expecting that this year would be higher than last year,” said Walt Meier, a glaciologist at NASA’s Goddard Space Flight Center. “There is always a tendency to have an uptick after an extreme low. In our satellite data, the Arctic sea ice has never set record low minimums in consecutive years.”
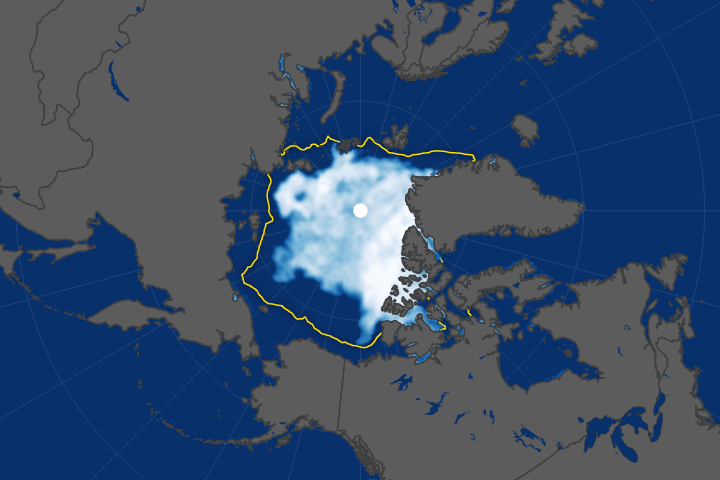
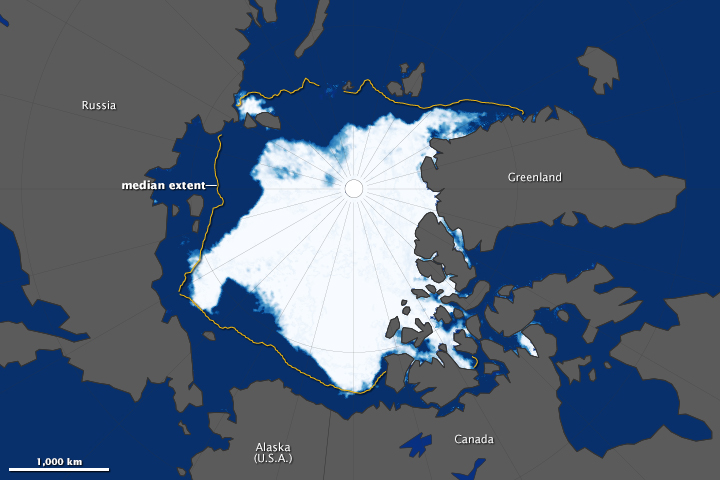
The map above shows the extent of Arctic sea ice on September 13, 2013. Extent is defined as the total area in which the ice concentration is at least 15 percent. The map was compiled from observations by the Advanced Microwave Scanning Radiometer 2 (AMSR-2) sensor on the Global Change Observation Mission 1st–Water (“Shizukuâ€) satellite, which is operated by the Japan Aerospace Exploration Agency (JAXA). The yellow outline on the map shows the median sea ice extent observed in September from 1981 through 2010.
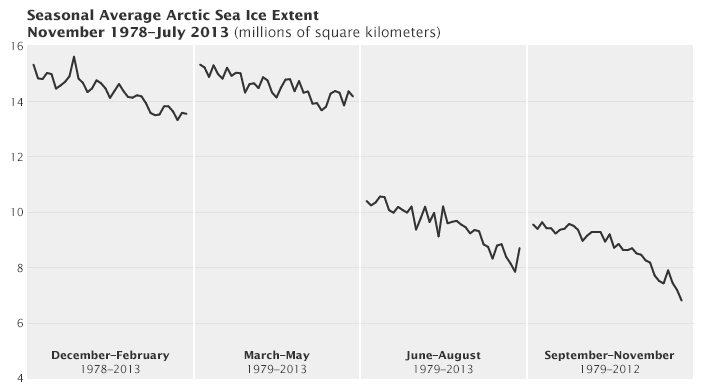
Although the extent of the Arctic Ocean covered by sea ice is higher this September than it was in 2012, it does not indicate “global cooling” or a recovery of the Arctic sea ice. As shown in the plot above, the extent of Arctic sea ice has decreased in every season of the year since 1979. This cycle plot shows the mean sea ice extent separately for each season from 1979 to 2013. For example, the first panel shows Arctic ice during winter (December, January, and February) for the years 1978–79 to 2012–13. The second panel shows average ice extent for spring (March, April, and May); the third shows summer (June, July, and August); and the fourth shows autumn (September, October, November).
In summer 2013 (June, July, August), the average extent was 8.71 million square kilometers, compared to 7.85 million in 2012 (the record low for the summer months), and 10.40 million in 1979, the first full year of satellite measurements. These sea ice data are archived and distributed by NSIDC.
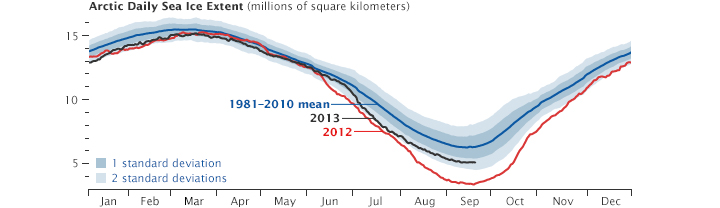
The ice cap covering the Arctic Ocean shrinks and expands with the seasons. It grows dramatically each winter, usually reaching its maximum in March. It melts just as dramatically each summer, generally reaching its minimum in September. The plot below shows this annual cycle, including the long term trends and the past two years.
This year, cooler weather in the spring and summer led to a late start for the melt season and less melting overall. The colder temperatures, which ranged from 1 to 3 degrees Celsius (1.8 to 5.4 degrees Fahrenheit) lower than average, according to a combined analysis of observations and a modeled forecast called Modern Era Retrospective analysis for Research and Applications (MERRA). The cooler summer was due in part to a series of cyclones and weather systems that brought in clouds and prevented sunlight from heating up the ice and water.
The Arctic sea ice cover today is much thinner on average than it was years ago. Satellite imagery, submarine sonar measurements, and data collected from NASA’s Operation IceBridge indicate that the sea ice thickness is as much as 50 percent thinner than in previous decades, going from an average thickness of 3.8 meters (12.5 feet) in 1980 to 1.9 meters (6.2 feet) in recent years. Older, thicker ice is being replaced by thinner, seasonal ice.
Most of the Arctic Ocean used to be covered by multiyear ice, or ice that has survived at least two summers and is typically 3 to 4 meters (10 to 13 feet) thick. This older ice has declined at an even faster rate than younger ice and is now largely relegated to a strip along the northern coast of Greenland. The rest of the Arctic Ocean is dominated by first year ice, or ice that formed over the previous winter and is only 1 to 2 meters (3 to 7 feet) thick.
“Thinner ice melts completely at a faster rate than thicker ice does, so if the average thickness of Arctic sea ice goes down, it’s more likely that the extent of the summer ice will go down as well,” said Joey Comiso, senior scientist at NASA Goddard and coordinating lead author of the Cryosphere Observations chapter of the upcoming report of the Intergovernmental Panel on Climate Change. “At the rate we’re observing this decline, it’s very likely that the Arctic’s summer sea ice will completely disappear within this century.”
NASA Earth Observatory image by Jesse Allen, using data from the Advanced Microwave Scanning Radiometer 2 (AMSR2) sensor on the Global Change Observation Mission 1st-Water (GCOM-W1) satellite. Sea ice line plot and cycle graph by Robert Simmon, NASA Earth Observatory, based on NSIDC data. Caption by Maria-José Viñas, NASA Earth Science News Team, and Mike Carlowicz, NASA Earth Observatory.