Satellite observations of Earth’s land and ice surfaces and the open ocean have been incredibly valuable for understanding the processes and rhythms of our planet. But at the intersection of land and sea, many imaging techniques and analyses can get muddy.
For remote sensing scientists, coastal waters are a productive, murky, fascinating, and frustrating mess. Salt water meets fresh. Waters rise and fall and get mixed constantly by waves, winds, eddies, and other turbulence. The visible boundaries between ocean and land move on scales from hours to seasons to decades. Even the atmosphere gets murky, as moisture, pollution, and airborne particles are more abundant and dynamic than over open water. And light plays off all of these surfaces, solid and liquid.
The newest satellite in the Landsat series offers scientists a clearer view. The Landsat Data Continuity Mission—officially renamed Landsat 8 on May 30, 2013—has better spatial resolution than most ocean-sensing instruments and greater sensitivity to brightness and color than previous Landsats. Most significantly, it can observe the Earth in wavelengths that allows scientists to adjust for the distortions caused by the atmosphere near the coast.
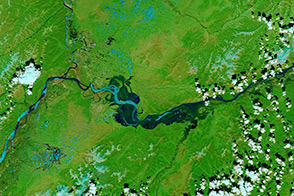
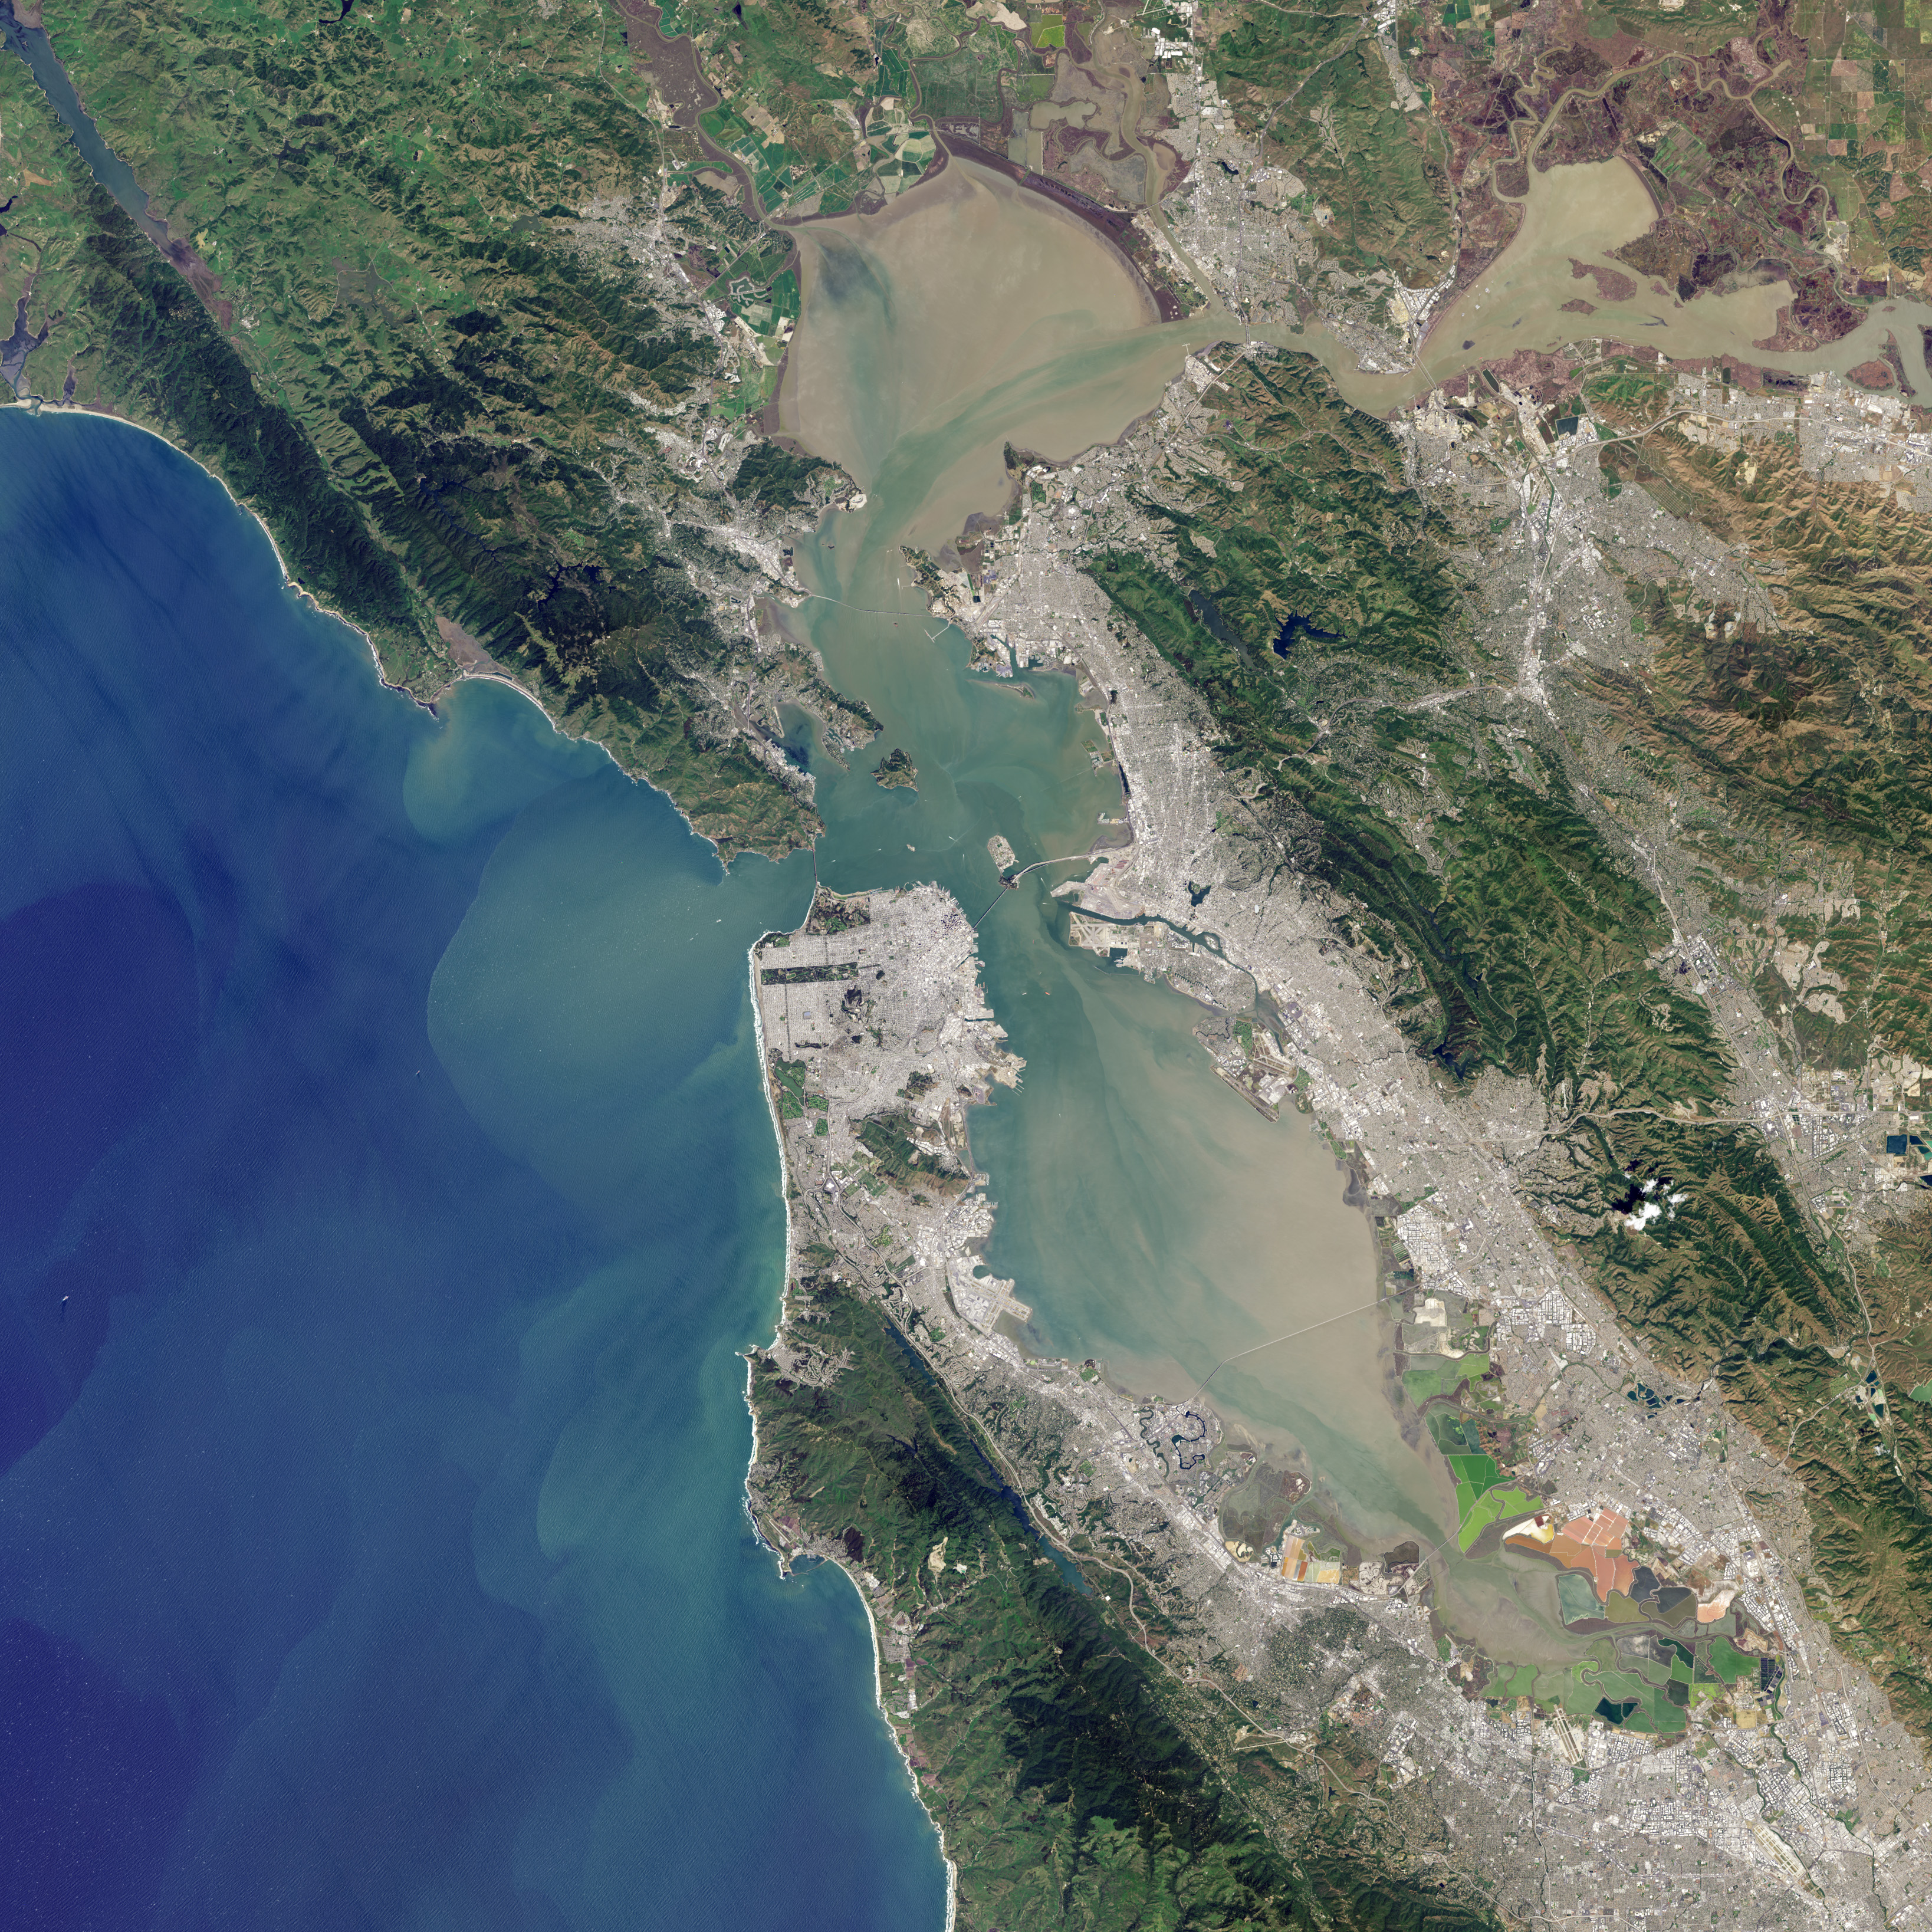
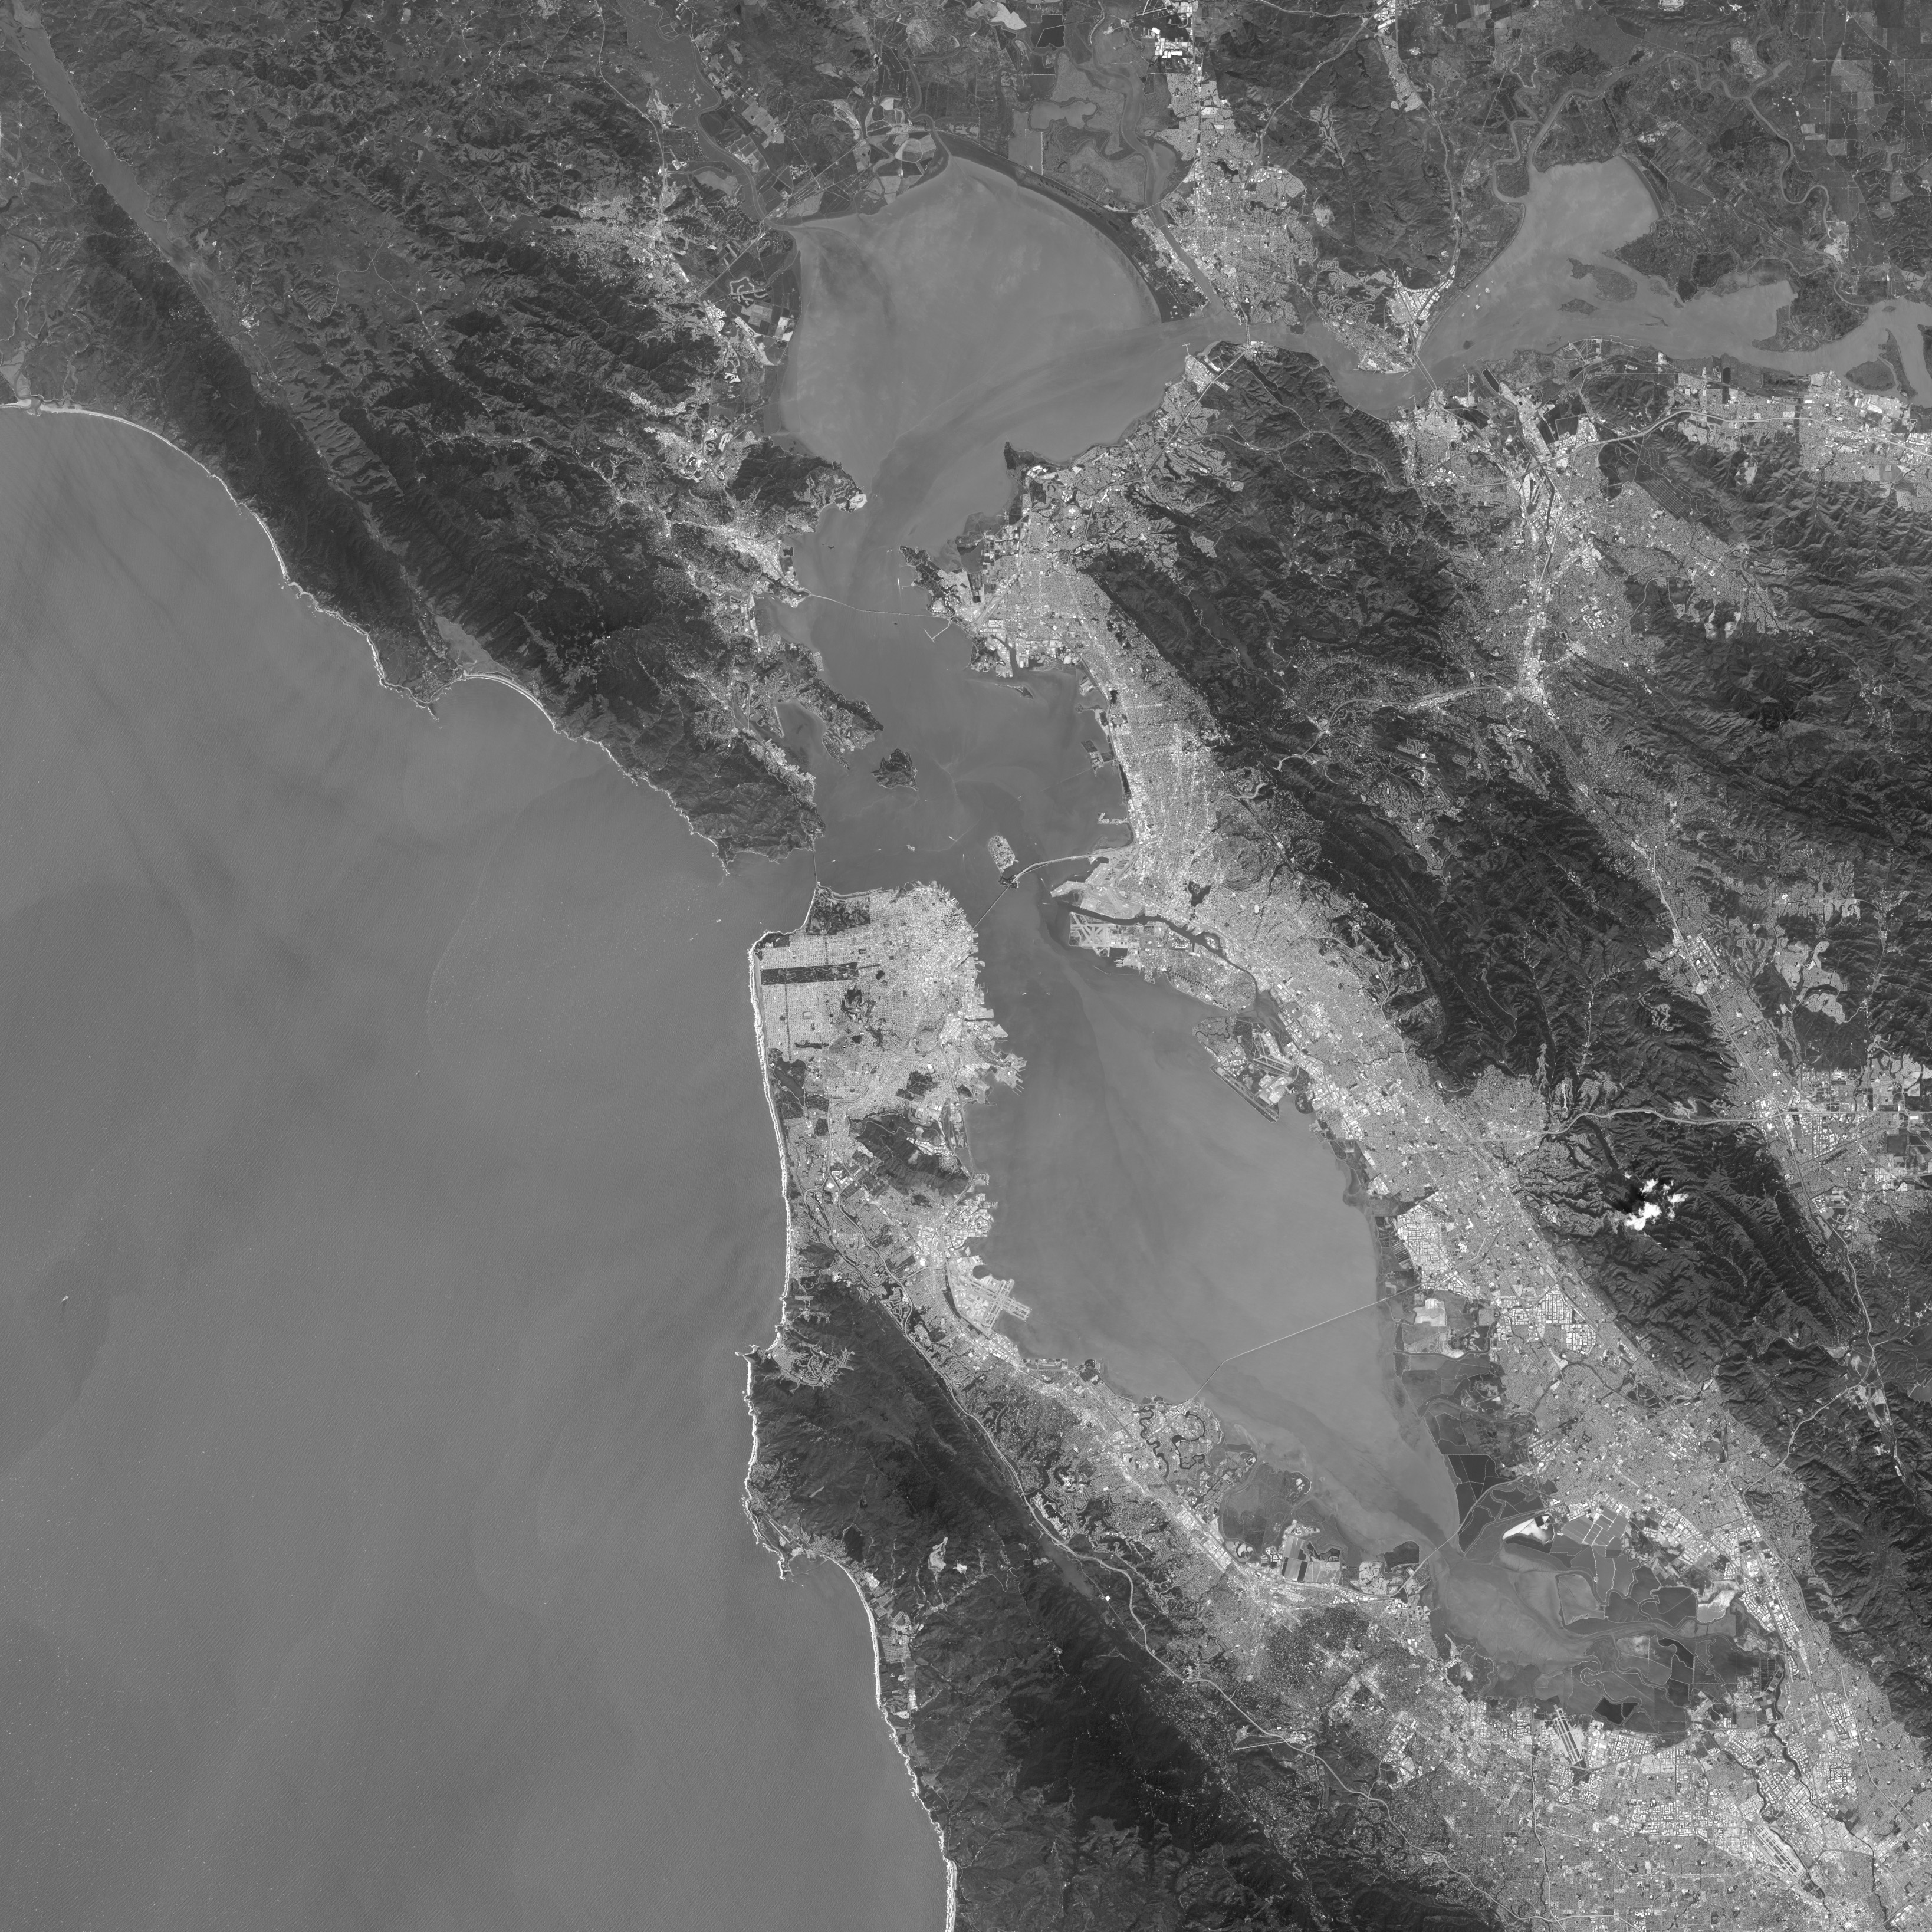
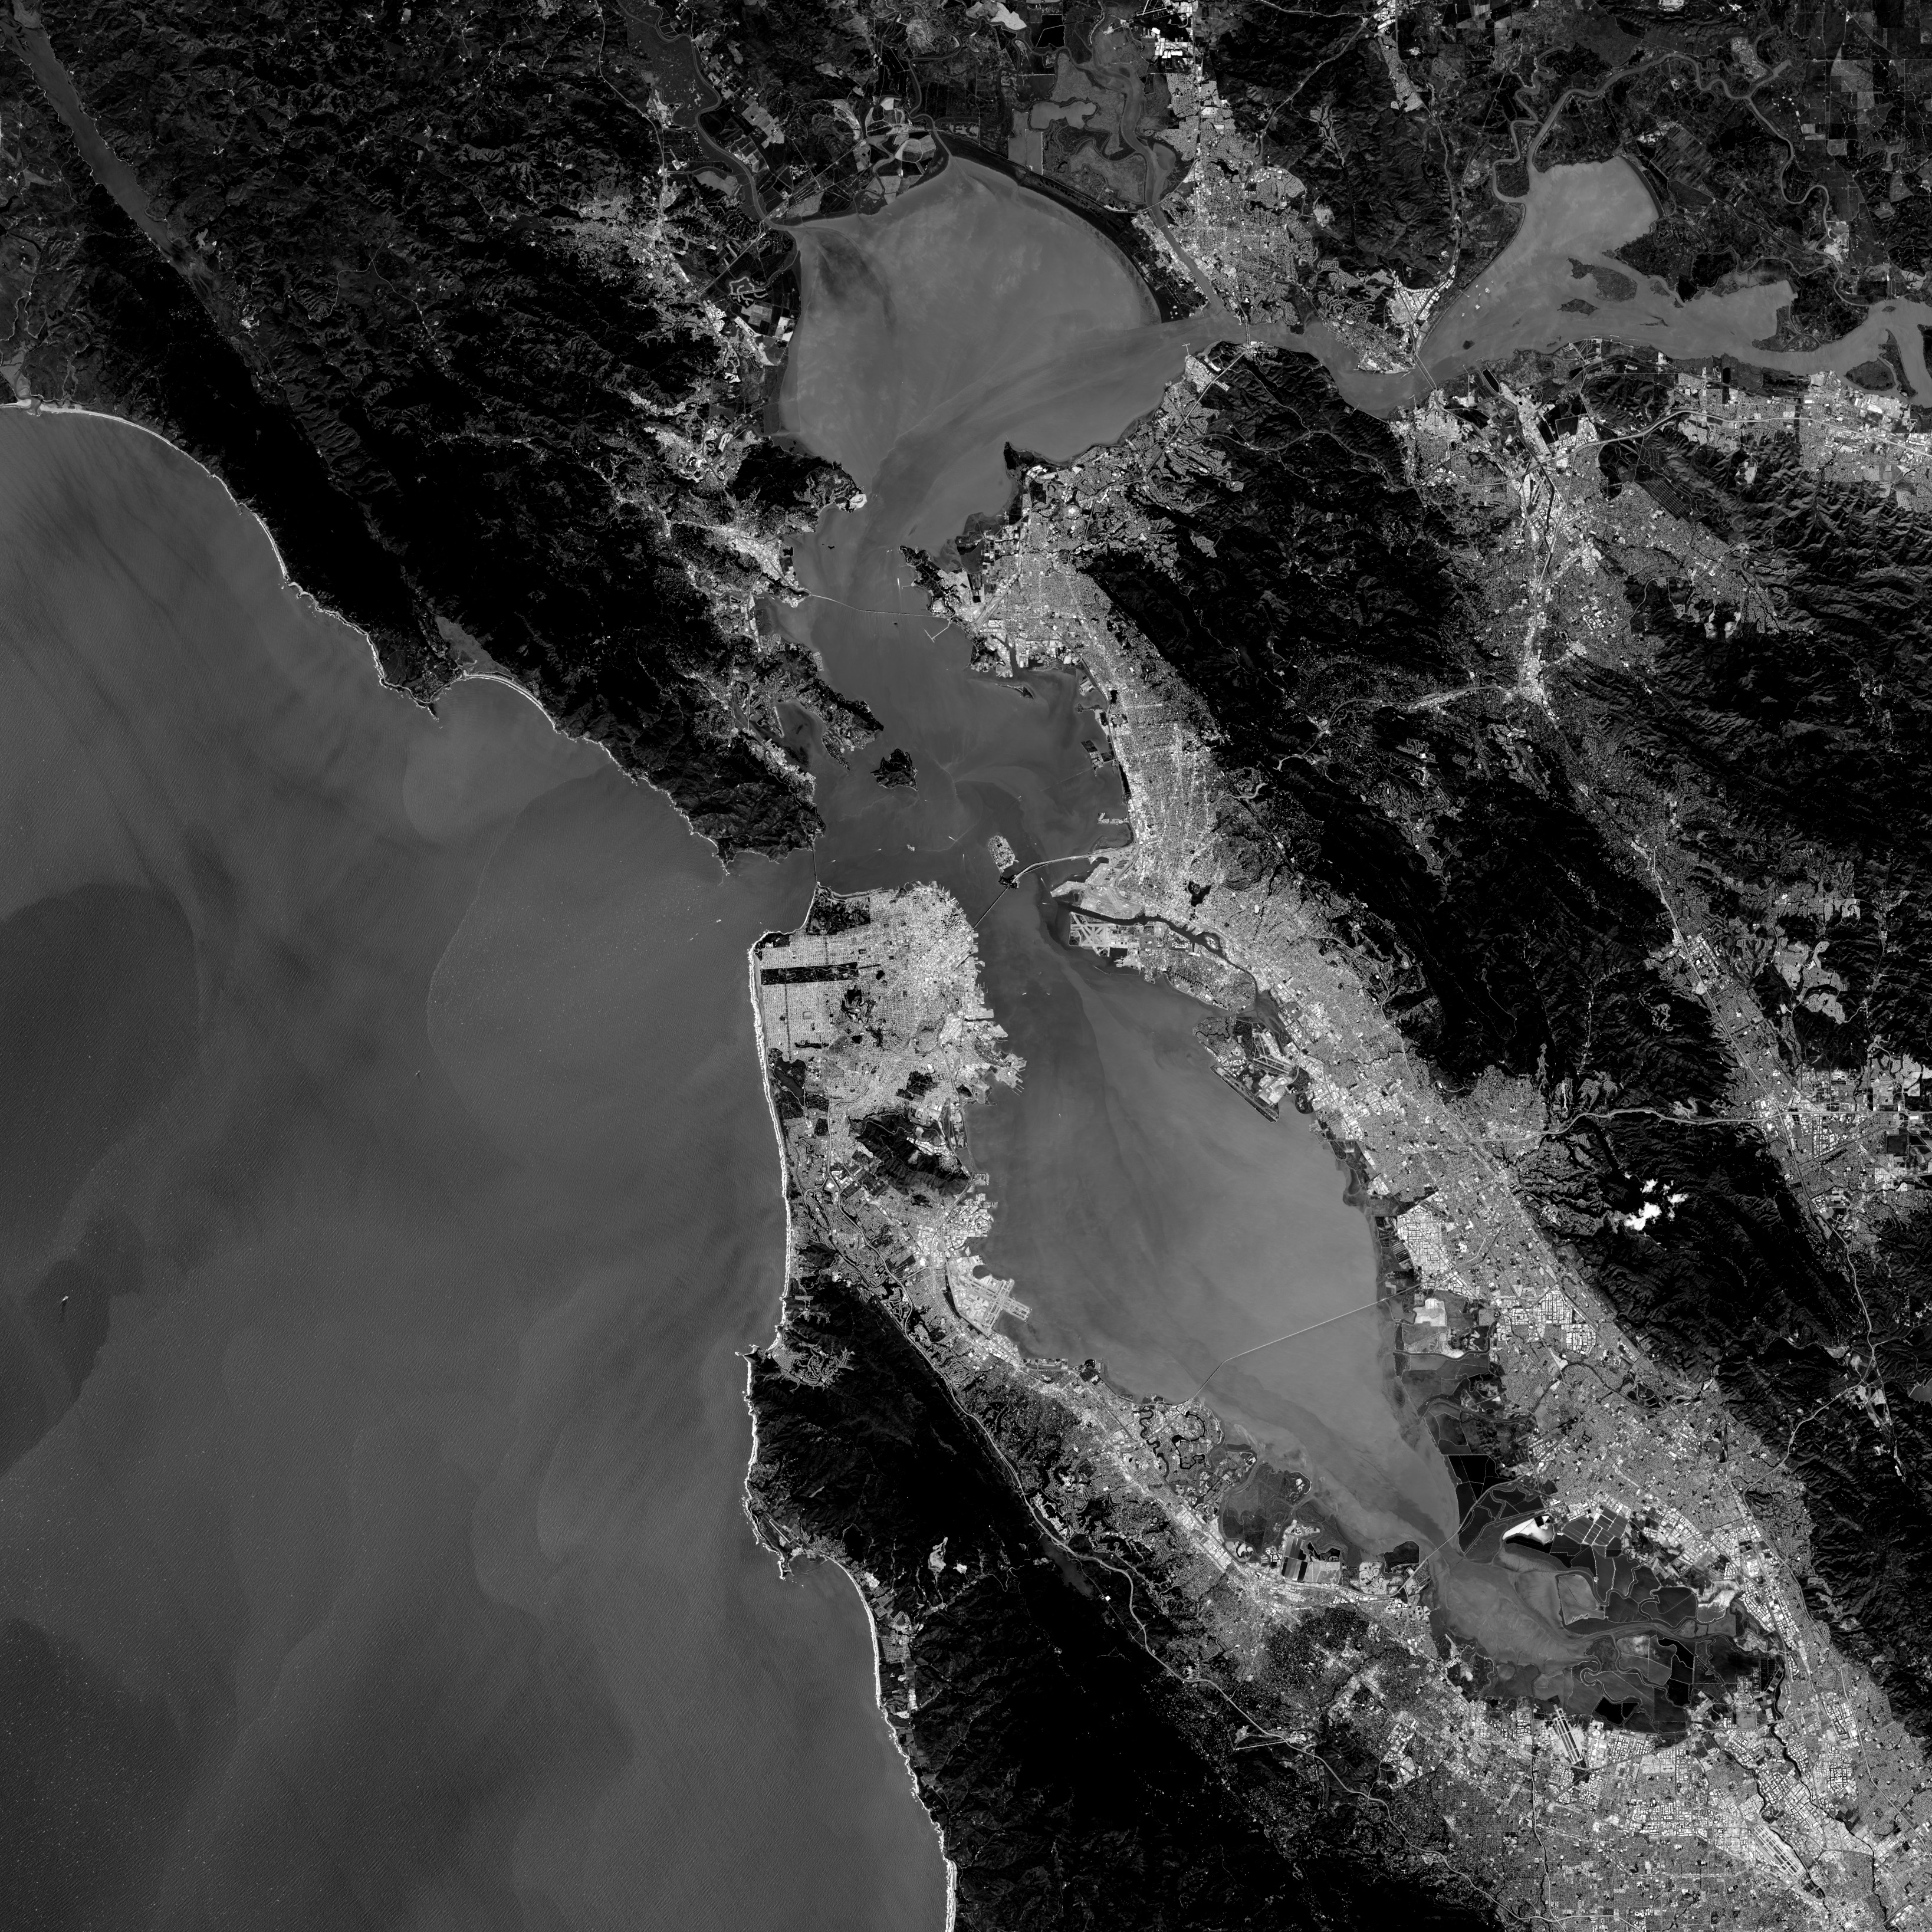
The images above were collected by the Operational Land Imager (OLI) on Landsat 8 on April 16, 2013, while the satellite was still being calibrated and checked out. The top image shows San Pablo Bay and the north end of San Francisco Bay in natural color. The two lower images show the same area in specific spectral bands or wavelengths: the shortwave, ultra-blue “coastal” band at 0.43–0.45 micrometers (second image) and the “blue” band at 0.45–0.51 micrometers (third image).
Note how plumes of sediment and other features in the water are less distinct and have less contrast in the coastal band than the blue band. The coastal band is sensitive to aerosols and other atmospheric effects that scatter light and make the view of San Francisco Bay seem hazy. By comparing the coastal blue and the blue bands, scientists can then correct for the difference and get a better view of what is happening at the water surface instead of in the air.
“These images show of the complexity of the problem in soupy coastal waters,” said John Schott, a member of the Landsat science team and a professor at the Rochester Institute of Technology. Landsat 8 should help researchers make much more accurate observations of sediments and particles, organic matter, and the chlorophyll-rich phytoplankton suspended in lakes, rivers, and the ocean. It may even help researchers make quantitative measurements.
The coastal blue band on Landsat 8 is comparable to wavelengths observed by the Moderate Resolution Imaging Spectroradiometer (MODIS) on the Aqua and Terra satellites, by the Visible Infrared Imaging Radiometer on Suomi NPP, and by the Sea-viewing Wide Field-of-view Sensor (SeaWiFS) on SeaStar. However, Landsat 8 improves upon those sensors with better spatial resolution and dynamic range.
“With the new coastal band, there is a good chance to estimate carbon exchange at the land-water interface—such as salt marshes, wetlands, harbors—where ocean color instruments fail due to coarse pixel size,” said Nima Pahlevan, a researcher at the University of Massachusetts–Boston. “That said, the retrieval of chlorophyll and colored dissolved organic matter in turbid coastal waters is an ongoing challenge.”
Schott and Pahlevan also note that Landsat 8 should expand and improve upon their ability to map some underwater features, such as kelp and other vegetation, coral reefs, and the bathymetry of shallow waters.
Images by Jesse Allen and Robert Simmon, using data provided by the U.S. Geological Survey and NASA. Caption by Michael Carlowicz.