
About a quarter-century ago, scientists and policymakers unveiled what the United Nations calls “the most successful treaty in UN history.” On September 16, 1987, the first 24 nations signed on to the Montreal Protocol on Substances that Deplete the Ozone Layer; 173 more have signed on in the years since. The international agreement likely saved the world from an environmental crisis, while setting an example for how to develop and implement environmental policy.
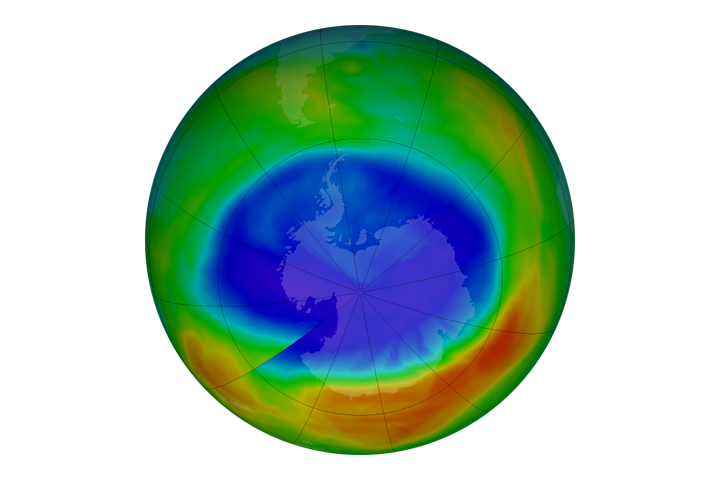
Prompted by scientific observations from the laboratory, the ground, aircraft, and satellites, the Montreal Protocol first reduced and then banned the chlorine- and bromine-based chemicals (particularly chlorofluorocarbons, or CFCs) that destroy atmospheric ozone. The destruction of the ozone layer allows more of the Sun’s ultraviolet radiation to reach the surface of the planet, increasing the risk of sunburns, skin cancer, and eye damage. The most prominent and infamous sign of depletion is the annual “ozone hole” that forms around the South Pole.
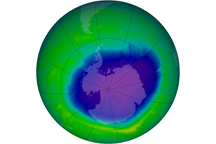
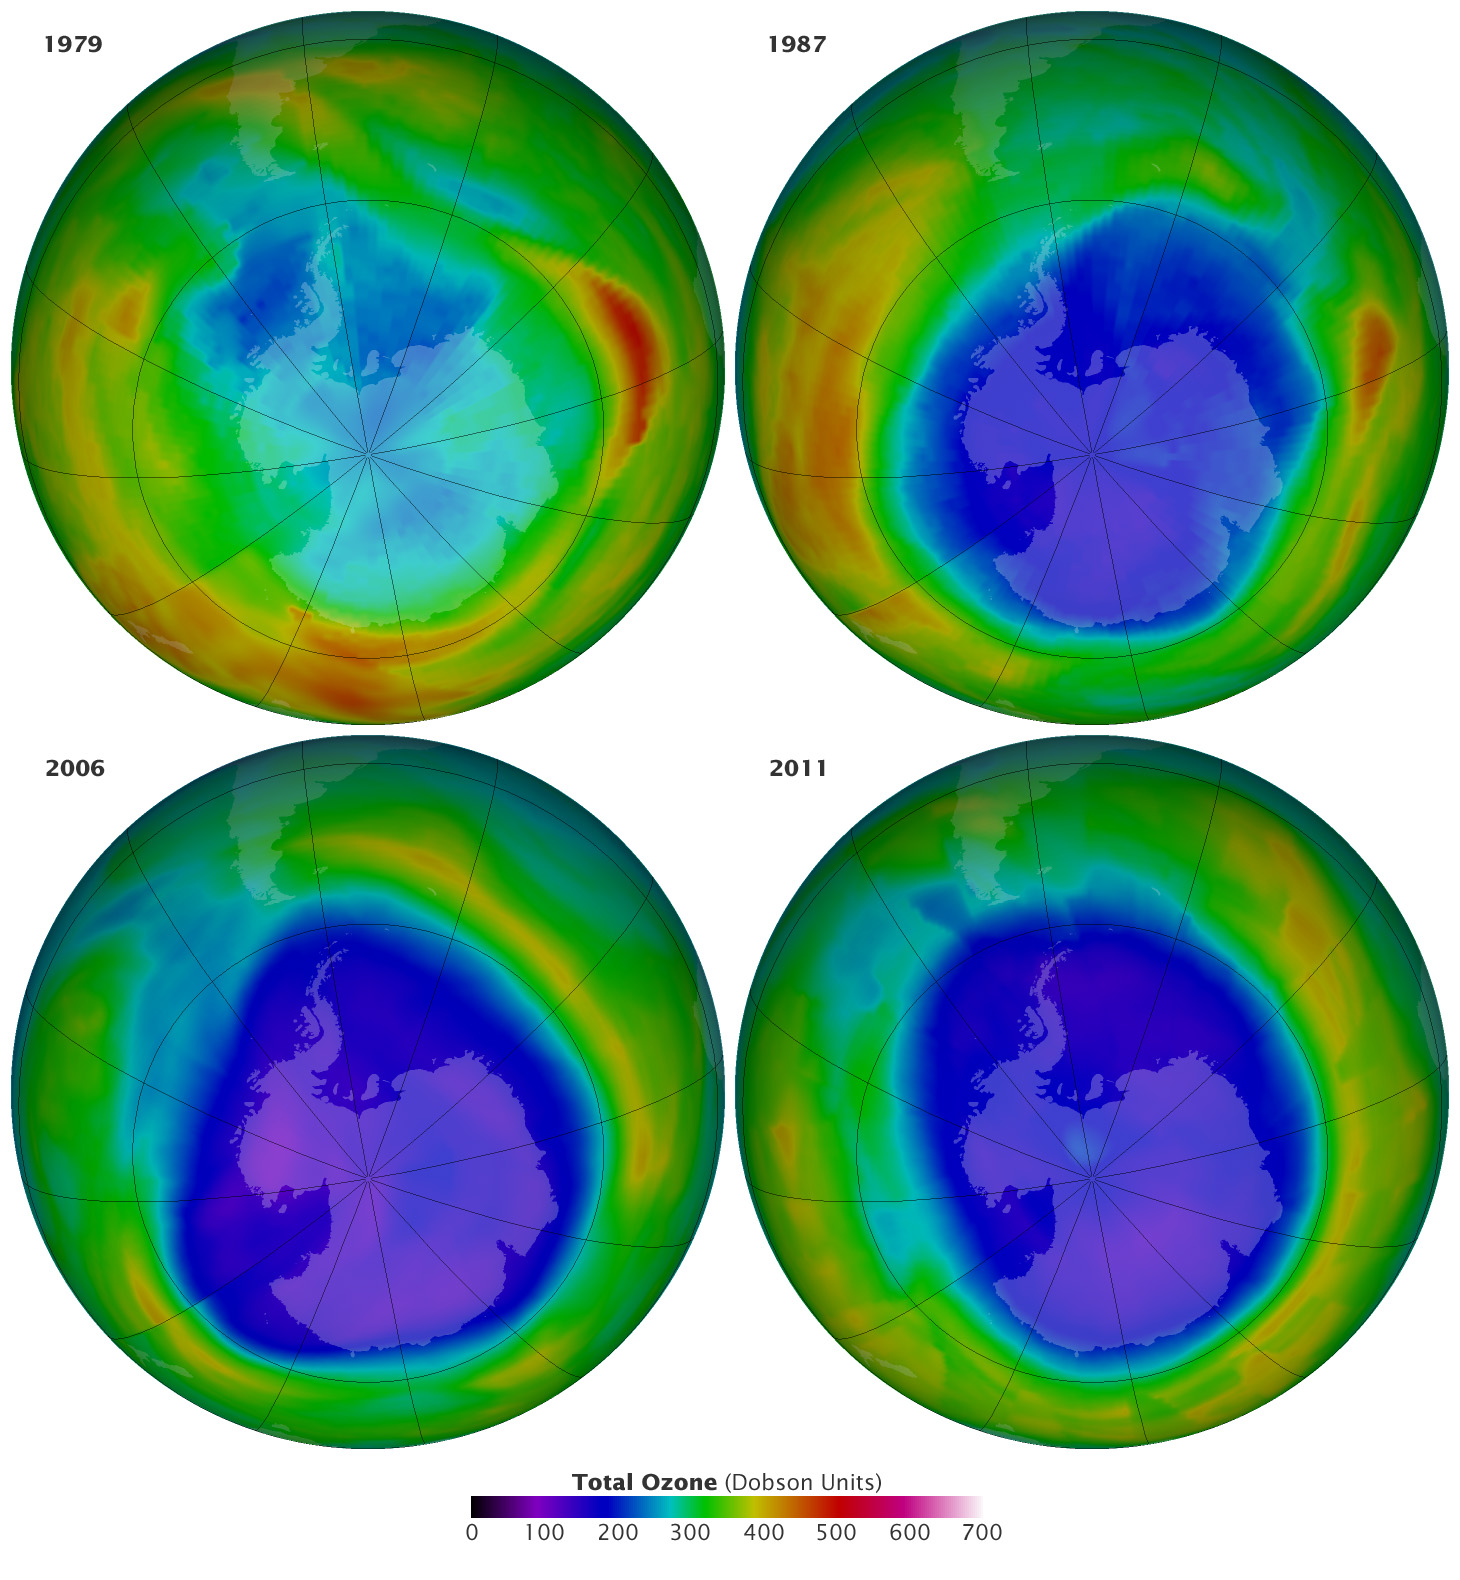
The images above show the Antarctic ozone hole on September 16 (the International Day for the Preservation of the Ozone Layer) in the years 1979, 1987, 2006, and 2011. The first two maps are based on data from the Total Ozone Mapping Spectrometer (TOMS) on the Nimbus-7 satellite. The other two maps are made with data from the Ozone Monitoring Instrument on the Aura satellite. Though taken by different instruments, the data sets have all been cross-calibrated and reanalyzed by scientific models. An animation of the data (high-resolution download below the main image) reveals the formation and dissipation of the ozone hole from July 1 to December 31 in each of the four years.
Stratospheric ozone is typically measured in Dobson Units (DU), which is the number of molecules required to create a layer of pure ozone 0.01 millimeters thick at a temperature of 0 degrees Celsius and an air pressure of 1 atmosphere (the pressure at the surface of the Earth). The average amount of ozone in Earth’s atmosphere is 300 Dobson Units, equivalent to a layer 3 millimeters (0.12 inches) thick—the height of 2 pennies stacked together.
In 1979—when scientists were just coming to understand that atmospheric ozone could be depleted—the area of ozone depletion over Antarctica grew to 1.1 million square kilometers, with a minimum ozone concentration of 194 Dobson Units. In 1987, as the Montreal Protocol was being signed, the area of the hole reached 22.4 million square kilometers and ozone concentrations dropped to 109 DU. By 2006, the worst year for ozone depletion to date, the numbers were 29.6 million square kilometers and just 84 DU. By 2011, the most recent year with a complete data set, the hole stretched 26 million square kilometers and dropped to 95 DU.
According to NASA scientist Pawan Bhartia, “The Antarctic hole is stabilizing and may be slowly recovering. Our focus now is to make sure that it is healing as expected.” The amount of ozone-depleting substances (ODS) in the atmosphere has stopped rising in recent years, and may actually be decreasing. The yearly ozone hole should continue for a while, though, as CFCs and other ODSs can last for decades in the air. Scientists found in a 2009 study that without the Montreal Protocol, global ozone depletion (not just Antarctic) would be at least 10 times worse than current levels by 2050.
“Changes in the ozone hole now are not significantly driven by changes in CFCs, but instead driven by year-to-year changes in weather in the stratosphere,” said Bhartia, who in 1985 was the first researcher to present satellite data showing the Antarctic ozone hole. “Like two snowflakes, two ozone holes are never alike. ”
NASA animation by Robert Simmon, using imagery from the Ozone Hole Watch. Caption by Mike Carlowicz.