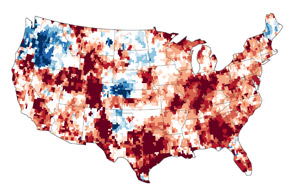
July 2012 was the hottest month on record for the contiguous (lower 48) United States, according to the National Climatic Data Center (NCDC) of the National Oceanic and Atmospheric Administration (NOAA). It turns out that the month was pretty warm globally as well, lining up as the fourth warmest July since modern record-keeping began in 1880.
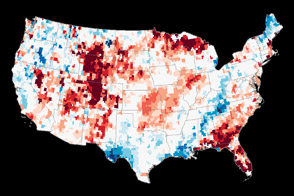
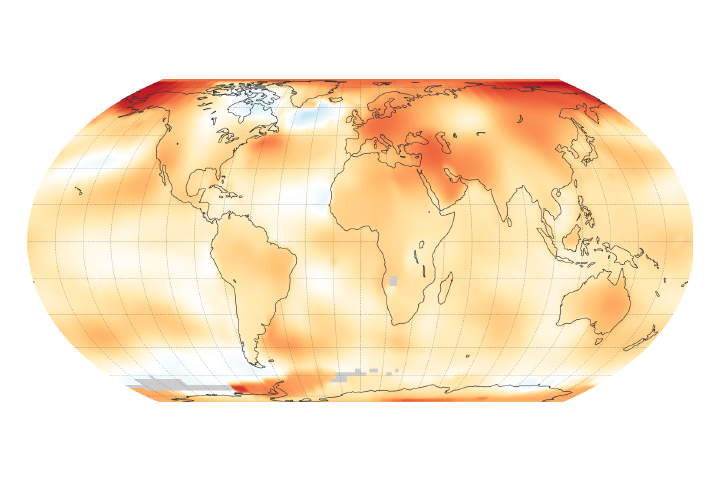
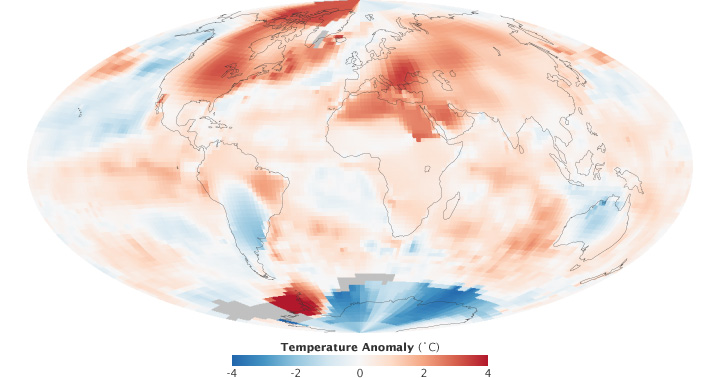
The map above shows temperature anomalies for July 2012, as analyzed by the NASA Goddard Institute for Space Studies (GISS). That is, the map shows how much warmer or cooler each area was in July 2012 compared with the average for the month from 1951–1980. To build their map, scientists at GISS use publicly available data from 6,300 meteorological stations around the world; ship-based and satellite observations of sea surface temperature; and Antarctic research station measurements. For more explanation of how the analysis works, read World of Change: Global Temperatures.
Note that the map does not depict absolute temperatures; it shows changes from the long-term average. The darkest reds are as much as 4° Celsius (7° Fahrenheit) above the norm for the month; white is normal; the darkest blues are 4°C below normal. In addition to extreme warming over the United States, the Antarctic Peninsula and much of eastern Euope and North Africa were especially hot in July 2012.
According to NCDC: “The average combined global land and ocean surface temperature for July 2012 was 0.62°C (1.12°F) above the 20th century average of 15.8°C (60.4°F)...The Northern Hemisphere land surface temperature for July 2012 was the all-time warmest July on record, at 1.19°C (2.14°F) above average...the fourth month in a row that the Northern Hemisphere has set a new monthly land temperature record. ”
In a recent analysis, NASA GISS director James Hansen and colleagues presented statistics showing that extreme summer heat waves have become much more common in the temperature record as a result of global warming. During the 1951 to 1980 base period used in the analysis, 33 percent of Earth’s land surface experienced statistically hot summers. In the past decade, the number of hot summers has risen to 75 percent of land area. Moreover, extreme heat events—in statistical terms, three standard deviations from the norm—that used to affect 1 percent of the land area in the past have been affecting as much as 10 percent of land area in the years since 2006.
“‘Climate dice,’ describing the chance of unusually warm or cool seasons, have become more and more ‘loaded’ in the past 30 years, coincident with rapid global warming,” Hansen and colleagues wrote. “The distribution of seasonal mean temperature anomalies has shifted toward higher temperatures and the range of anomalies has increased....We can state, with a high degree of confidence, that extreme anomalies such as those in Texas and Oklahoma in 2011 and Moscow in 2010 were a consequence of global warming because their likelihood in the absence of global warming was exceedingly small.”
NASA image by Robert Simmon, based on data from the Goddard Institute for Space Studies. Caption by Mike Carlowicz.