Climate models predict that the build up of greenhouse gases should warm the lower layer of the atmosphere, called the troposphere, and cool the layer above it, the stratosphere. Greenhouse gases accumulate in the troposphere where they absorb energy radiated from the Earth and re-emit energy back to the surface. Because the gases trap heat in the lower parts of the atmosphere, the stratosphere cools down. This pattern of warming in the lower atmosphere and cooling in the stratosphere is a hallmark of greenhouse gas warming in global climate models.
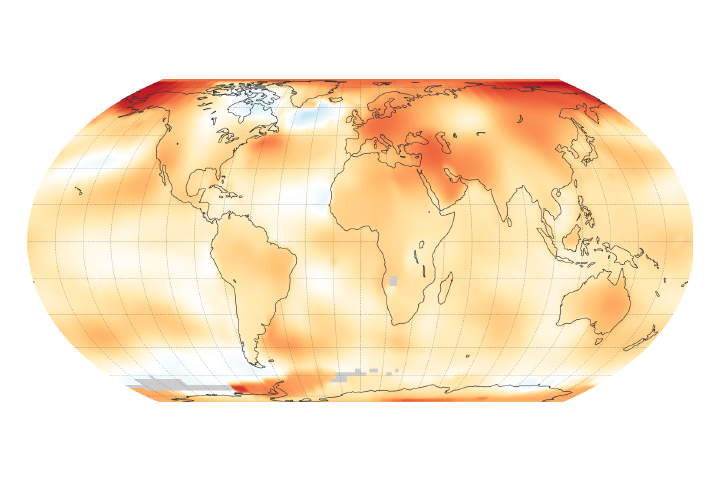
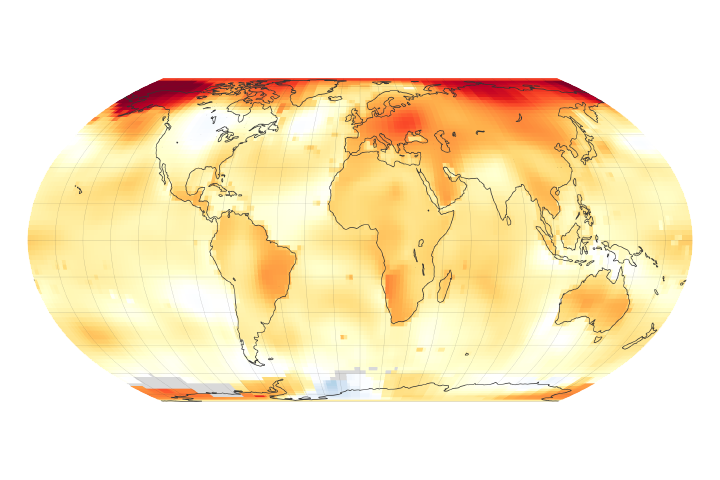
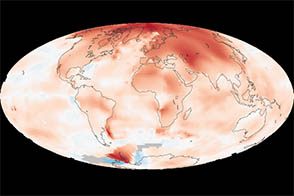
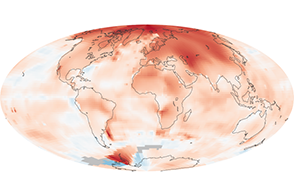
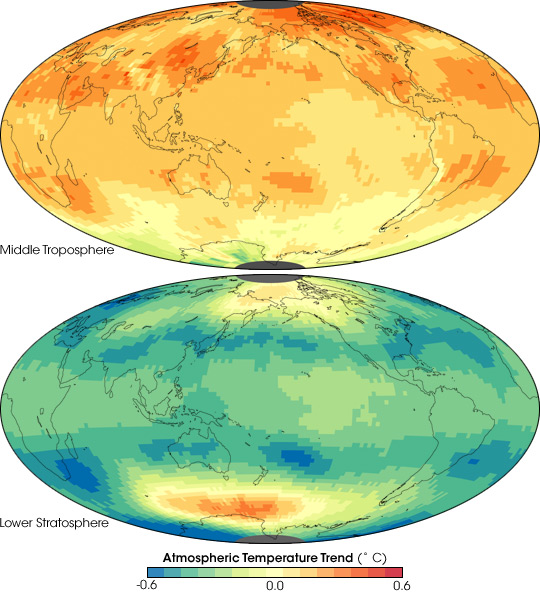
These images show temperature trends in two thick layers of the atmosphere as measured by a series of satellite-based instruments between January 1979 and December 2005. The top image shows temperatures in the middle troposphere, centered around 5 kilometers above the surface. The lower image shows temperatures in the lower stratosphere, centered around 18 kilometers above the surface. Oranges and yellows dominate the troposphere image, indicating that the air nearest the Earth’s surface warmed during the period. The stratosphere image is dominated by blues and greens, indicating cooling.
Globally, the troposphere warmed, and the stratosphere cooled during this period. Local trends varied. The greatest tropospheric warming was in the Arctic, where warming is amplified as snow and ice melt. The Antarctic, on the other hand, showed cooling. Some researchers have explained the localized cooling as a side effect of the ozone hole on atmospheric circulation over Antarctica. Loss of ozone cools the stratosphere, a change which intensifies the vortex of winds that encircle the continent. The stronger vortex isolates the air over the continent, cooling the stratosphere even further. At different times of the year, the unusually cold air dips down from the stratosphere and into the troposphere.
The cooling trend in the stratosphere was probably not solely due to greenhouse gas warming at lower altitudes; loss of ozone also cools the stratosphere. In the stratosphere, two warm spots over Antarctica and the Arctic appear to defy the overall cooling trend. One explanation for these warm spots is that polar stratospheric temperatures can fluctuate widely. The poles, especially the Arctic, experience periodic events known as sudden stratospheric warmings, during which the vortex of winds that circles the poles breaks down. When this happens, the stratosphere can warm several tens of degrees Celsius in a few days. Although these events are more common in the Arctic, a significant sudden stratospheric warming also occurred in the Antarctic stratosphere in 2002 and may help explain the apparent warming trend. Whether the localized warming trend is significant is still uncertain.
The measurements were taken by Microwave Sounding Units and Advanced Microwave Sounding Units flying on a series of National Oceanic and Atmospheric Administration (NOAA) weather satellites. The instruments record microwave energy emitted from oxygen molecules in the atmosphere. Warmer molecules release more energy than cooler molecules, so scientists can measure the temperature of the atmosphere by recording the amount of microwave energy being emitted. Early analyses of these measurements showed little or no warming in the troposphere, where models predicted that warming should be occurring. For a time, these measurements caused some people to question the validity of global climate models and greenhouse gas warming. Scientists discovered, however, that the satellites carrying the microwave instruments had drifted in their orbits over time, so that more recent measurements were taken at a different time of day than older measurements. Once scientists accounted for this bias and other differences between the individual instruments, the measurements showed a warming trend in the troposphere, consistent with surface observations of rising global temperature.
Re-analysis of the satellite measurements answered one of the frequently asked questions about global warming: why didn't the early satellite data show warming in the lower layer of the atmosphere? To read more on this topic, see Climate Q&A, which addresses this and other common questions about global warming.
NASA image created by Jesse Allen, using data provided courtesy of Remote Sensing Systems. Caption information courtesy Carl Mears, Remote Sensing Systems, and Paul Newman and Joel Susskind NASA Goddard Space Flight Center.