(Editor’s note: This image was first published on April 27, 2006, and it was based on data from 1981-2004. A more recent version was published on November 21, 2007. The new version extended the data range through 2007, and was based on a revised analysis that included better inter-calibration among all the satellite records that are part of the time series.)
Cold, snowy, and stuck at the “bottom” of the Earth, Antarctica might seem like a dull place. But this big continent can produce a surprisingly dynamic range of conditions. One example of this range is temperature trends. Although Antarctica warmed around the perimeter from 1982 to 2004, where huge icebergs calved and some ice shelves disintegrated, it cooled closer to the pole.
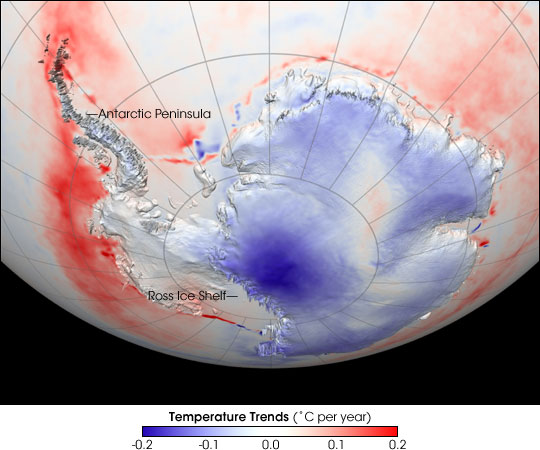
This image shows trends in skin temperatures—temperatures from roughly the top millimeter of the land or sea surface—not air temperatures. The data were collected by the Advanced Very High Resolution Radiometer (AVHRR) sensors that were flown on several National Oceanic and Atmospheric Administration (NOAA) satellites. The data come from the AVHRR’s thermal infrared channel—a portion of the light spectrum we can sense as heat but that human eyes cannot see. This image shows temperature trends for the icy continent from 1982 to 2004. Red indicates areas where temperatures generally increased during that period, and blue shows where temperatures predominantly decreased.
The area of strongest cooling appears at the South Pole, and the region of strongest warming lies along the Antarctic Peninsula. In some instances, bright red spots or streaks along the edge of the continent show where icebergs calved or ice shelves disintegrated, meaning the satellite began seeing warmer ocean water where there had previously been ice. One example of this is the bright red line along the edge of the Ross Ice Shelf.
Why is Antarctica getting colder in the middle when it’s warming up around the edge? One possible explanation is that the warmer temperatures in the surrounding ocean have produced more precipitation in the continent’s interior, and this increased snowfall has cooled the high-altitude region around the pole. Another possible explanation involves ozone. Ozone in the Earth’s stratosphere absorbs ultraviolet radiation, and absorbing this energy warms the stratosphere. Loss of UV-absorbing ozone may have cooled the stratosphere and strengthened the polar vortex, a pattern of spinning winds around the South Pole. The vortex acts like an atmospheric barrier, preventing warmer, coastal air from moving in to the continent’s interior. A stronger polar vortex might explain the cooling trend in the interior of Antarctica.
NASA image based on data provided by Josefino Comiso, NASA-GSFC.