
“Many people said it would never get off the ground; some said it wouldn’t last a year,” notes NASA ocean scientist Gene Carl Feldman. “The mission was planned for five years. We got 13 years of incredible data out of this amazing little satellite.”
From 1998 to 2010, the Sea-viewing Wide Field-of-view-Sensor, or SeaWiFS, made a simple but elegant measurement: how “green” is the Earth. That is, how much chlorophyll—the pigment that helps turn sunlight into organic energy for plants—is present in the seas and on land. Those measurements offered a window into the planet's ability to support life. The long, well-calibrated data record also gives scientists one of the best benchmarks to study the planet’s biological response to a changing environment.
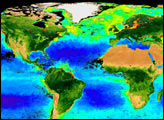
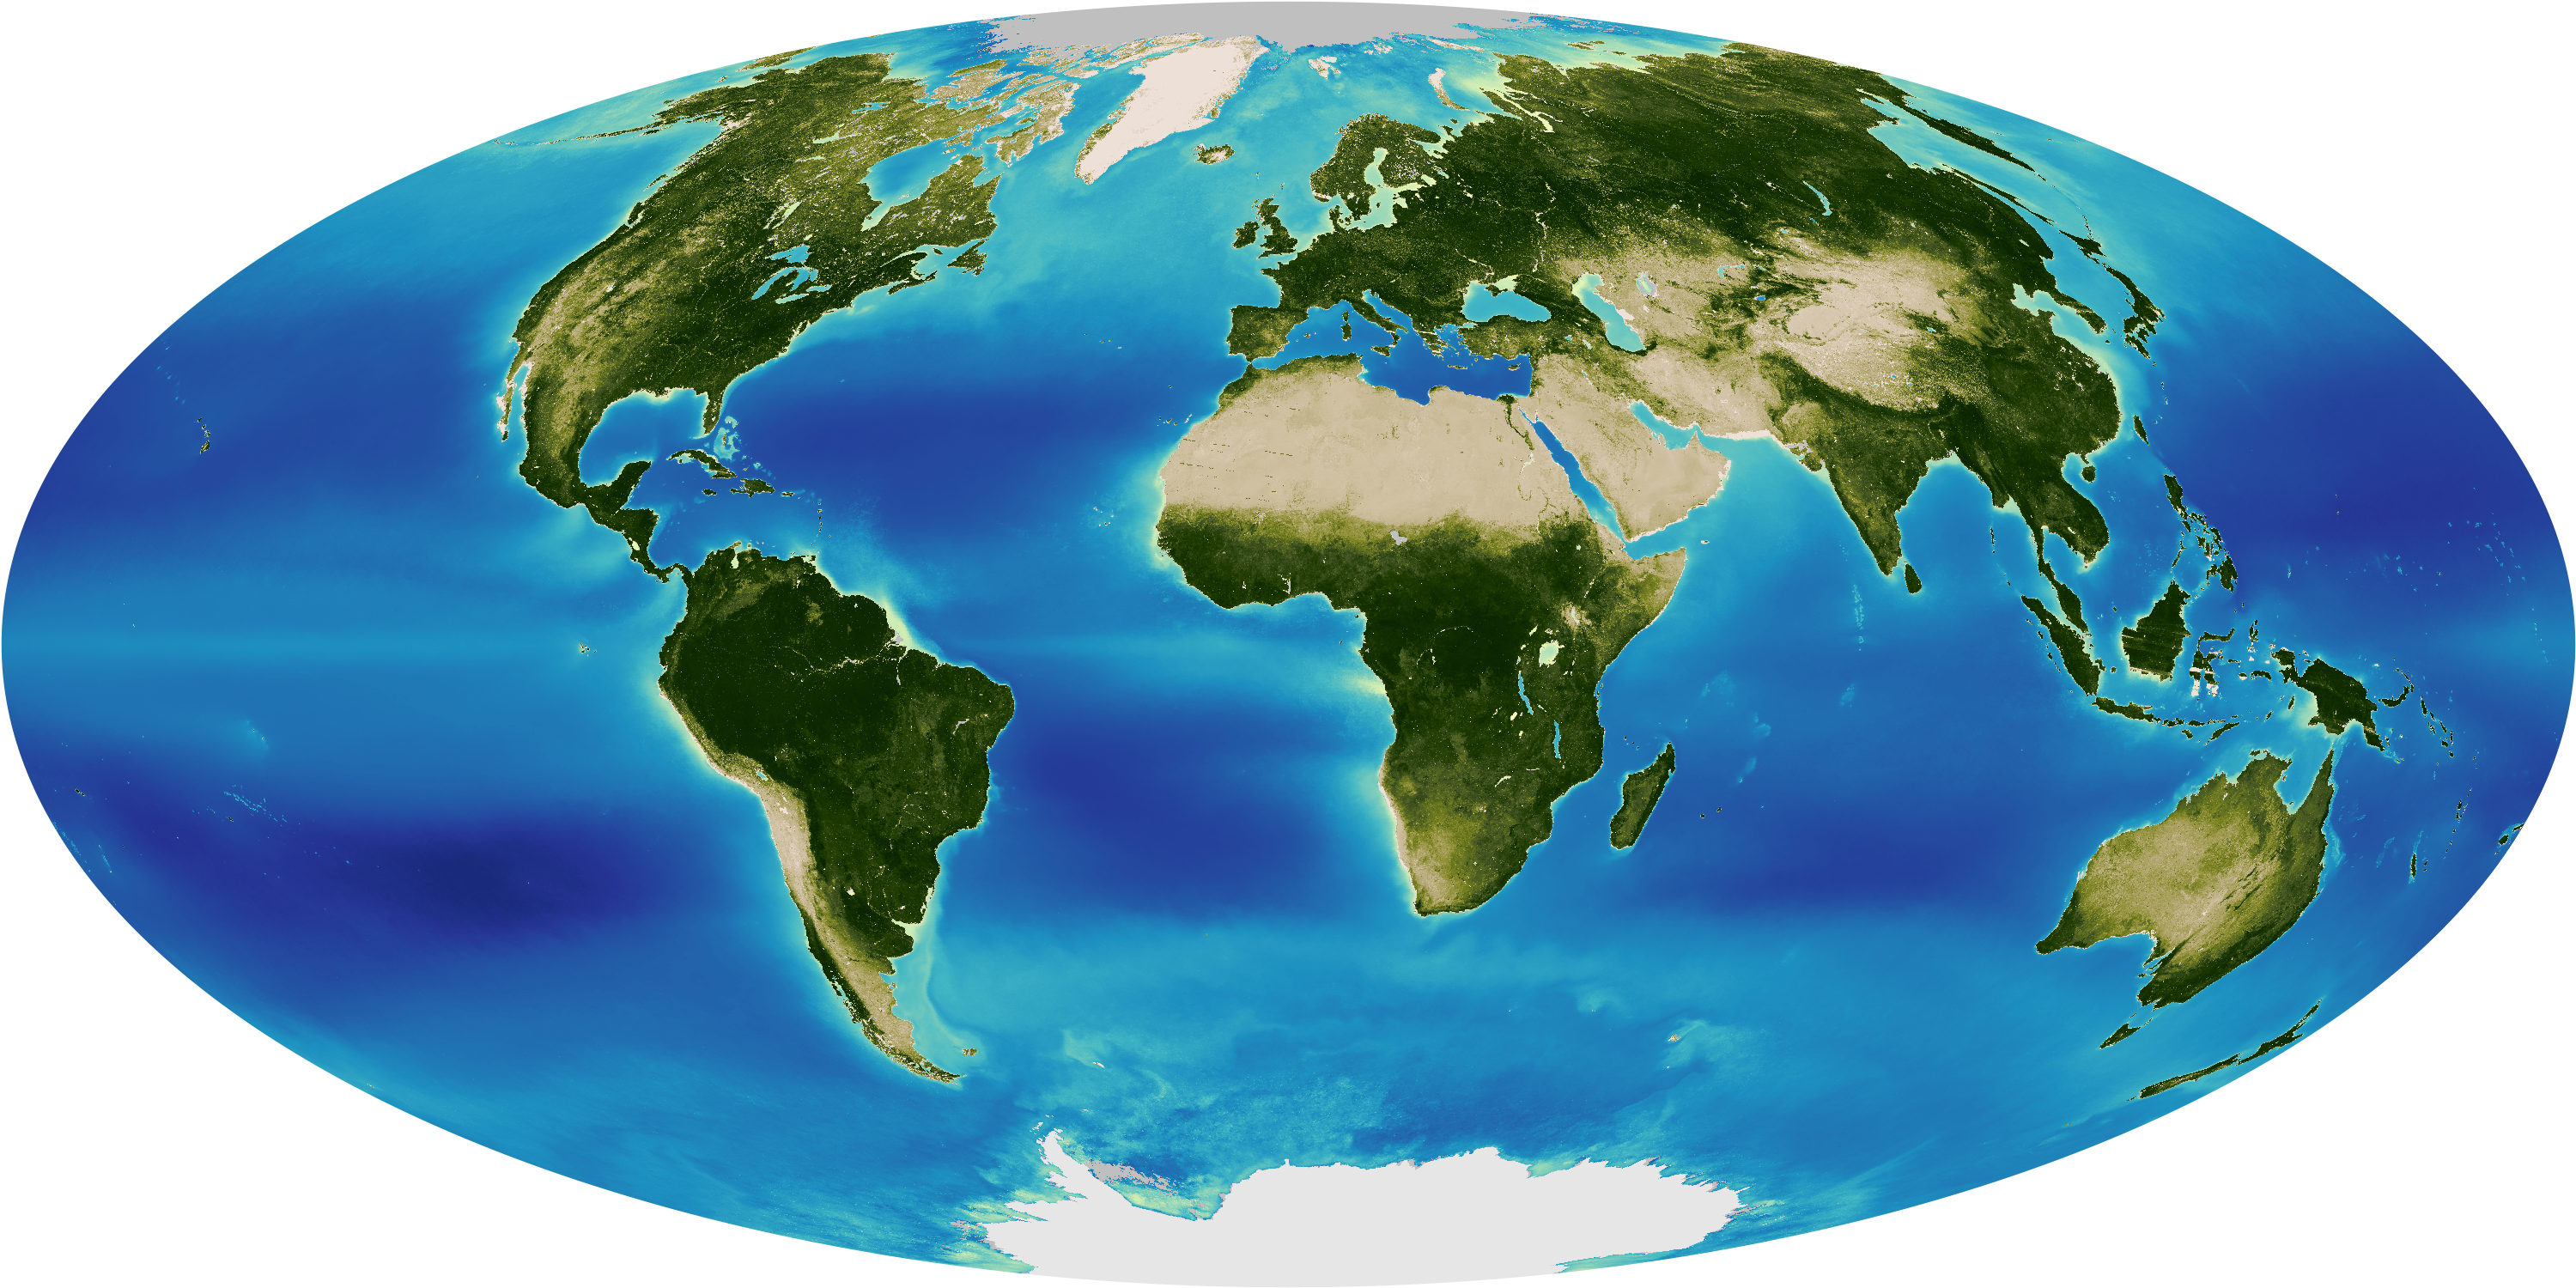
The image above shows SeaWiFS data as a global average over the entire 13-year record. For the oceans, the colors represent the concentration of chlorophyll and indicate where phytoplankton most often bloomed since 1998. On the land, data are depicted as a Normalized Difference Vegetation Index (NDVI), which shows the density of green vegetation. An NDVI of zero means no green plants and a high value (0.8 or 0.9) is a thick canopy of green leaves.
SeaWiFS was NASA’s first “data buy” mission, in which a private company (Orbital Sciences) designed and built the instrument and spacecraft to NASA specifications and NASA agreed to purchase the data as long at it met certain scientific requirements. (In later years, GeoEye operated the spacecraft.) The OrbView-2 spacecraft, which carried SeaWiFS, stopped communicating with Earth-based data stations in December 2010. After several months trying to revive the link, flight controllers officially ended the mission in February 2011.
SeaWiFS was designed to measure ocean color. This seemingly narrow measurement captures the fundamental biological activity at the ocean surface, the blooming and die-off of the phytoplankton that form the center of the oceanic food web. Its abundance is a direct indicator of the seas’ ability to support life. It also plays a central role in the oceans’ carbon uptake. SeaWiFS also was used to offer real-time monitoring of red tides and other harmful algae, which can bloom in polluted waters and be deadly to fish and oysters.
Modifications made to SeaWiFS before launch also allowed it to make a similar kind of measurement of plant color on land. This ability to see all of the planet’s plant life with a single, well-calibrated instrument produced a first-of-its-kind snapshot of the Earth’s biosphere in 1998, similar to the image above.
“There is no question that the Earth is changing,” said Feldman, SeaWiFS project manager at NASA's Goddard Space Flight Center. “SeaWiFS enabled us for the first time to monitor the biological consequences of that change—to see how the things we do, and how natural variability, affect the Earth's ability to support life.”
NASA Earth Observatory image by Jesse Allen, using data provided courtesy of the Ocean Color Web team. Caption by Patrick Lynch and Mike Carlowicz.
alert message