Land, sea, and air all meet along the coastline, and this intersection makes for some of the planet’s most compelling visual and scientific landscapes. But for all of their beauty, coastal regions are also among the most beautifully complex to study, particularly with satellites.
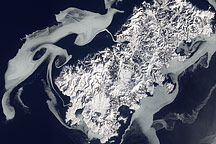
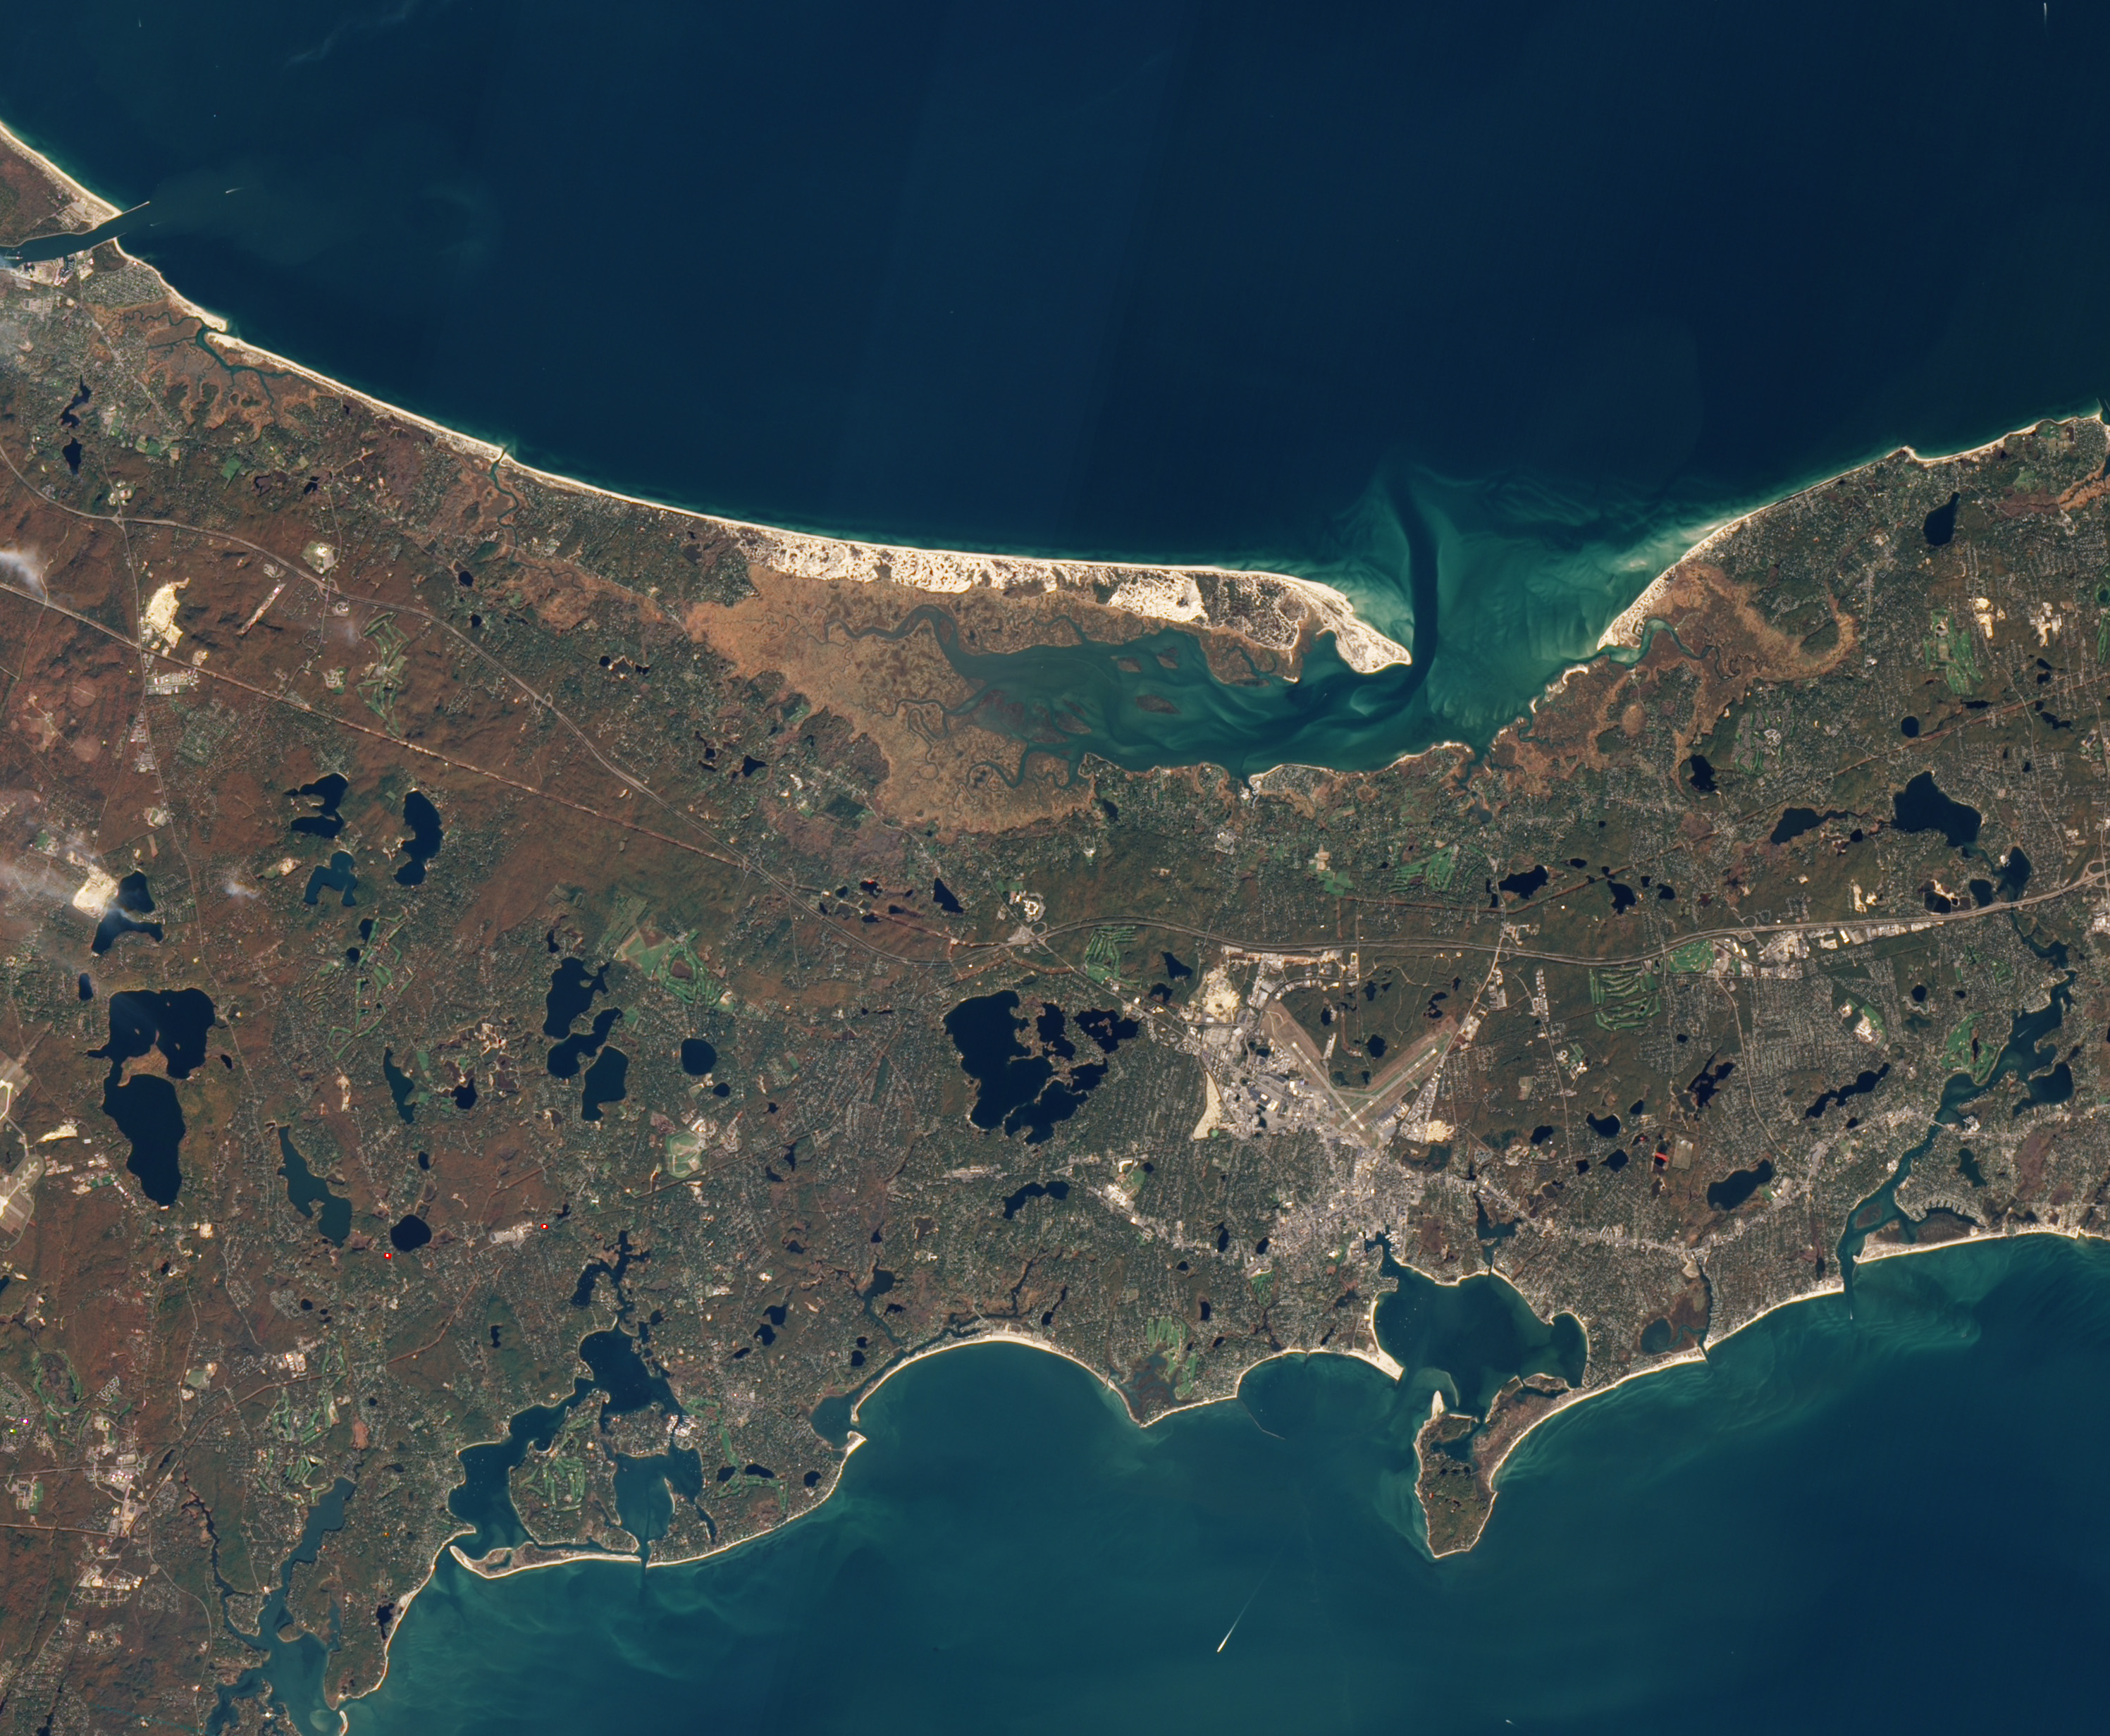
This natural-color image of Sandy Neck and Barnstable Harbor, on the north side of Cape Cod, Massachusetts, was acquired on November 4, 2005, by the Advanced Land Imager (ALI) on NASA’s Earth Observing-1 (EO-1) satellite. The barrier beach—which started forming about 4,000 years ago—is covered by hardy coastal shrubs and trees, with sand dunes standing tens of feet tall. The back bay is shallow and surrounded by marsh, though a dredged channel descends anywhere from 7 to 20 feet (2 to 6 meters) deep. Not far offshore, near the top of the image, water depths reach roughly 40 feet (12 meters).
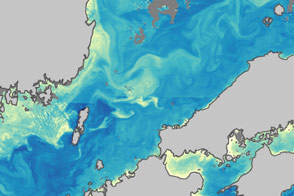
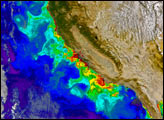
Satellite sensors can trace the shoreline and see the shallow bottom of some bays. They can trace oil and pollution slicks. They can detect the sediments—the sands, river mud, decaying organic matter, and even floating phytoplankton—drifting on or near the water surface. But in this turbid, colorful soup near the shore, it is hard for satellites to tell which ingredient is which. Read more in this excerpt from our new feature, “As the Seasons Change, Will the Plankton?”
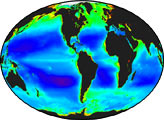
Since the launch of the Coastal Zone Color Scanner on the Nimbus 7 satellite in 1978, scientists have used various satellite instruments to examine the color of the ocean. That color is determined by how sunlight interacts with the particles, plants, and chemicals floating in the water. Nearly all phytoplankton, for instance, contain chlorophyll, which absorbs light at blue and red wavelengths and reflects green back into space. By observing the greenness of the ocean, scientists can say something about where marine plants are blooming and their abundance near the surface.
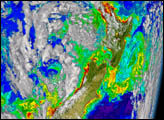
These data have been invaluable for assembling a truly global view of primary productivity. Still, the view can be imprecise and blurry, depending on where you look and what you want to see. “The existing satellite sensors are limited in their color range and resolution, which can make it difficult to accurately separate the different components of the ecosystem,” says Mike Behrenfeld, an oceanographer from Oregon State University who specializes in ocean productivity. “Most of the methods for analyzing ocean color were created for the global ocean, not the more complicated coastal areas.”
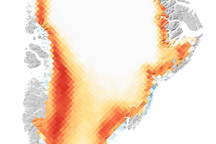
Coastal waters are murky with sediments, nutrients, and other dissolved organic compounds. They are also turbulent, with a lot of mixing between the surface and deep water. This natural “noise” distorts the signal back to the satellites, causing over- and under-estimates of phytoplankton blooms. That matters because coastal waters account for a significant amount of the overall productivity (15 to 21 percent annually), and the majority of activity that affects human uses of the ocean.
Read more about the color of the ocean and the study of our planet’s biggest food source—phytoplankton—and most important sink for carbon dioxide.
NASA Earth Observatory image by Robert Simmon, based on ALI data from Earth-Observing-1. Caption by Mike Carlowicz.