

Like rivers pouring into the sea, glaciers on the edge of the great ice sheets of Greenland and Antarctica feed a stream of ice into the ocean. Some glaciers move slowly, but others defy the glacial pace and speed to the ocean at rates greater than 100 meters per year. Many of these fast-moving glaciers are accelerating, thinning the ice sheets that feed them, adding an increasing amount of ice to the ocean, and raising global sea levels. Ice loss due to accelerating glaciers is so poorly understood, writes glaciologist Hamish Pritchard and colleagues in a September 2009, paper in Nature, that no one knows just how much such glaciers will affect sea levels throughout the next century.
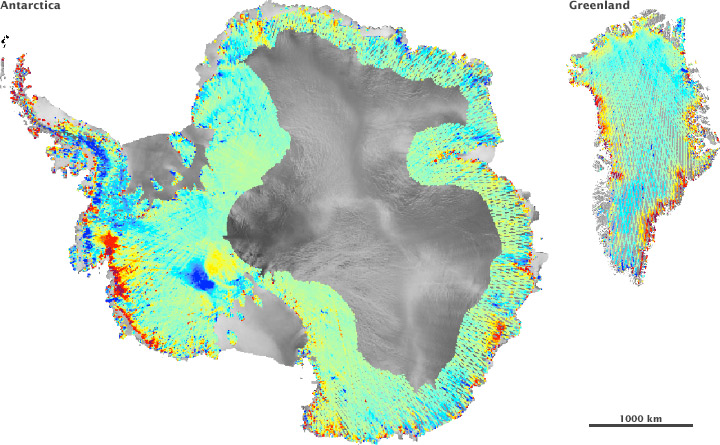
To understand how much fast-moving glaciers are changing the ice sheets, Pritchard, from the British Antarctic Survey, and colleagues Robert Arthern, David Vaughan, and Laura Edwards devised a new method to map out elevation change using data from NASA’s Ice, Cloud and land Elevation Satellite (ICESat). These images illustrate changes to the edges of the ice sheets between 2003 and 2007 as observed by ICESat. Places where glaciers thinned from lost ice over time are red, while areas where glaciers or the ice sheet gained ice are blue. Areas that were not a part of the analysis are gray. The data are in narrow bands, represented by the crossing lines that make up the image.
The greatest areas of ice loss are along the northwest and southeast coasts of Greenland and the west coast of Antarctica. The fastest changing glaciers are in Antarctica, where some glaciers thinned more than 9 meters per year. The average rate of thinning for fast-flowing glaciers in Greenland, said the authors, was 0.84 meters per year.
Areas where glaciers thinned most, shown in red, radiate in from the coast. “We think that warm ocean currents reaching the coast and melting the glacier front is the most likely cause of faster glacier flow,” said Pritchard. The thinning extends far inland, hundreds of kilometers in places. “This kind of ice loss is so poorly understood that it remains the most unpredictable part of future sea level rise,” said Pritchard.
The team’s measurements of widespread change based on satellite data are the most detailed to date. ICESat hosts a laser instrument, the Geoscience Laser Altimeter System, that records elevation by measuring the time it takes flashes of laser light to reflect off the surface of the Earth and return to the satellite. Higher elevation locations take less time to return a signal than lower elevation locations. The laser measures a very narrow track of land on each overpass around the Earth. As a result, the overlap between overpasses is limited, making it difficult to see how a single glacier has changed over time. Instead of measuring change in just the center of the “x” where two ICESat overpasses overlap, Pritchard and his colleagues looked at overpasses that are very close to one another, nearly overlapping. This approach increased the amount of information the scientists could use to track change on the ice sheets.
Images by Hamish D. Pritchard, Robert J. Arthern, David G. Vaughan, and Laura A. Edwards, British Antarctic Survey and University of Bristol. Published in Nature. Caption by Holli Riebeek.