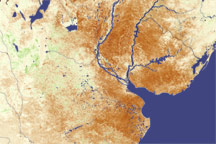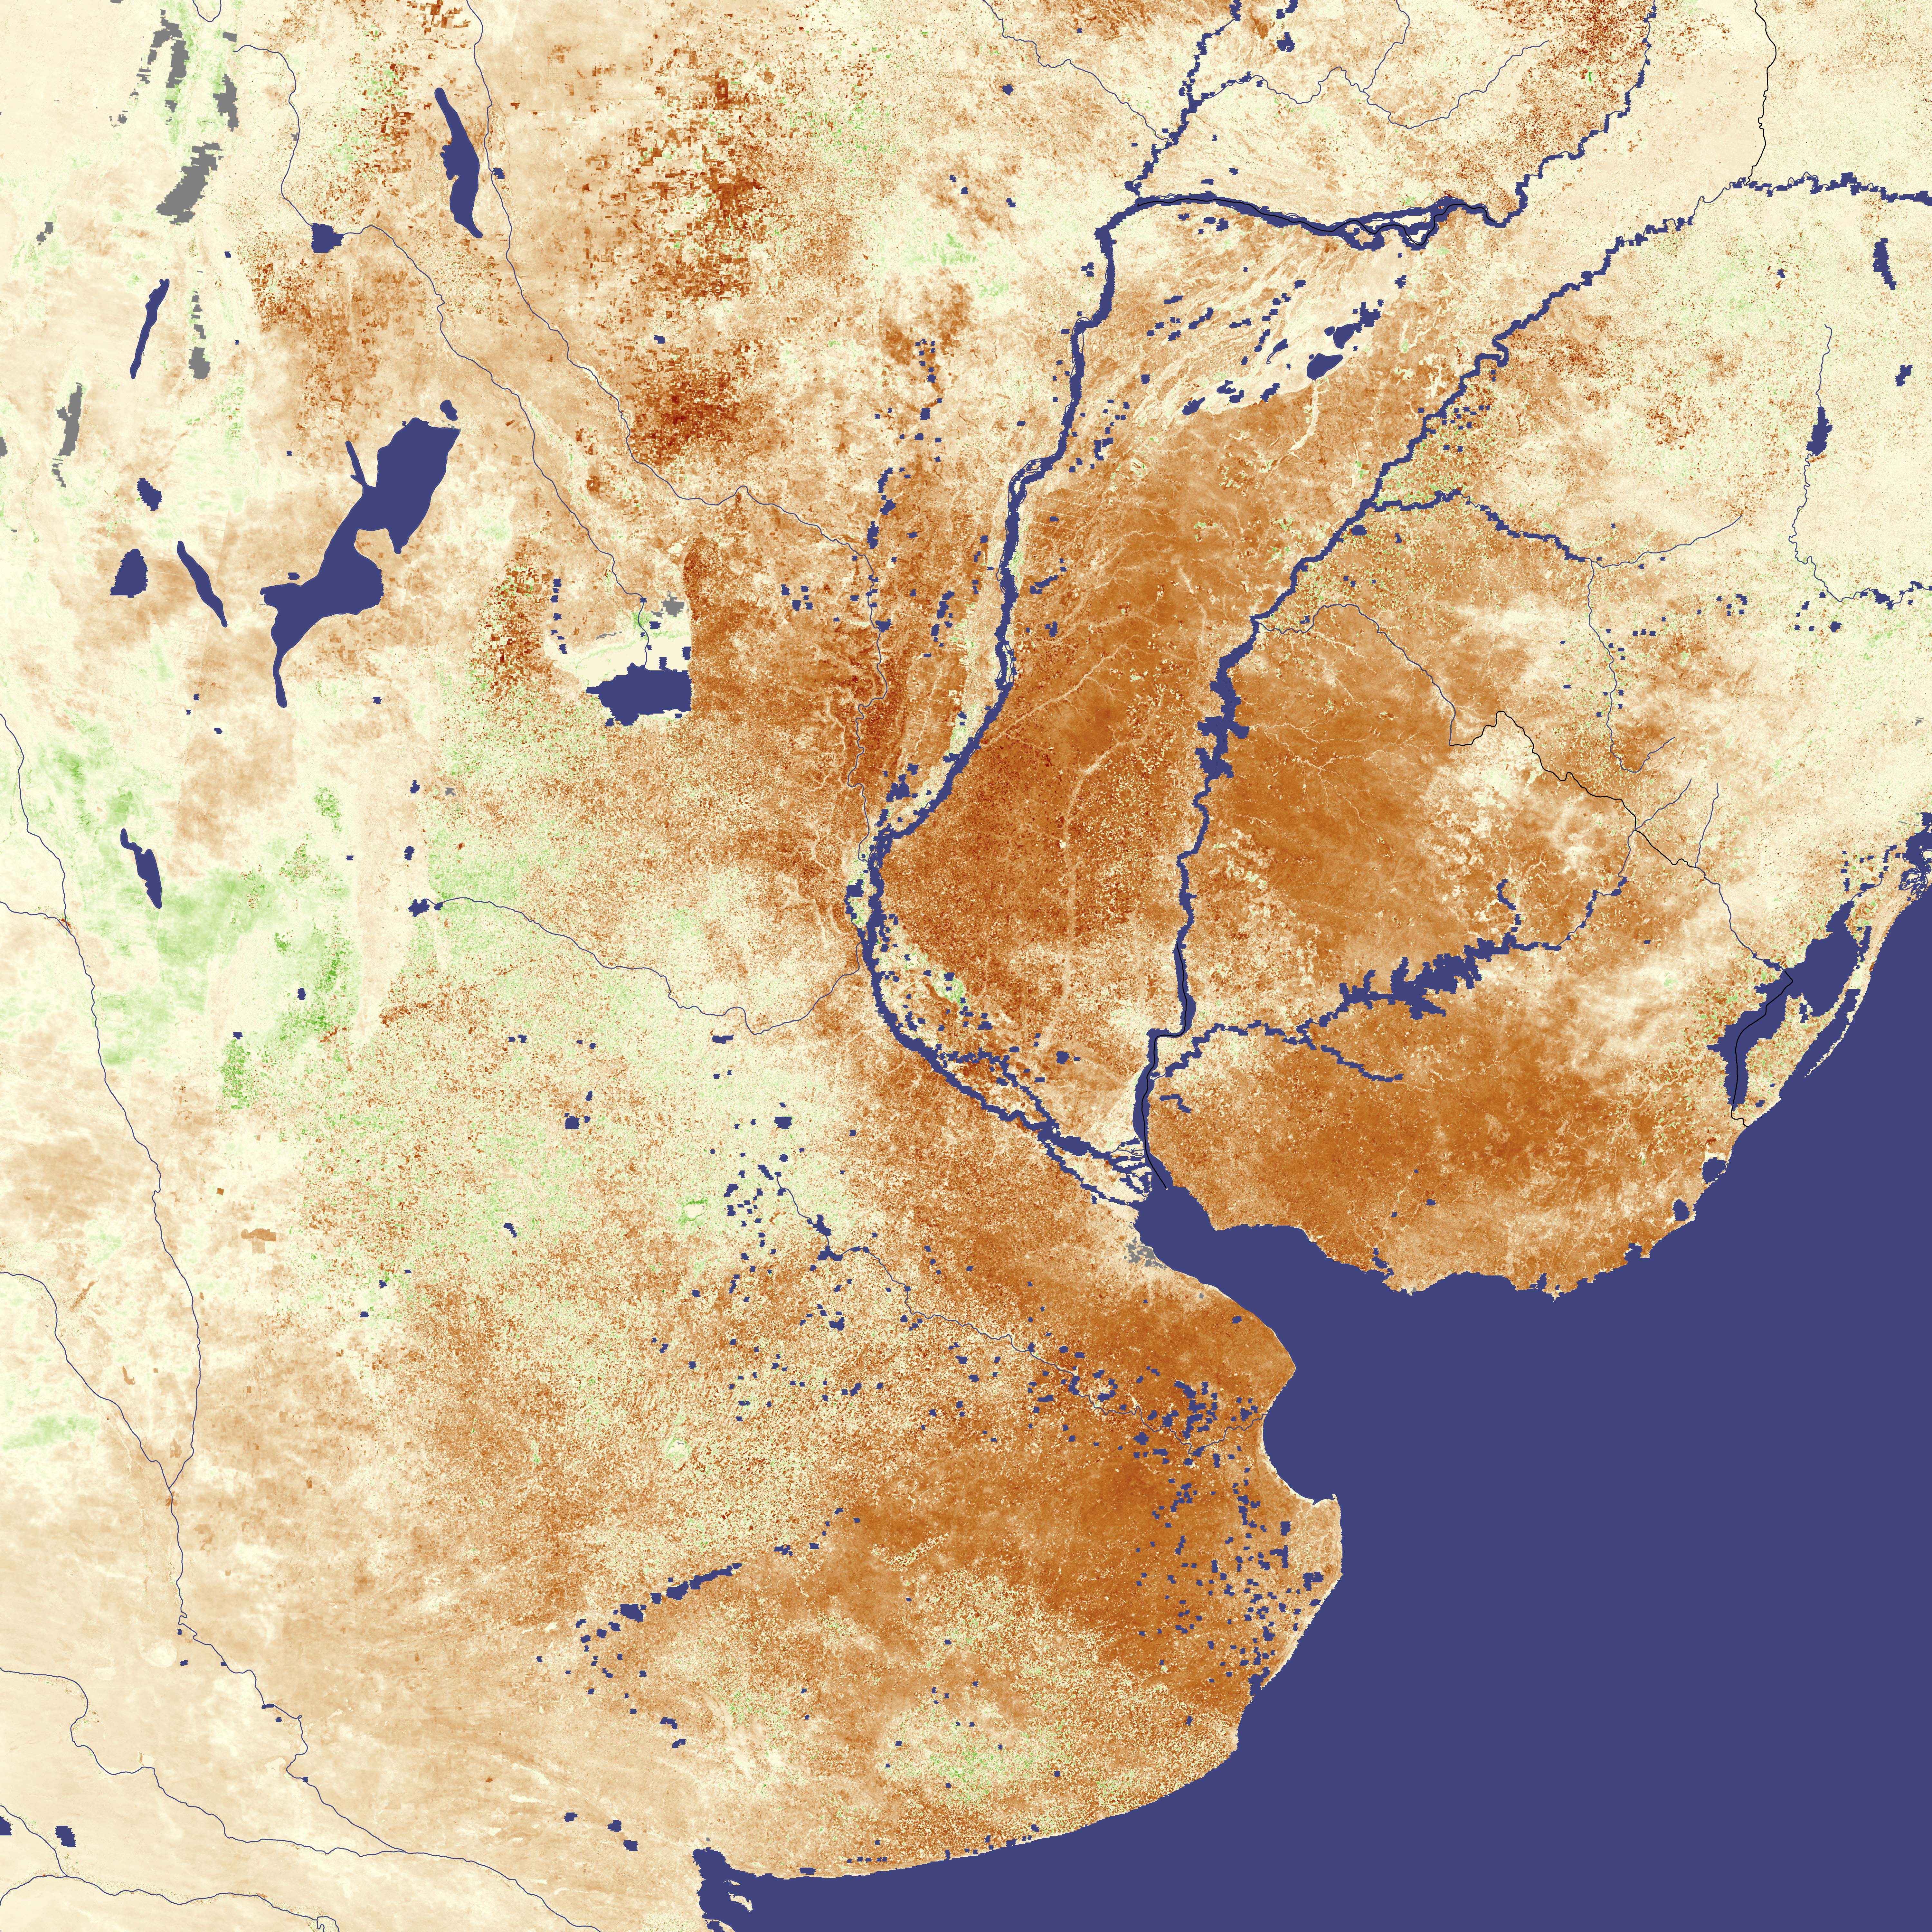
More than mere colors on the page, the blotches of brown and cream—with only faint dustings of green— in this image represent the impact of one of the worst droughts in southern South America in decades. Each tiny dot of brown is a two-kilometer square of land (250 meters per pixel in the large image) where plants were struggling to grow in the hot, dry weather. Since northern Argentina, Uruguay, and southern Brazil contain rich, intensively cultivated land, the dots include fields of corn, cotton, soy, wheat, or pastureland for grazing cattle. The brown tones reveal that these plants were growing far less vigorously than average in late January 2009.
From mid-November 2008 through mid-February 2009, unusual weather patterns brought extreme temperatures and low rainfall to this normally productive agricultural region. The period is critical for many crops, including cotton, wheat, soy, and corn. As a result, crop yields in the three countries were expected to dip, with Argentina suffering the worst blow, said the U.S. Department of Agriculture’s Foreign Agricultural Service (FAS). Even Argentina’s famous beef industry had been affected by the drought, reported BBC News, as pastureland disappeared, and cattle starved.
Considered individually, many of the brown dots in the image represent a personal disaster, a farmer facing the prospect of a poor harvest or a herd of malnourished or dying cattle. As a whole, the image conveys something of the severity and extent of the disaster. In simple terms, the vegetation index is a scale of the amount of light plants absorb during photosynthesis. By comparing current vegetation index values with values recorded at the same period in previous years, scientists can tell how well plants are growing. While the impact of drought on vegetation is occasionally visible in photo-like satellite imagery, the vegetation index comparison is a more precise way to evaluate the impact of drought.
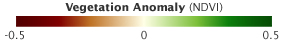
This image, based on observations from the Moderate Resolution Imaging Spectroradiometer (MODIS) on NASA’s Terra satellite, compares the vegetation index for January 17–February 1, 2009, to the average vegetation index during the same period from 2000 through 2008. Brown shows where the current vegetation index is lower than average, meaning that less photosynthesis was occurring; cream shows where conditions were average; and the few spots of green show where the vegetation index was higher than average. Darker shades of brown stretch from the Pampas grasslands of Argentina to the croplands in southern Brazil. Severe drought clearly impacted the entire region.
NASA image created by Jesse Allen, Earth Observatory, using data provided by Inbal Reshef, Global Agricultural Monitoring Project. Caption by Holli Riebeek.