Earth’s climate, including its average surface temperature, depends on the balance between incoming and outgoing energy. Energy comes in to the system when sunlight penetrates the top of the atmosphere. Energy goes out in two ways: reflection by clouds, aerosols, or the Earth’s surface; and thermal radiation—heat emitted by the surface and the atmosphere, including clouds. The balance between incoming and outgoing energy is Earth’s net radiation. Net radiation is how much energy is available to influence the climate system—to melt ice, to raise temperatures, or to evaporate water from the oceans.
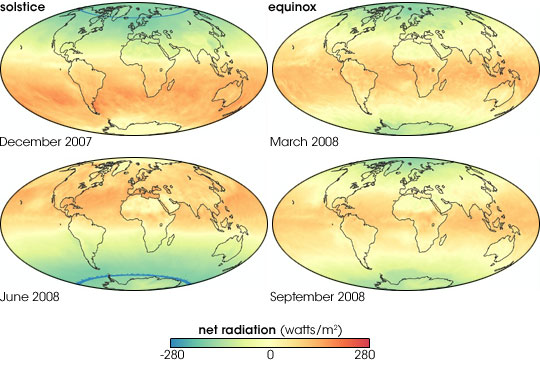
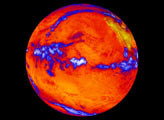
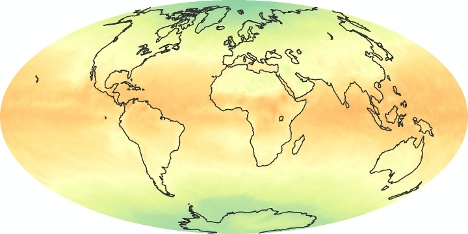
These monthly maps of net radiation are based on observations collected by the Clouds and the Earth’s Radiant Energy System (CERES) sensors on NASA’s Terra and Aqua satellites. Places where the amounts of incoming and outgoing energy were in balance are yellow. Places where more energy was coming in than going out (positive net radation) are red. Places where more energy was going out than coming in (negative net radiation) are blue-green.
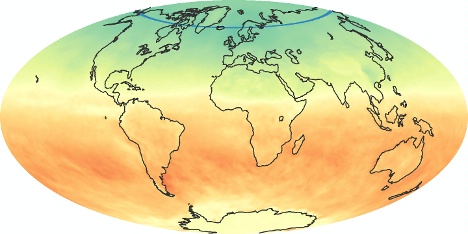
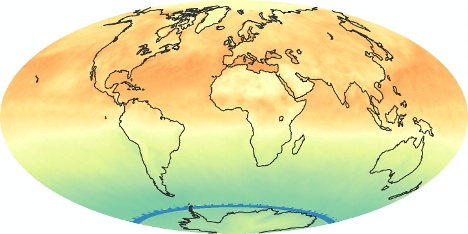
The maps and animation illustrate how net radiation varies over the year at key months in the solar cycle. In the months of the solstices, December (top left) and June (bottom left), the tilt in Earth’s rotational axis has its strongest influence on the amount of sunlight reaching the ground in each hemisphere. One hemisphere is tipped its farthest away from the Sun, and other is tipped toward it. Net radiation is strongly positive across the Southern Hemisphere in December, and strongly negative across the Northern Hemisphere. In June, the pattern reverses.
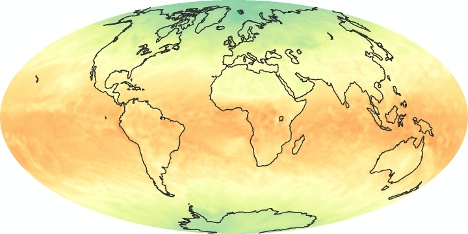
On the equinoxes, the amount of incoming sunlight is roughly equal in both hemispheres. The pattern of net radiation is more symmetrical: negative (green) at the poles, balanced (yellow) at the mid-latitudes, and positive (red) at the equator. Net radiation is negative at each pole because the amount of energy those areas absorbed from incoming sunlight was less than the amount they reflected and/or radiated as heat.
The blue line on the solstice maps shows a latitude band where the amount of incoming sunlight on many days was so small that CERES could not be certain it was really “seeing” it. Scientists know the amount of incoming sunlight there isn’t zero, but it is too small for CERES to detect it. When remote-sensing scientists write the computer programs to analyze the data, they tell the computers to specially flag this area of uncertainty and not to try to calculate the net radiation there. Poleward of that latitude, scientists know that there is no incoming sunlight at that time of year, so they can continue to calculate net radiation.
NASA images based on data courtesy the FLASHFlux team at NASA’s Langley Research Center. Caption by Rebecca Lindsey.
alert message


