view the 1-year movie (3.2 MB QuickTime)
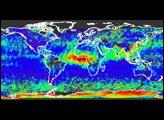
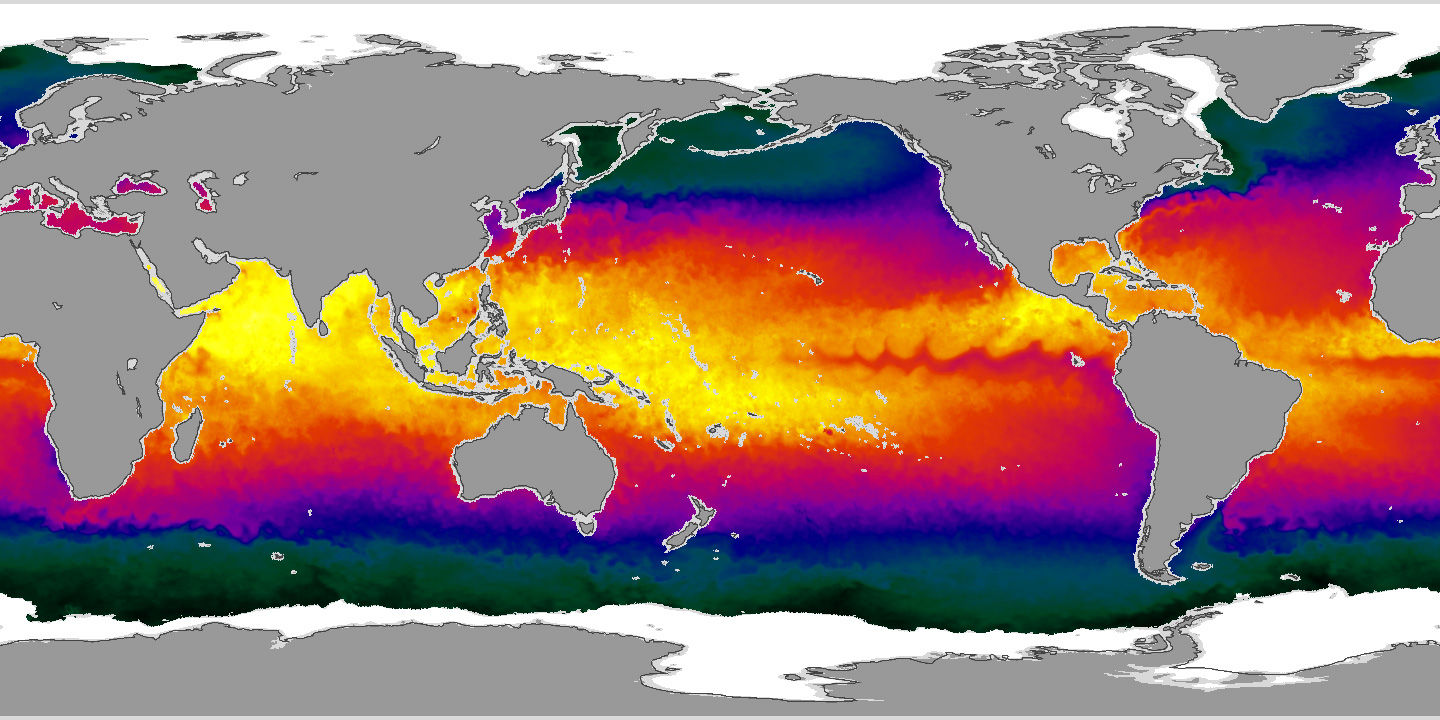
On May 4, 2002, NASA launched the Aqua satellite—the second of its Earth Observing System flagships. Since the mission’s science operations began, Aqua’s sensors have been returning spectacular views of our home planet. The image above shows global sea surface temperature as measured on June 1, 2003, by NASDA's Advanced Microwave Scanning Radiometer for EOS (AMSR-E) aboard the satellite.
The colors in this false-color map represent temperatures of the ocean’s surface waters, ranging from a low of -2°C (28°F) in the darkest green areas to a high of 35°C (95°F) in the brightest yellow-white regions. Sea ice is shown as white and land is dark gray. Note the continuous coverage that AMSR-E provides around the world—because it makes its measurements through clouds, there are no gaps in the data.
When viewed in sequence, the entire first year of AMSR-E daily global images (from June 1, 2002 through May 31, 2003) makes a fascinating movie (3.2 MB QuickTime). For instance, notice the intense upwelling of relatively cold water in the eastern Pacific, along the equator. Strong easterly trade winds push these cold surface waters toward the west, resulting in a characteristic wave pattern scientists call “ tropical instability waves.”
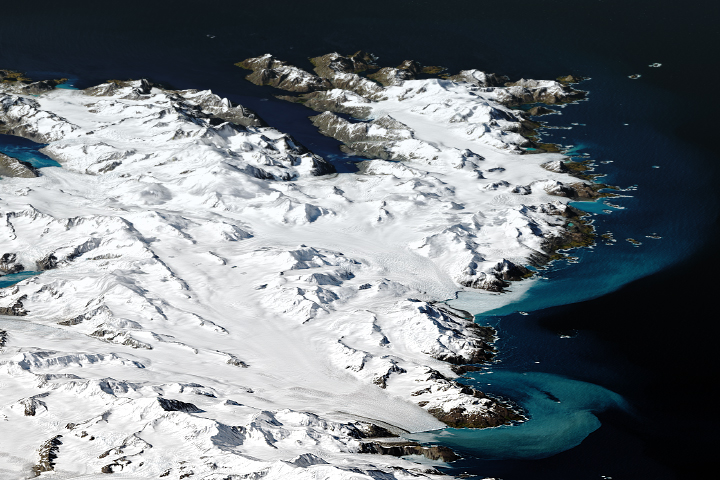
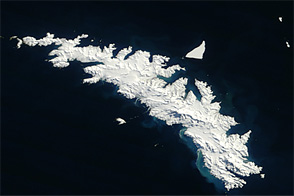
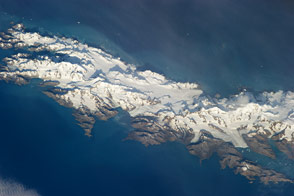
Another feature to watch for is the seasonal waxing and waning of the ice sheet around Antarctica. Note the tiny white blip that breaks away from the ice sheet in September 2002 and zig-zags its way from near the tip of the Antarctic Peninsula directly toward South Georgia Island in the Southern Atlantic. The blip appears to latch onto South Georgia Island in late October, where it is joined by another blip in December 2002, and both remain visible until March 2003. These blips are clusters of icebergs that broke away and sailed northward, driven by wind and currents to South Georgia Island. (Could the same current have played a role in guiding Sir Ernest Shackleton’s lifeboat from Elephant Island to South Georgia Island after his fateful voyage on the Endurance in April 1915?)
Image and animation by Jesse Allen, NASA Earth Observatory, produced using data processed and provided by Chelle Gentemann and Frank Wentz, Remote Sensing Systems. (NASDA = National Space Development Agency of Japan.)