

Forty years ago, scientists began developing instruments that could monitor Earth’s ozone layer by observing how the atmosphere scattered certain wavelengths of ultraviolet (UV) light. Twenty years after starting those measurements, scientists figured out that they could use the same observations to detect UV-absorbing aerosols in the air, such as volcanic ash, dust, and smoke. The aerosol index (AI) was born.
The aerosol index is not a strict numerical measurement; that is, it does not count particles, but instead provides a qualitative measure of how dense aerosols may be over a given area. While it lacks some precision, it has the benefit of seeing aerosols over and around clouds. With these measurements, researchers can examine the movement of aerosols over time and space, and even make some general assessments of trends. They can work backwards along a trail of airborne particles and figure out the source. And they can provide useful information for aviators who need to steer clear of debris like volcanic ash.
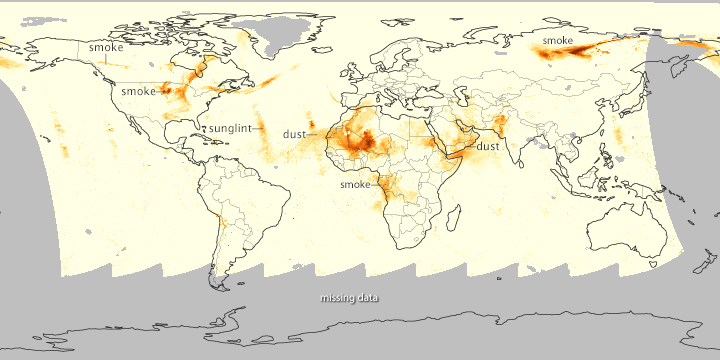
In mid-July 2014, the skies were ripe with aerosols, according to Colin Seftor of the OMPS science team at NASA. The top image maps the aerosol index for July 19, as measured by the Ozone Mapping and Profiler Suite (OMPS) on the Suomi NPP satellite. The denser the aerosol level in the atmosphere, the darker the shade of orange.
In the center of the map, dust from the Sahara and Thar deserts, the Arabian Peninsula, and the Horn of Africa shroud parts of the Middle East and North Africa, reaching out into the Atlantic and Indian Oceans. Seasonal, agricultural fires also appear along the Atlantic coast of central Africa. Regular stripe patterns across the oceans are an effect of sunglint—where sunlight is reflected off the water and directly back at the sensor. Gray areas are places where the satellite did not collect data that day.
Across the Northern Hemisphere on the OMPS map, fires in northwestern Canada and northern Russia have a long reach. In Canada, the fires in British Columbia gave a relatively light aerosol signal on July 19, though it was much more intense on previous days. However, some plumes appear to have moved south and east into the northern Plains of the United States, while others can be spotted over the Canadian Maritimes and as far east as Portugal. In Russia, the signal is particularly strong due to fires in boreal forests. Plumes from previous days appear to be headed for the Bering Sea and Alaska (far left and right of the map).
This natural-color image was acquired on July 19 by the Moderate Resolution Imaging Spectroradiometer (MODIS) on NASA’s Aqua satellite. It shows fires raging in Siberia and producing thick smoke plumes. The red boxes are hot spots where MODIS detected heat signatures that indicate fire. Note the tan pall over the top of the clouds on the left side of the image.

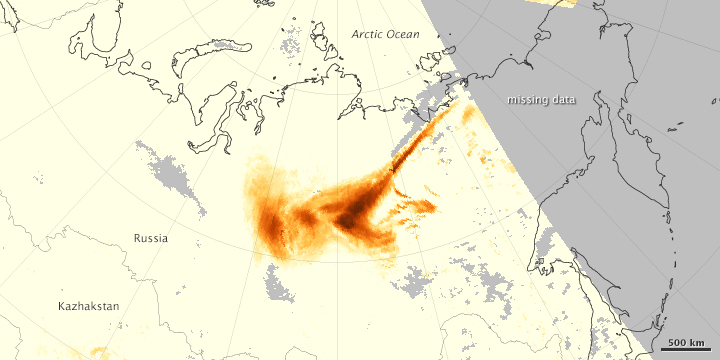
Another, regional map from OMPS provides a different view of the natural-color scene. The densest airborne aerosols appear as deep red-orange pixels on the map and line up roughly with the darkest tan layers on the MODIS image. Those intense signals often tip scientists off to the presence of pyrocumulus cloud formation. Pyrocumulus clouds are similar to cumulus clouds, but the heat that forces moist air to rise comes from fire instead of the sun-warmed ground. Scientists monitor pyrocumulus clouds closely because they can inject smoke and pollutants high into the atmosphere and affect air quality over a broad area.
Read more in tomorrow’s Image of the Day about other ways the July 2014 fires and aerosols were monitored from space. You can also follow daily measurements of the aerosol index, as well as developments in the ozone layer, on the OMPS science team blog.
NASA Earth Observatory image by Jesse Allen, using Suomi NPP OMPS data provided courtesy of Colin Seftor (SSAI). Suomi NPP is the result of a partnership between NASA, NOAA and the Department of Defense. Caption by Mike Carlowicz, with image interpretation from Colin Seftor, SSAI and OMPS science team.