The Columbia Glacier descends from an icefield 3,050 meters (10,000 feet) above sea level, down the flanks of the Chugach Mountains, and into a narrow inlet that leads into Prince William Sound in southeastern Alaska. It is one of the most rapidly changing glaciers in the world.
The Columbia is a large tidewater glacier, flowing directly into the sea. When British explorers first surveyed it in 1794, its nose—or terminus—extended south to the northern edge of Heather Island, near the mouth of Columbia Bay. The glacier held that position until 1980, when it began a rapid retreat that continues today.
These false-color images, captured by Landsat satellites, show how the glacier and the surrounding landscape has changed since 1986. The images were collected by similar sensors—the Thematic Mapper (TM), the Enhanced Thematic Mapper Plus (ETM+), and the Operational Land Imager (OLI)—on four different Landsat satellites (4, 5, 7, and 8).
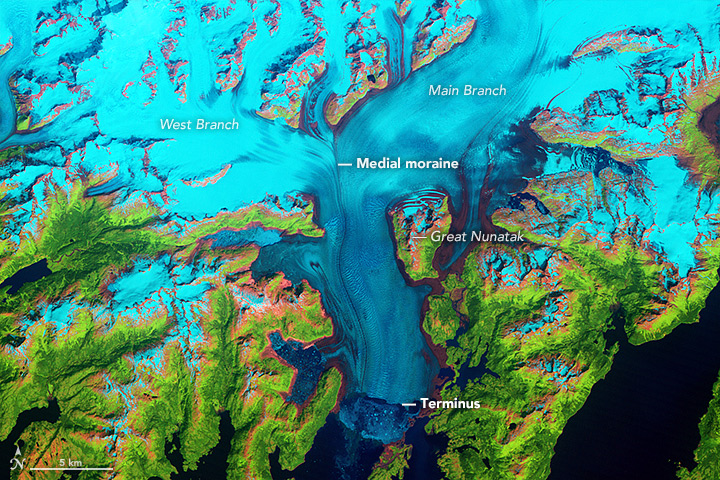
The images above combine shortwave-infrared, near-infrared, and green portions of the electromagnetic spectrum. With this combination of wavelengths, snow and ice appear bright cyan, vegetation is green, clouds are white or light orange, and open water is dark blue. Exposed bedrock is brown, while rocky debris on the glacier’s surface is gray.
Since the 1980s, the terminus has retreated more than 20 kilometers (12 miles) to the north, moving past Terentiev Lake and Great Nunatak Peak. In some years, the terminus retreated more than a kilometer, though the pace has been uneven. The movement of the terminus stalled between 2000 and 2006, for example, because the Great Nunatak Peak and Kadin Peak (directly to the west) constricted the glacier’s movement and held the ice in place.
As the glacier terminus has retreated, the Columbia has thinned substantially, as shown by the expansion of brown bedrock areas in the Landsat images. Since the 1980s, the glacier has lost more than half of its total thickness and volume. Rings of freshly exposed rock, known as trimlines, become especially prominent around the inlet throughout the 2000s.
Just south of the terminus, a layer of floating ice is dimpled with chunks of icebergs that have broken off, or calved, from the glacier and rafted together. The area and thickness of this layer, called the ice “mélange,” varies depending on recent calving rates and ocean conditions. In most of the images in the series (particularly 1989 and 1995), the mélange extends south to Heather Island, marking the point at which the glacier reached its greatest extent.
Like bulldozers, glaciers lift, carry, and deposit sediment, rock, and other debris from Earth’s surface. This mass accumulates on the ice’s leading edges in piles called moraines. The Columbia’s moraine created a shallow underwater ridge, or shoal, that prevents the mélange from drifting beyond it.
The structure of Columbia’s moraine played a large role in the stability of the glacier before 1980. Like other tidewater glaciers, the Columbia built up a moraine over time, and the mixture of ice and rock functioned like a dam keeping out the sea. It was supported on one end by the shoreline and by the underwater terminal moraine at the other. When the glacier retreated off the moraine around 1980, the terminus lost a key source of support. Once freed from this anchoring point, the grinding and dragging between the sea floor and the massive block of ice was reduced, increasing the rate at which ice flowed forward and icebergs calved from the glacier.
Between 2007 and 2010, part of the terminus began to float as it passed through deep water between the Great Nunatak Peak and Kadin Peak. This changed the way icebergs calved significantly. When the Columbia was grounded, calving occurred at a fairly steady rate, and the bergs that broke off were small. When the glacier began to float, larger chunks of ice tended to break off, as seen in the image from 2009.
The retreat has also changed the way the glacier flows. In the 1980s, there were three main branches. The medial moraine, a line of debris deposited when separate channels of ice merge (seen here as a line in the center of the 1986 image) served as a dividing line between two of the main branches. In 1986, there was a branch to the west of the medial moraine (West Branch), a large branch that flowed to the east of it (Main Branch), and a smaller branch that flowed around the eastern side of Great Nunatak Peak.
As the Columbia lost mass and thinned, the flow in the smallest branch stalled, reversed, and eventually began flowing to the west of Great Nunatak Peak. By 2011, the retreating terminus essentially split the Columbia into two separate glaciers, with calving now occurring on two distinct fronts.
The West Branch was thought to have stabilized by 2011, but it surprised scientists with an unexpected retreat that shows up in the 2013 image. By 2019, scientists again thought the branch could be at the limit of its retreat. But until the glacier can be visited in person, they cannot say for sure.
In 2014, researchers found that the Main Branch had thinned so much that it no longer had traction against the bed. With less traction, the glacier can be affected by tidal motion as far as 12 kilometers (7.5 miles) upstream, leaving the Main Branch unstable again. The branch resumed retreat, and in 2019 shed ample icebergs during an anomalously warm summer.
The retreat of the Columbia Glacier contributes to global sea-level rise, mostly through iceberg calving. This one glacier accounts for nearly half of the ice loss in the Chugach Mountains. However, the ice losses are not exclusively tied to increasing air and water temperatures. Climate change may have given the Columbia an initial nudge off of the moraine, but mechanical processes help drive its disintegration. When the Columbia reaches the shoreline, its retreat will likely slow down. The more stable surface will cause the rate of calving to decline, making it possible for the glacier to start rebuilding a moraine and advancing once again.
NASA images by Jesse Allen and Robert Simmon, using Landsat 4, 5, 7, and 8 data from the USGS Global Visualization Viewer. Thanks to Shad O’Neel and Robert McNabb for image interpretation and editorial guidance.

